This site needs JavaScript to work properly. Please enable it to take advantage of the complete set of features!
Skip to main page content
U.S. flag

An official website of the United States government

Dot gov

The .gov means it’s official.
Federal government websites often end in .gov or .mil. Before sharing sensitive information, make sure you’re on a federal government site.

Https

The site is secure.
The https:// ensures that you are connecting to the official website and that any information you provide is encrypted and transmitted securely.

NIH NLM Logo
Log in
Access keys NCBI Homepage MyNCBI Homepage Main Content Main Navigation
. 2020 Jun 25;181(7):1582-1595.e18.
doi: 10.1016/j.cell.2020年05月01日2. Epub 2020 Jun 2.

A Unified Model for the Function of YTHDF Proteins in Regulating m6A-Modified mRNA

Affiliations

A Unified Model for the Function of YTHDF Proteins in Regulating m6A-Modified mRNA

Sara Zaccara et al. Cell. .

Abstract

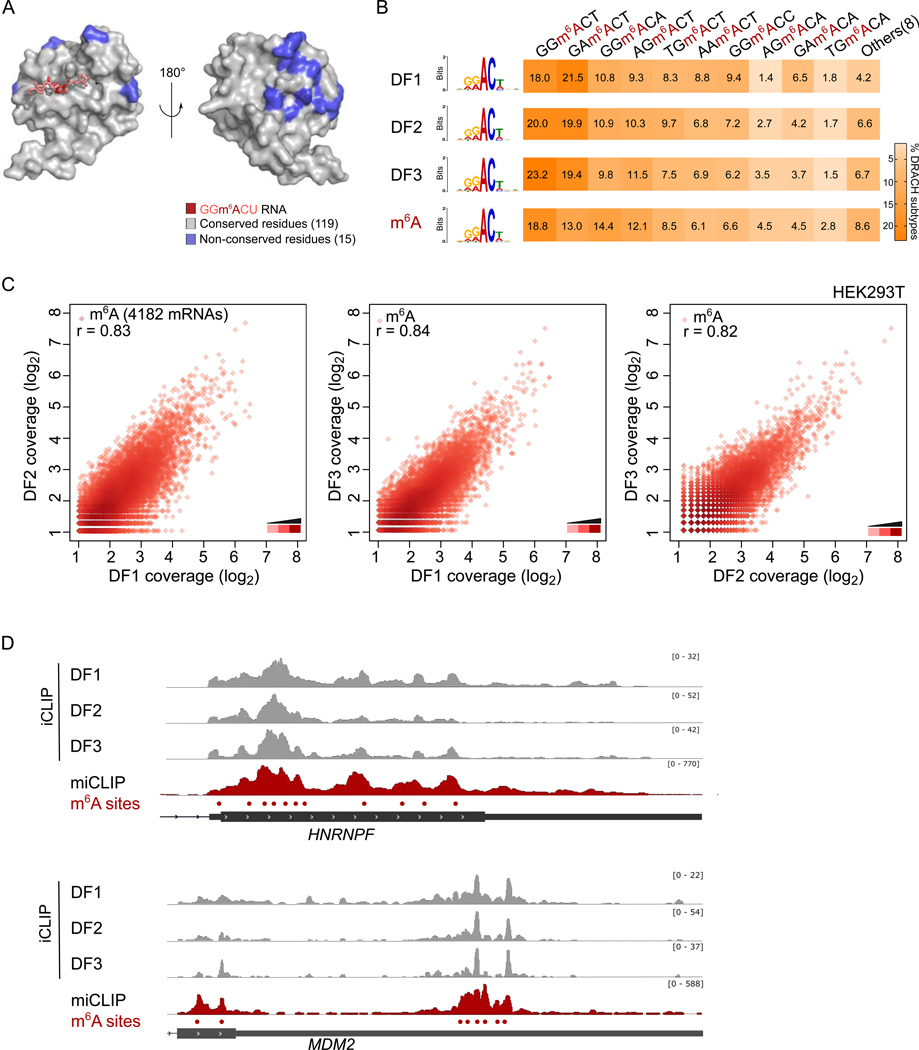
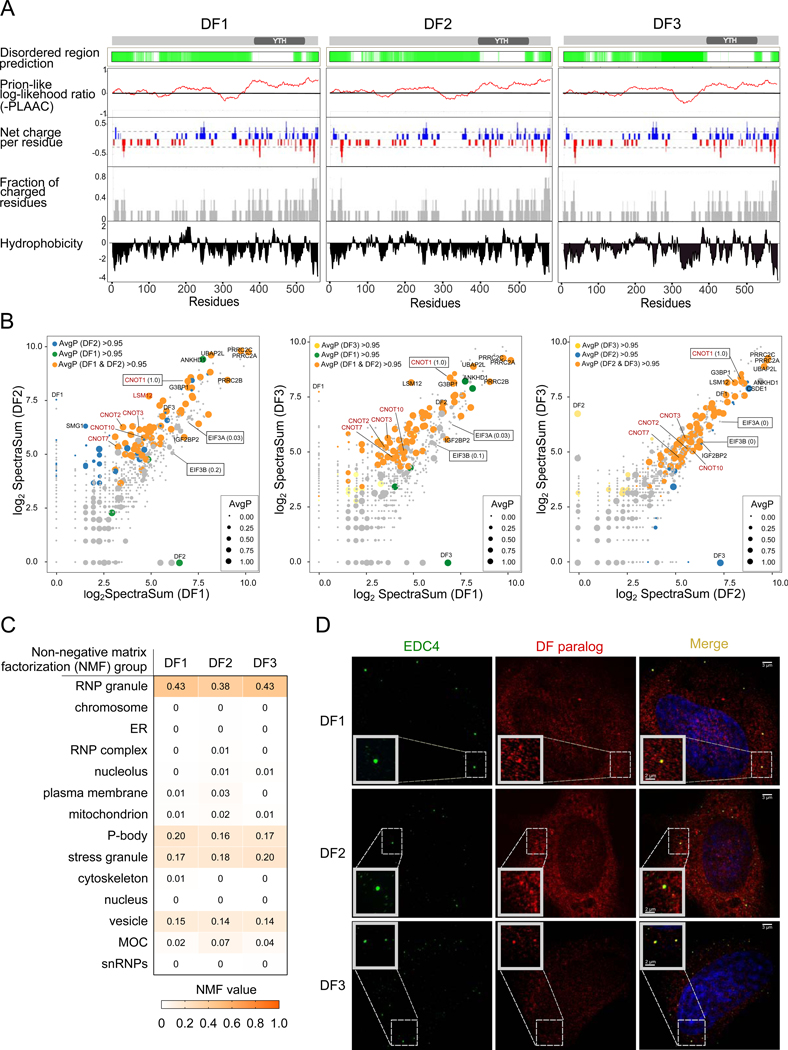
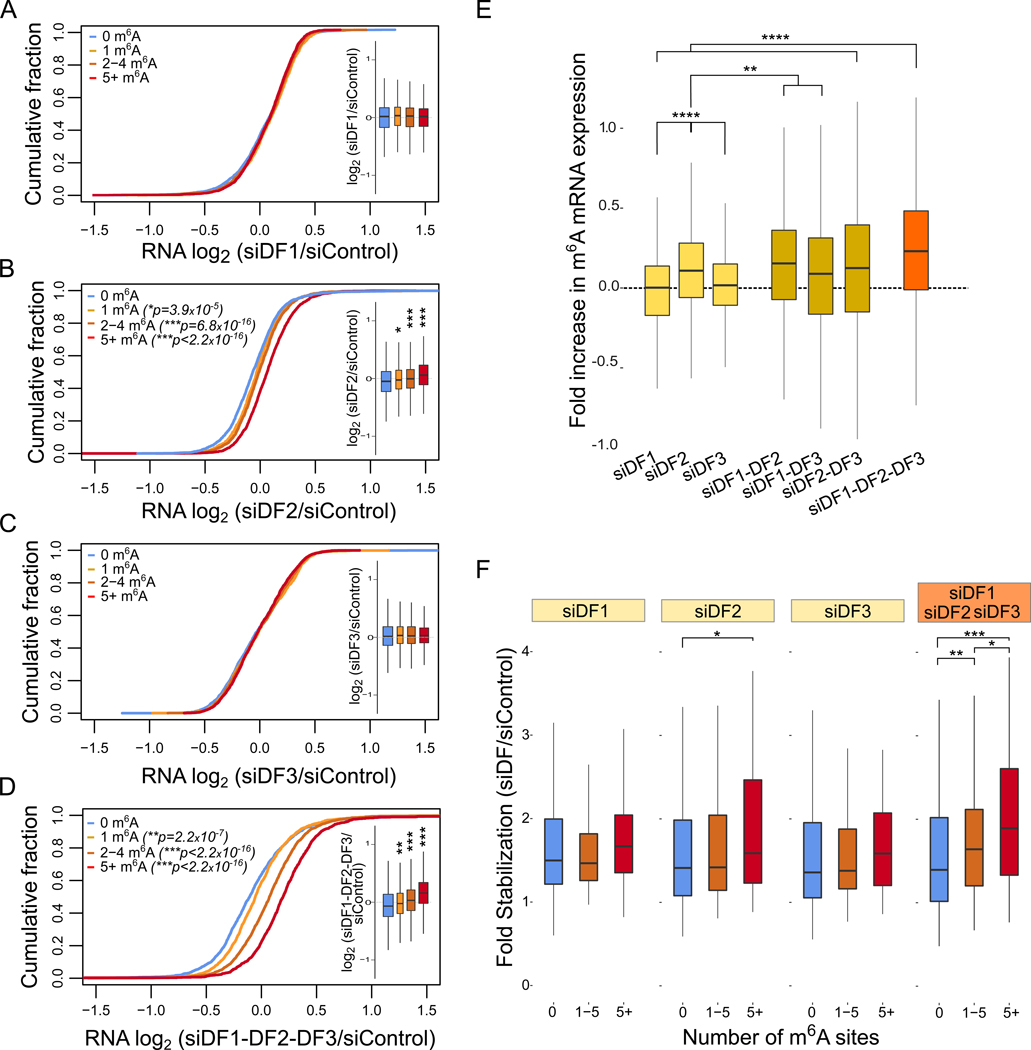
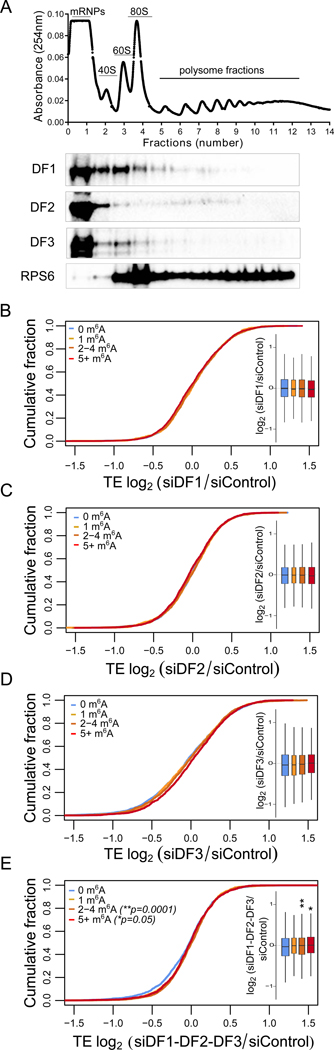
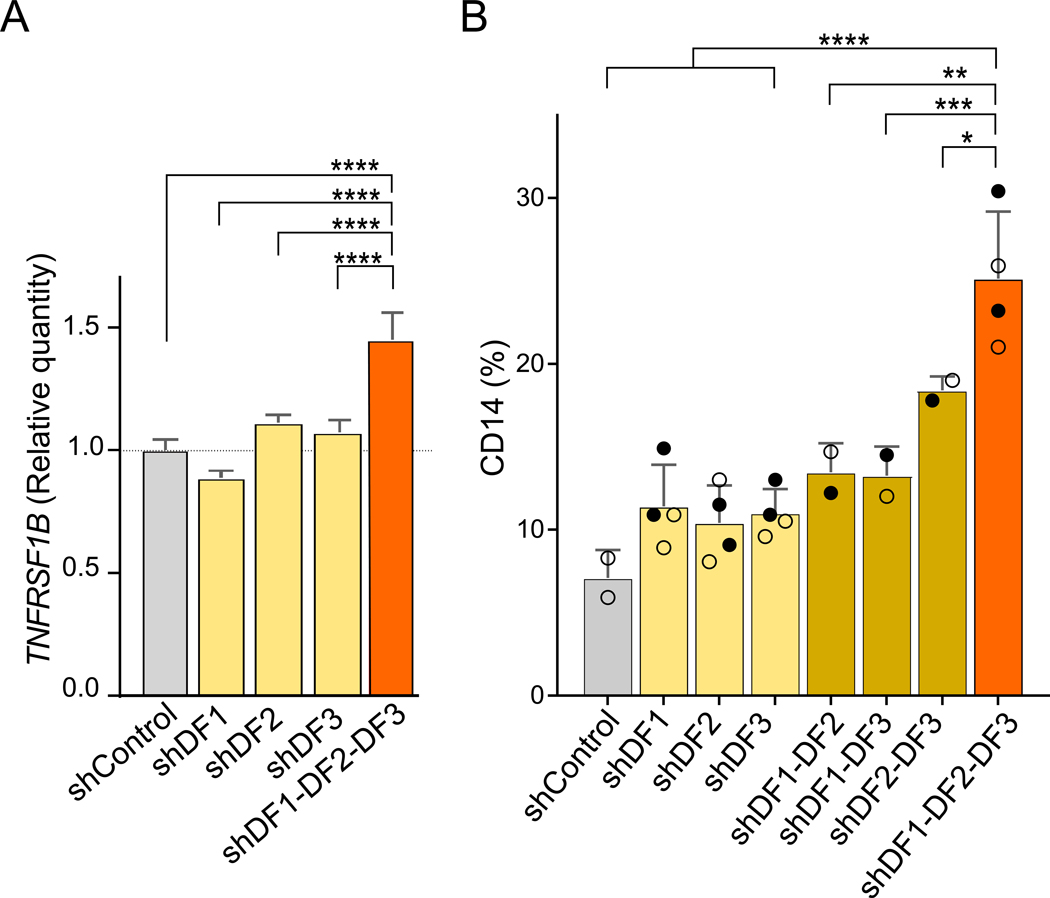
N6-methyladenosine (m6A) is the most abundant mRNA nucleotide modification and regulates critical aspects of cellular physiology and differentiation. m6A is thought to mediate its effects through a complex network of interactions between different m6A sites and three functionally distinct cytoplasmic YTHDF m6A-binding proteins (DF1, DF2, and DF3). In contrast to the prevailing model, we show that DF proteins bind the same m6A-modified mRNAs rather than different mRNAs. Furthermore, we find that DF proteins do not induce translation in HeLa cells. Instead, the DF paralogs act redundantly to mediate mRNA degradation and cellular differentiation. The ability of DF proteins to regulate stability and differentiation becomes evident only when all three DF paralogs are depleted simultaneously. Our study reveals a unified model of m6A function in which all m6A-modified mRNAs are subjected to the combined action of YTHDF proteins in proportion to the number of m6A sites.

Keywords: translation, mRNA stability, m(6)A, METTL3, YTHDF1, YTHDF2, YTHDF3, CLIP, RNA-binding.


Conflict of interest statement

Declaration of Interests S.R.J. is scientific founder of, advisor to, and owns equity in Gotham Therapeutics.

Figures

Fig. 1
Fig. 1. DF proteins bind the same m6A sites throughout the transcriptome
(A) The amino acids that contact m6A and the m6A-proximal nucleotides are conserved in the DF1, DF2 and DF3 YTH domain. Conserved (grey) and non-conserved amino acids (blue) are shown on the YTH domain, rendered from the DF1-m6A-RNA structure (Xu et al., 2015). Conserved is defined as amino acids identical in all three DF paralogs, while non-conserved is defined as amino acids that are different in at least one DF paralog. Front view (left), back view (rotated 180°, right). (B) DF1, DF2, and DF3 have similar binding preferences for different m6A submotifs. Shown is the prevalence of different binding sites recognized by DF1, DF2, DF3 based on iCLIP binding data. For comparison, the percentage of each DRACH motif identified by miCLIP is shown. The three DF paralogs have similar binding site preferences. Their binding preferences are similar to the prevalence of the m6A sequence motifs. (C) Each m6A site in the transcriptome binds DF1, DF2, and DF3. DF1, DF2, and DF3 binding at 4182 m6A mRNAs was based on DF1, DF2, and DF3 iCLIP datasets in HEK293T cells (Patil et al., 2016). m6A sites are plotted as points in which the x and y coordinates represent the number of normalized DF iCLIP reads overlapping that site (log2 normalized). We did not find m6A sites that preferentially bound either DF1, DF2, or DF3. The high Pearson correlation coefficients (r) show that DF paralogs have highly similar binding preferences. Similar results were found in HeLa cells using DF PAR-CLIP datasets (Figure S1E). (D) DF1, DF2, and DF3 iCLIP reads show a similar distribution in mRNAs, which resembles themiCLIP read distribution. Representative examples of DF1, DF2 and DF3 iCLIP read distribution and miCLIP read distribution on HNRNPF and MDM2. iCLIP and miCLIP data shown here was obtained in HEK293T cells and was similar to data obtained in HeLa cells (Figure S1F–1H).
Fig. 2
Fig. 2. DF proteins exhibit similar binding partners and intracellular localization
(A) The three DF paralogs have similar intrinsically disordered regions, hydrophobicity, andamino acid charge distribution along the length of their effector domains. A schematic representation of each DF protein is shown with the YTH domain indicated. Green indicates disordered regions (see STAR Methods). Each of these physiochemical parameters show high similarity among all DF paralogs, suggesting that these proteins may exhibit similar properties. (B) DF paralogs show similar binding preferences for their high-confidence interacting proteins.Shown are pairwise comparisons of the average spectral counts of peptides derived from each protein identified as a DF paralog interactor in vivo (Youn et al., 2018). Each protein interactor is plotted as a circle in which x and y coordinates represent the average spectral counts calculated based on a Bio-ID study of each DF paralog (log2 normalized values). The diameter is proportional to the average probability of interaction (AvgP). As indicated by the orange circles (high-confident interactors with AvgP > 0.95 for both DF paralogs), there is high level of correlation between each pair of DF paralogs in the spectral counts and AvgP for each DF high-confidence interactor. These interactors are enriched in proteins related to mRNA degradation pathways (shown in red). Proteins with a function in mRNA translation, including EIF3A and EIF3B, have a low AvgP and thus are considered low-confidence or non-specific interactors. (C) DFs are predicted to have similar subcellular localization. Shown is the "Non-negative matrixfactorization" probability assigned to each DF paralog in each subcellular compartment calculated based on the protein-protein interaction network (see STAR Methods). Each DF paralog shows a similar probability of being classified as a P-body protein and high probability of being enriched in RNP granules or stress granules. (D) Structured illumination microscopy (SIM) images indicate that the DF paralogs (red) arelocalized to small punctate structures (<150 nm) throughout the cytoplasm and P-bodies (150–200 nm) based on colocalization with EDC4 (green).
Fig. 3
Fig. 3. DF proteins redundantly control the abundance and stability of m6A-modified mRNAs
(A-D) m6A-modified mRNAs show substantially higher increase in expression upon simultaneous silencing of DF1, DF2, and DF3 in HeLa cells. The abundance of each mRNA (based on RNA-seq counts) was compared between the control and the conditions of DF paralog(s) silencing, as indicated. mRNAs were binned based on the number of m6A sites. The expression distribution of each of m6A mRNA subgroup is quantified in the boxplots. The center of each box represents the median fold change (log2), the boundaries contain genes within a quartile of the median, whiskers represent 1.5 ×ばつ interquartile ranges. The width of the boxplot is proportional to the number of genes in each category. m6A mRNAs do not change in expression upon silencing of DF1 or DF3 compared to non-methylated mRNAs. However, m6A mRNAs show a small increase in their expression upon silencing of DF2. m6A-modified mRNAs show substantially higher increase in expression upon simultaneous silencing of DF1, DF2, and DF3. Only significant p-values are shown in each graph, two-tailed Mann–Whitney test. n=3 replicates. n=2425 mRNAs for 0, n=894 mRNAs for 1, n=1521 mRNAs for 2–4, n=2022 mRNAs for 5+ m6A sites. (E) Quantification of results in A-D. The fold increase in mRNA expression was quantified for each indicated knockdown condition. Only mRNAs with 5 or more annotated m6A sites were used in this analysis and were compared to mRNAs with 0 annotated m6A sites. Although no effect on m6A mRNA expression is seen with depletion of DF1 or DF3, a small increase is seen when these two are knocked down together. Triple knockdown shows a significantly larger effect compared to knockdown of each DF paralog alone. ****p ≤ 2.2e-16, **p ≤ 0.001, two-tailed Mann–Whitney test. (F) m6A mRNA stability is increased upon depletion of DF paralogs. The stability of m6A-modified mRNAs and non-methylated mRNAs was determined by quantifying mRNA levels before and 2 h after actinomycin D treatment. Shown is the fold change in the mRNA levels, used as measure of the stability change upon the silencing of the DF paralog(s) (see STAR Methods). The increase in mRNA stability is most apparent when all three DF paralogs were knocked down and is proportional to the number of m6A sites per mRNA. n=456 mRNAs for 0, n=96 mRNAs for 1 to 5, n=140 mRNAs for more than 5 annotated m6A sites. ***p = 2.079e-6, **p ≤ 0.01, *p ≤ 0.02, two-tailed Mann–Whitney test, n=2 replicates.
Fig. 4
Fig. 4. Depletion of DF proteins does not affect the translation efficiency of m6A mRNAs in HeLa cells
(A) DF paralogs are not highly associated with actively translated mRNAs. DF1, DF2, and DF3 were not enriched in polysomal fractions. Instead, they were predominantly associated with the mRNA ribonucleoprotein complex fraction (mRNPs). The ribosomal protein RPS6 was used as a marker for ribosome-enriched fractions. (B-E) The translation efficiency of m6A-modified mRNAs is not reduced upon silencing of DF1 or any DF paralog. The number of ribosome-protected fragments bound to each mRNA was normalized to the abundance of the respective mRNA to calculate translation efficiency (TE). The TE was then compared between control and cells knocked down for the indicated DF paralog(s). mRNAs were binned based on the number of m6A sites. The distribution of each of m6A mRNA subgroups is quantified in the boxplots. The center of each box represents the median fold change (log2), the boundaries contain genes within a quartile of the median, whiskers represent 1.5 ×ばつ interquartile ranges. The width of the boxplot is proportional to the number of genes in each category. m6A-modified mRNAs do not decrease their TE upon either single or triple silencing of DF1, DF2, DF3 compared to non-methylated mRNAs. Only significant p-values are shown in each graph and the exact p-values are reported (two-tailed Mann–Whitney test). n=3 replicates. n=2425 mRNAs for 0, n=894 mRNAs for 1, n=1521 mRNAs for 2–4, n=2022 mRNAs for 5+ m6A sites.
Fig. 5
Fig. 5. DF proteins redundantly contribute to suppressing the differentiation of leukemia cells
(A) TNFRSF1B mRNA expression is increased upon depletion of all DF paralogs. TNFRSF1B mRNA levels were measured by qRT-PCR in MOLM-13 cells after knockdown of each paralog. DF2 silencing lead to increased levels of TNFRSF1B, consistent with previous results (Paris et al., 2019). However, a larger and statistically significant increase in its expression level was seen upon silencing all three DF paralogs, suggesting that the combined activity of the DF paralogs mediates the destabilization of TNFRSF1B. TNFRSF1B levels were normalized to RPS28 expression levels, a non-methylated mRNA (Vu et al., 2017). Non-parametric ANOVA test, ****p ≤ 0.0001, n=3 mean± SEM. (B) Expression of the CD14 differentiation marker in MOLM-13 cells is strongly induced bysilencing all three DF paralogs. Shown is the percentage of CD14+ cells after the silencing of the indicated DF paralog(s). For each DF paralog, two different shRNAs were tested in two biological replicates, with the two different shRNAs indicated as closed circle and an open circle. As previously described (Paris et al., 2019), DF2 silencing alone fails to cause an increase in CD14+. However, upon triple knockdown, the percentage of CD14+ cells is significantly increased. Non-parametric ANOVA test, ****p < 0.0001, ***p = 0.0010, **p = 0.0012, *p = 0.03.

References

    1. Alberti S, Gladfelter A, and Mittag T (2019). Considerations and Challenges in Studying Liquid-Liquid Phase Separation and Biomolecular Condensates. Cell 176, 419–434. - PMC - PubMed
    1. Anders M, Chelysheva I, Goebel I, Trenkner T, Zhou J, Mao Y, Verzini S, Qian S-B, and Ignatova Z (2018). Dynamic m6A methylation facilitates mRNA triaging to stress granules. Life Science Alliance 1, e201800113. - PMC - PubMed
    1. Arava Y, Wang Y, Storey JD, Liu CL, Brown PO, and Herschlag D (2003). Genome-wide analysis of mRNA translation profiles in Saccharomyces cerevisiae. Proc Natl Acad Sci USA 100, 3889–3894. - PMC - PubMed
    1. Arguello AE, Leach RW, and Kleiner RE (2019). In Vitro Selection with a Site-Specifically Modified RNA Library Reveals the Binding Preferences of N6-Methyladenosine Reader Proteins. Biochemistry 58, 3386–3395. - PMC - PubMed
    1. Bailey TL, Boden M, Buske FA, Frith M, Grant CE, Clementi L, Ren J, Li WW, and Noble WS (2009). MEME SUITE: tools for motif discovery and searching. Nucleic Acids Research 37, W202–W208. - PMC - PubMed

Publication types

Cite

AltStyle によって変換されたページ (->オリジナル) /