Geographic shifts in the bioclimatic suitability for Aedes aegypti under climate change scenarios in Colombia
- PMID: 31909268
- PMCID: PMC6940634
- DOI: 10.1016/j.heliyon.2019.e03101
Geographic shifts in the bioclimatic suitability for Aedes aegypti under climate change scenarios in Colombia
Erratum in
-
Corrigendum to "Geographic shifts in the bioclimatic suitability for Aedes aegypti under climate change scenarios in Colombia" [Heliyon Volume 6, Issue 1, January 2020, e03101].Cabrera CVP, Selvaraj JJ. Cabrera CVP, et al. Heliyon. 2020 Jan 24;6(1):e03203. doi: 10.1016/j.heliyon.2020.e03203. eCollection 2020 Jan. Heliyon. 2020. PMID: 32021924 Free PMC article.
Abstract
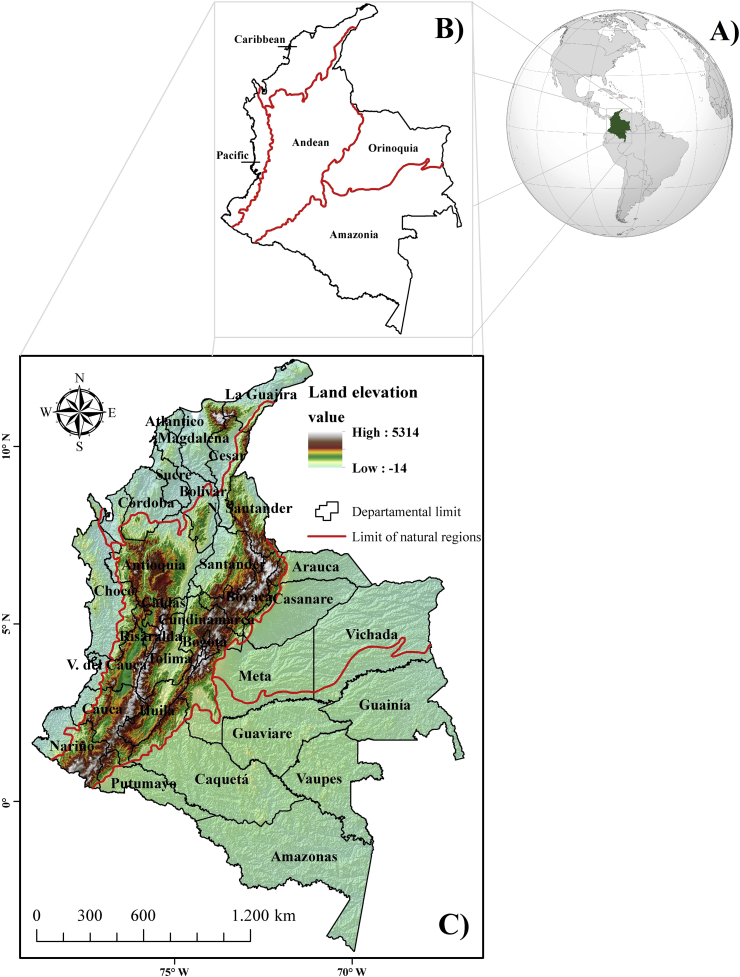
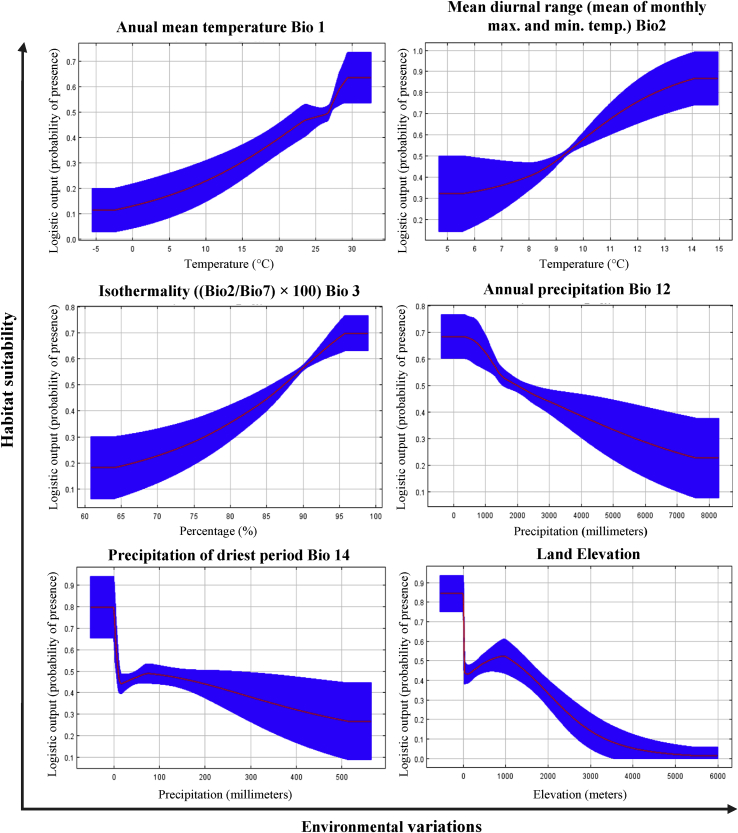
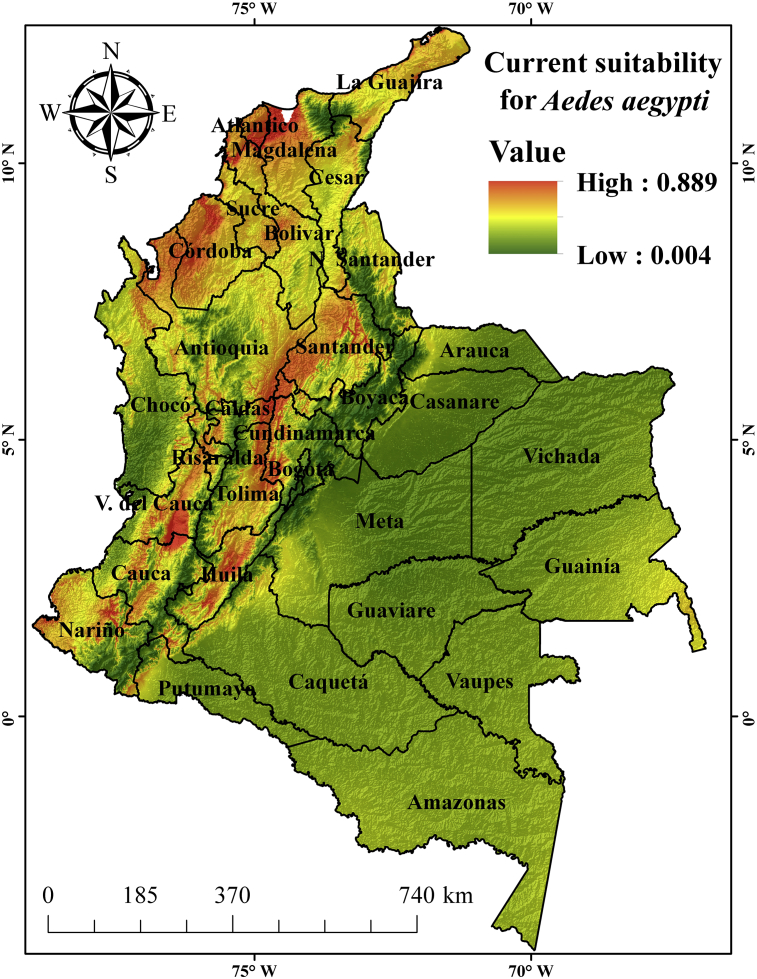
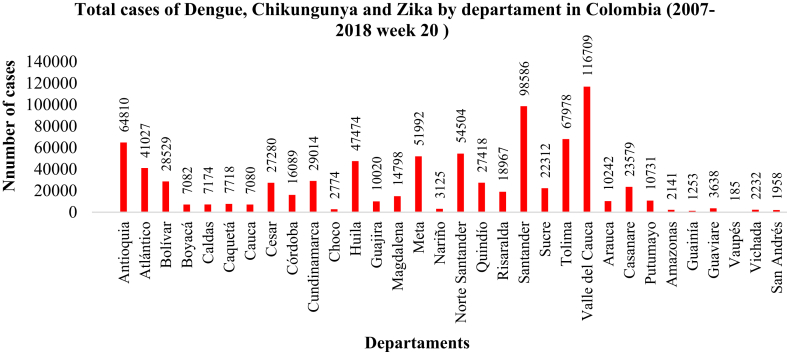
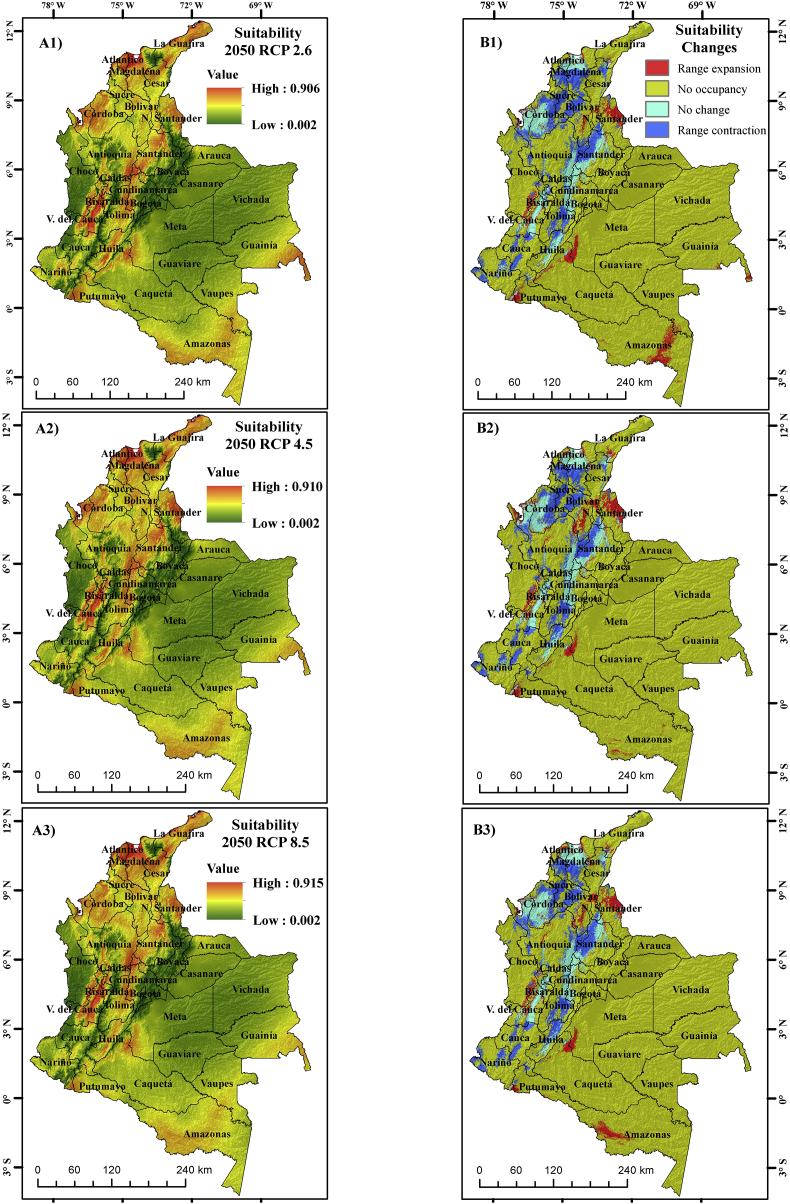
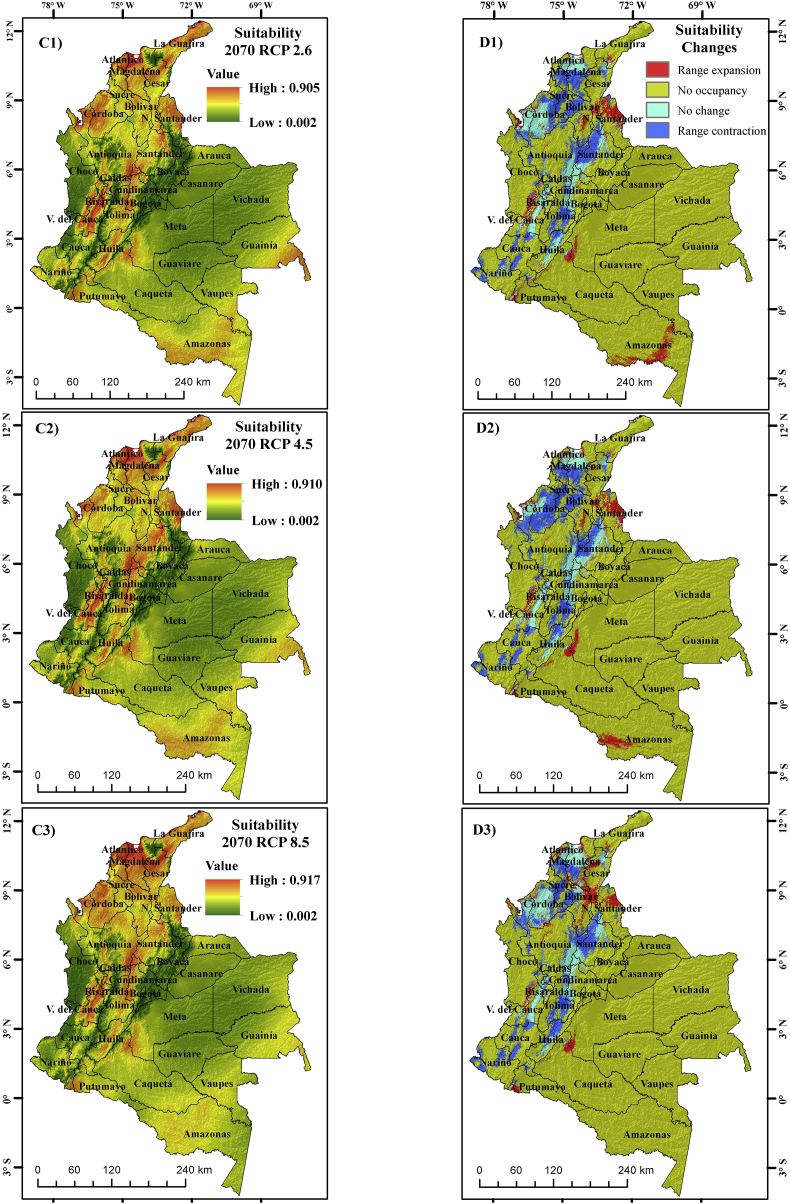
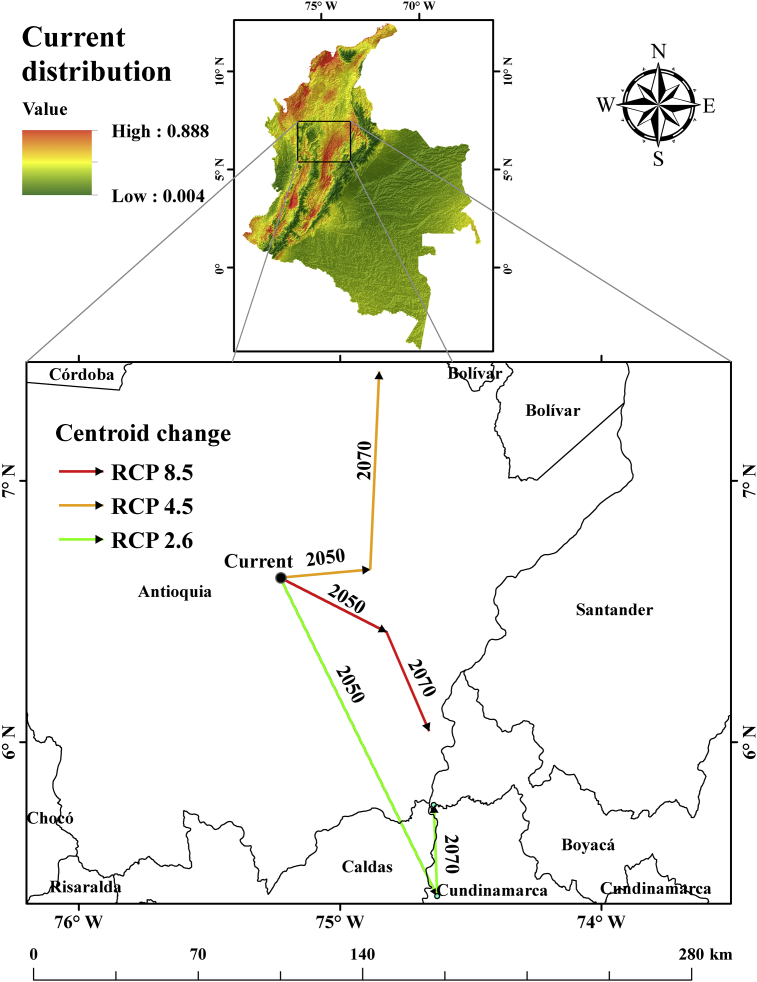
The Dengue, Chikungunya and Zika viruses are arboviruses predominantly transmitted to humans through the bite of the female mosquito Aedes aegypti. Currently, the vector represents a potential epidemiological risk in several Latin American and Pacific countries. However, little is known about the geographical distribution and bioclimatic suitability of this mosquito in the projected climate change scenarios in Colombia. Using a species distribution model of maximum entropy (MaxEnt) based on presence-only records obtained from Global Biodiversity Information Facility (GBIF), land elevation obtained from Shuttle Radar Topography Mission (SRTM) and bioclimatic variables (WorldClim), we produced environmental suitability maps of this mosquito vector for present and future geographic distribution. The future distribution were constructed based on the Community Climate System Model (CCSM4) for the years 2050 and 2070, projected according to the Representative Concentration Pathways (RCP) 2.6, 4.5 and 8.5 described by the Intergovernmental Panel on Climate Change (IPCC). For the current conditions, Colombia has ~140,612.8 square km of areas with the possible presence of the vector; however, for the future, this will be reduced by more than 30%. For the future conditions, the suitable areas for A. aegypti decreased compared to the present, mainly for the year 2070 under RCP scenarios 4.5 and 8.5, however, the probability of mosquito occurrence increases in some departments of Colombia. Areas susceptible to the presence of A. aegypti are affected by climate change. The Caribbean and Andean regions have a high probability of mosquito distribution; therefore, control and epidemiological surveillance are required in these areas. The results can serve as an input to define preventive and control measures, especially in areas with a higher risk of contracting the virus.
Keywords: Aedes aegypti; Climate change; Colombia; Environmental change; Environmental suitability; Geographical distribution; Mathematical modeling; MaxEnt; Public health; Viral vector.
© 2019 The Author(s).
Figures
References
-
- Alaniz A.J., Bacigalupo A., Cattan P.E. Spatial quantification of the world population potentially exposed to Zika virus. Int. J. Epidemiol. 2017;46:966–975. - PubMed
-
- Anderson R.P. A framework for using niche models to estimate impacts of climate change on species distributions. Ann. N. Y. Acad. Sci. 2013;1297:8–28. - PubMed
-
- Anderson R.P., Gonzalez I. Species-specific tuning increases robustness to sampling bias in models of species distributions: an implementation with Maxent. Ecol. Model. 2011;222:2796–2811.
-
- Anderson R.P., Raza A. The effect of the extent of the study region on GIS models of species geographic distributions and estimates of niche evolution: preliminary tests with montane rodents (genus Nephelomys) in Venezuela. J. Biogeogr. 2010;37:1378–1393.
-
- Andriamifidy R.F., Tjaden N.B., Beierkuhnlein C., Thomas S.M. Do we know how mosquito disease vectors will respond to climate change? Emerg. Top. Life Sci. 2019;3 115 LP-132. - PubMed
LinkOut - more resources
Full Text Sources