This site needs JavaScript to work properly. Please enable it to take advantage of the complete set of features!
Skip to main page content
U.S. flag

An official website of the United States government

Dot gov

The .gov means it’s official.
Federal government websites often end in .gov or .mil. Before sharing sensitive information, make sure you’re on a federal government site.

Https

The site is secure.
The https:// ensures that you are connecting to the official website and that any information you provide is encrypted and transmitted securely.

NIH NLM Logo
Log in
Access keys NCBI Homepage MyNCBI Homepage Main Content Main Navigation
. 2019 Oct 29;19(1):920.
doi: 10.1186/s12879-019-4467-4.

Mass campaigns combining antimalarial drugs and anti-infective vaccines as seasonal interventions for malaria control, elimination and prevention of resurgence: a modelling study

Affiliations

Mass campaigns combining antimalarial drugs and anti-infective vaccines as seasonal interventions for malaria control, elimination and prevention of resurgence: a modelling study

Flavia Camponovo et al. BMC Infect Dis. .

Abstract

Background: The only licensed malaria vaccine, RTS,S/AS01, has been developed for morbidity-control in young children. The potential impact on transmission of deploying such anti-infective vaccines to wider age ranges, possibly with co-administration of antimalarial treatment, is unknown. Combinations of existing malaria interventions is becoming increasingly important as evidence mounts that progress on reducing malaria incidence is stalling and threatened by resistance.

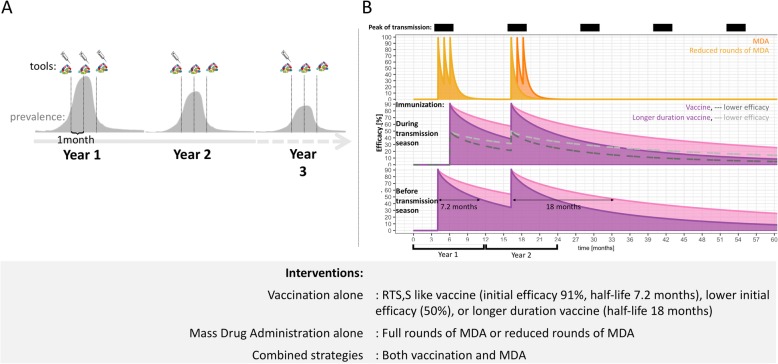
Methods: Malaria transmission and intervention dynamics were simulated using OpenMalaria, an individual-based simulation model of malaria transmission, by considering a seasonal transmission setting and by varying epidemiological and setting parameters such as transmission intensity, case management, intervention types and intervention coverages. Chemopreventive drugs and anti-infective vaccine efficacy profiles were based on previous studies in which model parameters were fitted to clinical trial data. These intervention properties were used to evaluate the potential of seasonal mass applications of preventative anti-infective malaria vaccines, alone or in combination with chemoprevention, to reduce malaria transmission, prevent resurgence, and/or reach transmission interruption.

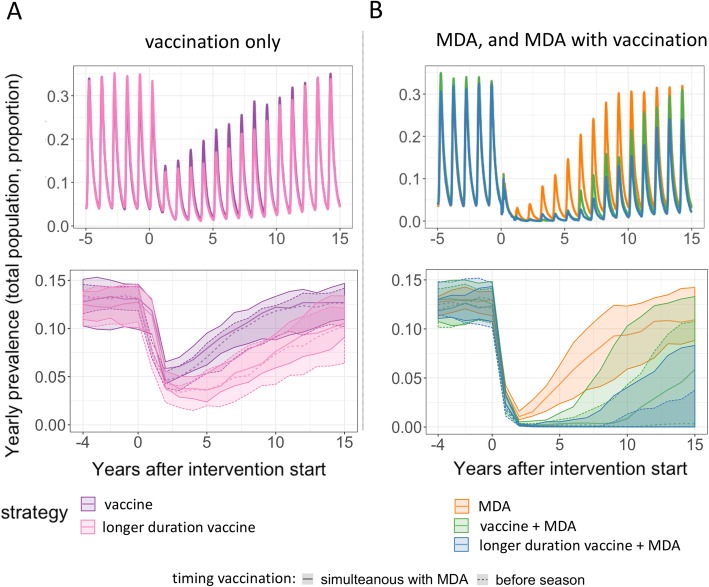
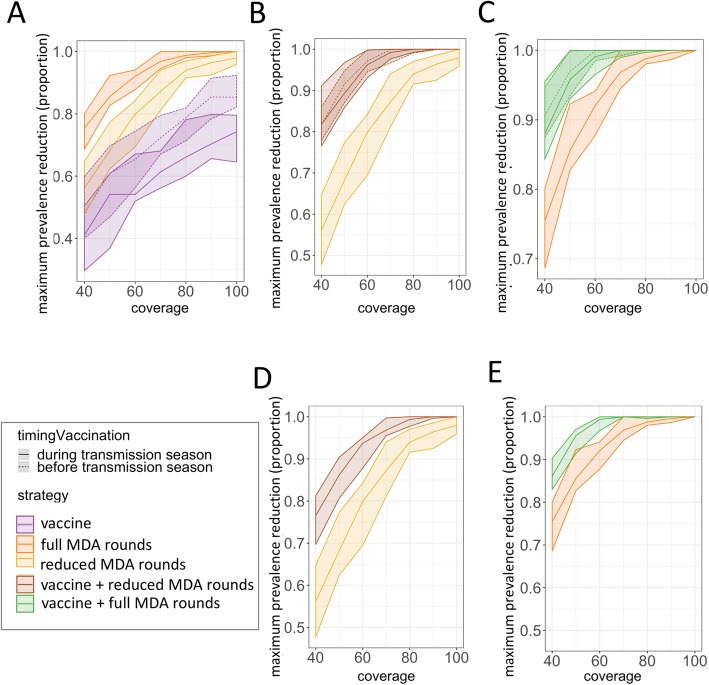
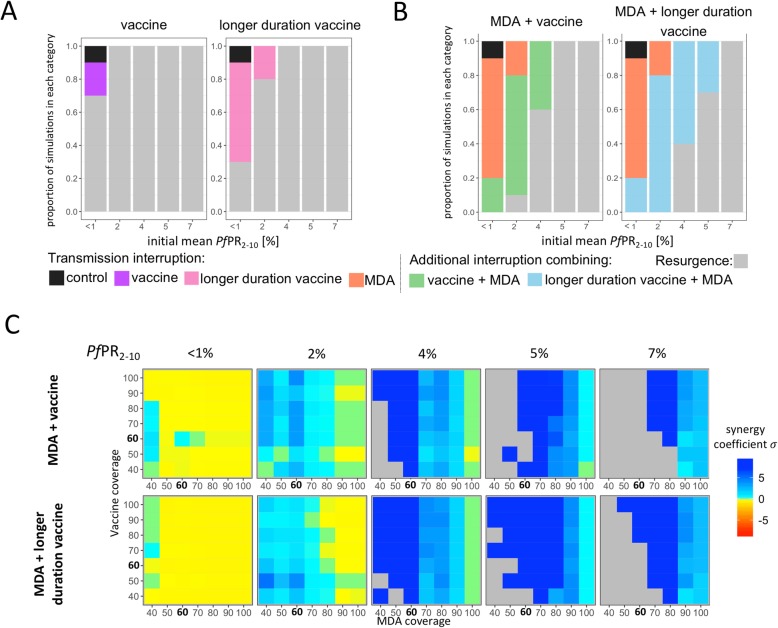
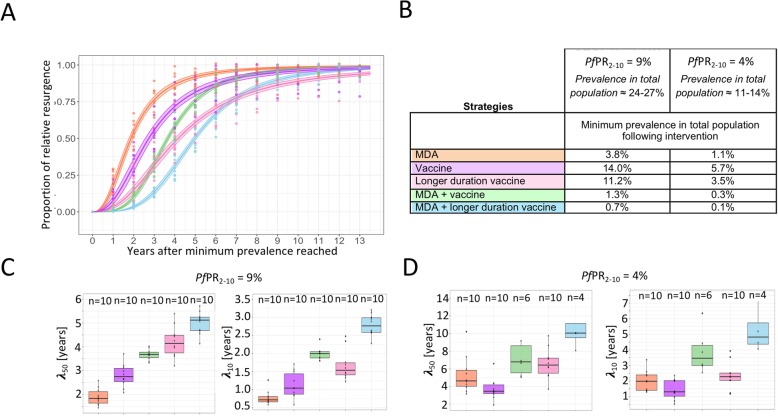
Results: Deploying a vaccine to all ages on its own is a less effective intervention strategy compared to chemoprevention alone. However, vaccines combined with drugs are likely to achieve dramatic prevalence reductions and in few settings, transmission interruption. The combined mass intervention will result in lower prevalence following the intervention compared to chemoprevention alone and will increase chances of interruption of transmission resulting from a synergistic effect between both interventions. The combination of vaccine and drug increases the time before transmission resurges after mass interventions cease compared to mass treatment alone. Deploying vaccines and drugs together requires fewer rounds of mass intervention and fewer years of intervention to achieve the same public health impact as chemoprevention alone.

Conclusions: Through simulations we identified a previously unidentified value of deploying vaccines with drugs, namely the greatest benefit will be in preventing and delaying transmission resurgence for longer periods than with other human targeted interventions. This is suggesting a potential role for deploying vaccines alongside drugs in transmission foci as part of surveillance-response strategies.

Keywords: Malaria; Mass intervention; Resurgence; Seasonal transmission; Simulation; Vaccine.


Conflict of interest statement

CFO and CL are part of the PATH’s Malaria Vaccine Initiative.

Figures

Fig. 1
Fig. 1
Main simulated strategies and drug and vaccine efficacy profiles. a Illustrated strategies: MDA alone, vaccine alone, or MDA with vaccine. MDA application alone is 3 rounds coinciding with the pattern of seasonal transmission, with 2–3 years of 3 rounds or 3 rounds for only the first year followed by 1–2 years of 1 round at the beginning of the transmission season; RTS,S-like-duration vaccine or longer duration vaccine application alone is 3 rounds coinciding with the pattern of seasonal transmission with 1–2 years of 1 dose at the beginning of the season or as 3 rounds before the pattern of seasonal transmission, with 1–2 years of 1 dose at the beginning of the season; and strategies combining MDA with RTS,S-like-duration vaccine or longer duration vaccine are a combination of all MDA and vaccine implementations combined together. b Efficacy against infection profiles of 2 years of intervention with MDA, RTS,S like vaccine, vaccine with longer duration of protection, and vaccine with lower initial efficacy. x-axis represents the time in months, and efficacy against infection is indicated on the y-axis for MDA given at 1 months interval during 3 months the first year and 1 (yellow) or 3 (orange) rounds the second year, and for mass vaccination with a RTS,S like vaccine (purple), a longer duration protection vaccine (pink), or vaccines with lower initial efficacy against infection (dashed lines). Mass vaccination is delivered either before the peak of transmission the first year (bottom plot) or during the transmission season (middle plot). The first year 3 doses of vaccination are administered, but only the 3rd dose of vaccination is modeled, and the second year only one dose is administered. Initial efficacy against infection for both vaccines are 91% or 50% and the half-life, which is the time in which protection against infection has decayed to half the value of the initial level, is 7.3 months for the RTS,S like vaccine and 18 months for the vaccine with extended duration of protection, indicated with arrows on the diagram. Period of peak transmission are indicated by black boxes
Fig. 2
Fig. 2
Example time course of predicted all age prevalence following intervention. Single simulation examples (chosen at random) of estimated continuous (upper plots) and median and range of estimated yearly average (lower plots) all age prevalence following different intervention strategies deployed during 2 years. a estimated all age prevalence following mass vaccination (purple) or mass vaccination with longer duration vaccine (pink), b estimated all age prevalence following full rounds of MDA alone (orange) or in combination with mass vaccination (green) or mass vaccination with longer duration vaccine (blue). Intervention coverage of 60% was assumed, with an initial yearly average PfPR2–10 = 4% with peak PfPR2–10 ≈ 10–15% (corresponding to an initial EIR of 2 and effective access to care E14 = 45%). Full description of the different strategies can be found in Additional file 1: Table S2
Fig. 3
Fig. 3
Relative maximum prevalence reduction achieved immediately following 2 years of intervention for different intervention coverages. Estimated maximum prevalence reduction achieved (proportion, where 0 indicates no prevalence reduction and 1 interruption of transmission) for coverage levels 40–100% (x-axis) by a single interventions, b-d combined interventions with drugs and vaccination given independently, and d-e combined interventions with drugs and vaccination given to the same population when administered simultaneously. a Compares MDA or mass vaccination alone: mass vaccination (purple) before (dashed lines) or during (solid lines) transmission season and full rounds of MDA (orange) or reduced rounds of MDA (yellow); b and d Compare reduced rounds of MDA (yellow) with combined strategies of mass vaccination before (dashed lines) or during (solid lines) the transmission season together with full rounds of MDA (brown); and c and e Compare reduced rounds of MDA (orange) with combined strategies of mass vaccination before (dashed lines) or during (solid lines) the transmission season together with full rounds of MDA (green). Each intervention is represented by the median and minimum-maximum range across 10 simulations per a strategy. Initial average PfPR2–10 = 4% with peak PfPR2–10 ≈ 10–15% (corresponding to an initial EIR = 2 and effective access to care E14 = 45%)
Fig. 4
Fig. 4
Interruption of transmission and synergism for different intervention strategies. a-b Proportion of simulations in which interruption of transmission is estimated to be achieved with mass vaccination (a) or MDA combined with mass vaccination compared to MDA only (b). Initial PfPR2–10 (%) levels are shown on the x-axis, and proportion of the simulations falling into each category are shown on the y-axis. All interventions were deployed for 2 years at a coverage of 60%. Categories of simulations are i) interruption of transmission occurred with no intervention at all, due to very low initial prevalence (black), ii) interruption of transmission occurred with single interventions, namely with mass vaccination with RTS,S like vaccine (purple) or longer duration vaccine (pink), or with MDA (orange), iii) interruption of transmission occurred only adding mass vaccination to MDA (green and blue using with RTS,S like vaccine or longer duration vaccine respectively), and iv) resurgence occurred and no interruption of transmission was achieved (grey).c Estimated synergy coefficient (σ) of the combined mass vaccination and MDA intervention in regards probability to interrupt transmission. The x-axis indicates coverage levels of MDA, and the y-axis coverage levels of mass vaccination, and the level of synergy between the two intervention strategies are indicated in colour. Blue represents synergistic behavior (> 0) in the combined MDA and mass vaccination, light green represents values of 0 which imply the combined interventions are not more than additive, and yellow to red colours represent values less than 0 which imply less than additive or maximum level was reached by one or both single interventions. Grey areas represent settings where resurgence occurred in all simulation, thus no synergy could be calculated. The synergy coefficient are shown for the combination of MDA with RTS,S like vaccine (upper row) and MDA with the longer duration vaccine (bottom row), and for different levels of initial PfPR2–10 (%) (columns)
Fig. 5
Fig. 5
Resurgence following 2 years of deployment of different interventions at PfPR2–10 = 4 and 9%. a Predicted relative resurgence at initial PfPR2–10 = 9% (EIR = 2 and E14 = 45%) with 95% confidence intervals estimated from fitting a 4-parameter logistic regression to the pooled simulations for strategy MDA alone (orange), mass vaccination alone (purple), mass vaccination with a longer duration vaccine (pink), MDA combined with mass vaccination (green) and MDA combined with a longer duration vaccine (blue). b The average minimum prevalence in the total population reached directly following each intervention. c-d Summarized parameters describing resurgence (boxplots with median and 95% confidence intervals) estimated from the logistic regressions to each simulations for each strategy are the estimated half-life or time till 50% resurgence, λ50, representing the years after maximum prevalence reduction was reached in which prevalence resurges by 50% of the reduction and the time till 10% resurgence, λ10, representing the years after maximum prevalence reduction was reached where prevalence resurges 10% of the reduction. The estimates are shown for initial PfPR2–10 = 9% in c and for initial PfPR2–10 = 4% in d. The corresponding number of simulations with resurgence per strategy and setting are indicated at the top of each summary boxplot

References

    1. World Health Organization (WHO). Global technical strategy for malaria 2016–2030. WHO Geneva. 2015. 1–35 p.
    1. Bhatt S, Weiss DJ, Cameron E, Bisanzio D, Mappin B, Dalrymple U, et al. The effect of malaria control on Plasmodium falciparum in Africa between 2000 and. Nature. 2015;2015:1–9. - PMC - PubMed
    1. World Health Organization (WHO). World Malaria Report. 2017:2017.
    1. Greenwood BM. Control to elimination: implications for malaria research. Trends Parasitol. 2008;24(10):449–454. doi: 10.1016/j.pt.200807002. - DOI - PubMed
    1. European Medicines Agency First malaria vaccine receives positive scientific opinion from EMA. Press Release. 2015;44(July):1–3.

MeSH terms

LinkOut - more resources

Cite

AltStyle によって変換されたページ (->オリジナル) /