Peripartum Outcomes Before and After Hurricane Harvey
- PMID: 31599849
- PMCID: PMC6814565
- DOI: 10.1097/AOG.0000000000003522
Peripartum Outcomes Before and After Hurricane Harvey
Abstract
Objective: To evaluate the association between Hurricane Harvey landfall with maternal and neonatal morbidity.
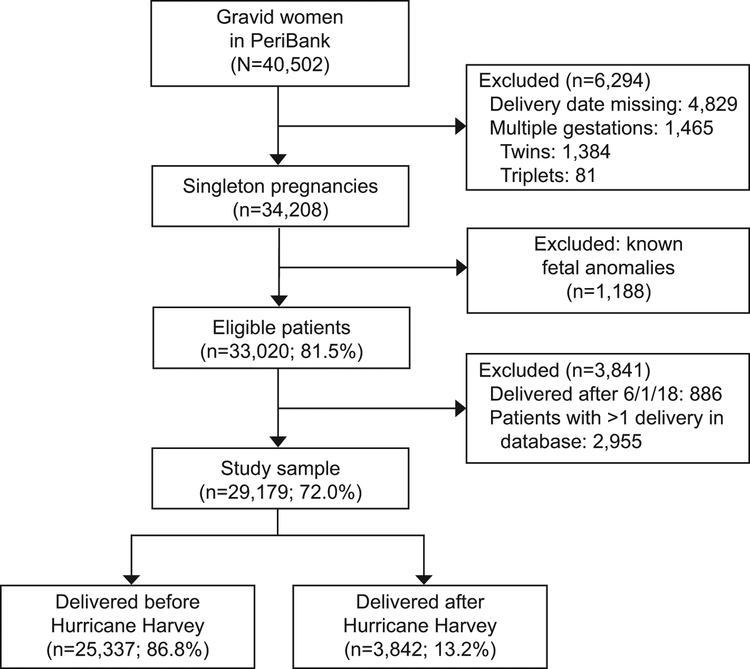
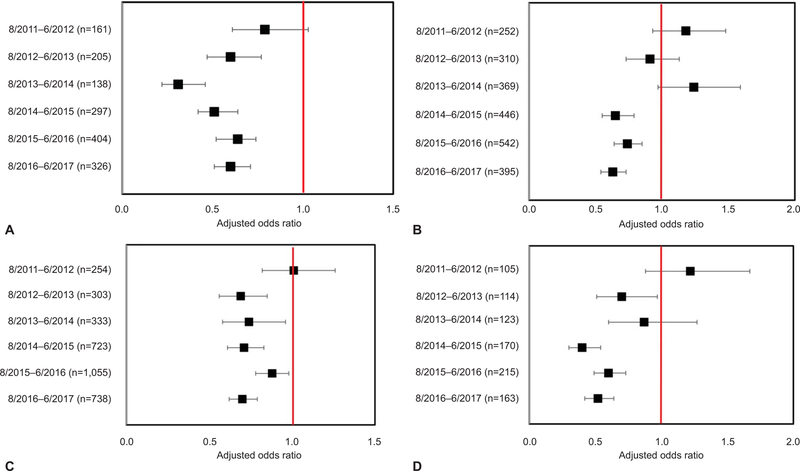
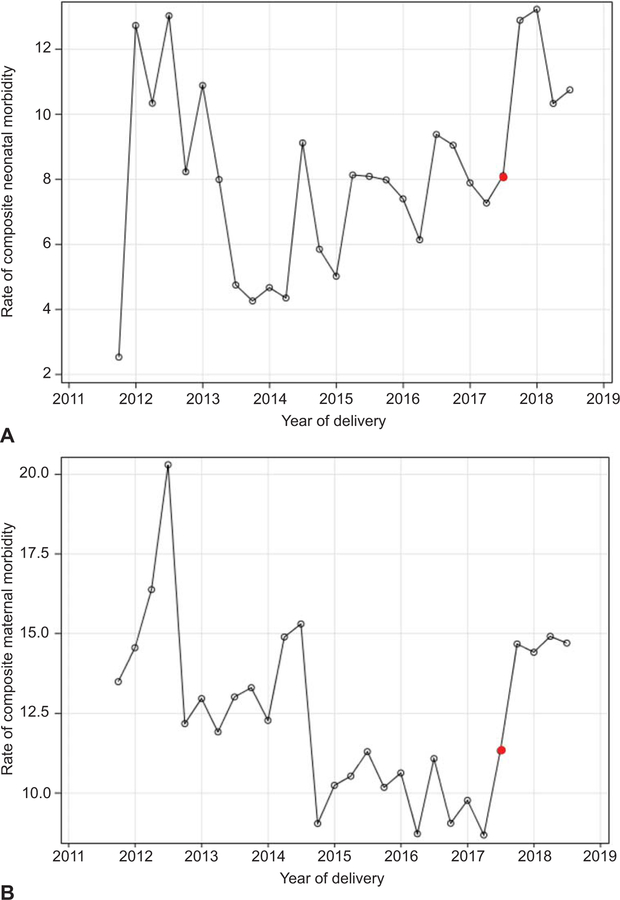
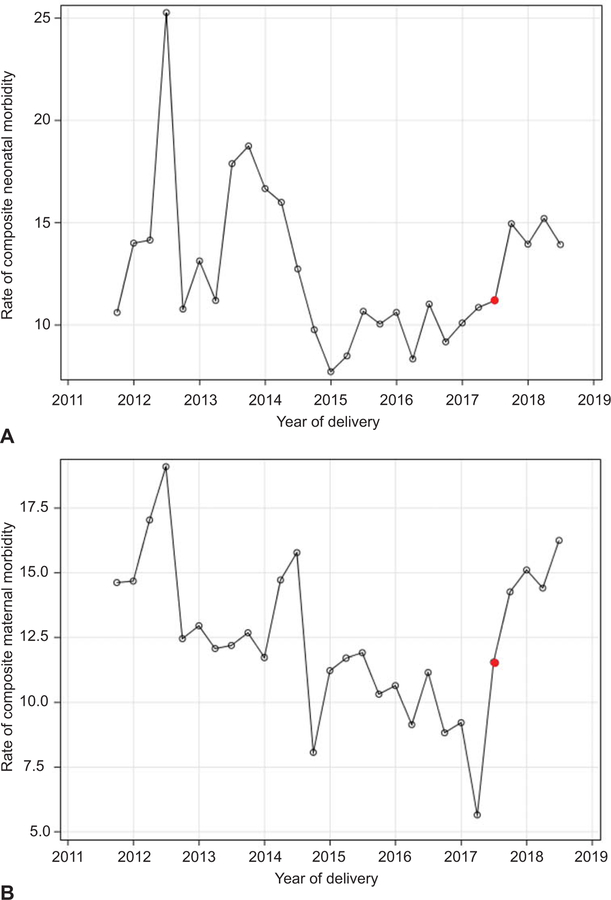
Methods: Using an institutional perinatal database from two hospitals in Houston, Texas, women with nonanomalous singletons delivering after 24 weeks of gestation between August 2011 and June 2018 were included. To evaluate the possible association of hurricane landfall with pregnancy outcomes, gravid women delivering within 280 days (40 weeks of gestation) on or after August 25, 2017 (the day of hurricane landfall) were categorized as exposed, and women who delivered before August 25, 2017, were the reference group. Composite maternal morbidity included any of the following: hypertensive disorders of pregnancy, chorioamnionitis, endometritis, blood transfusion, peripartum hysterectomy, maternal critical care admission, pulmonary edema, or maternal death. Composite neonatal morbidity included any of the following: 5-minute Apgar score 3 or less, respiratory distress syndrome, use of ventilator or continuous positive airway pressure, suspected newborn sepsis, seizure, stillbirth, or neonatal death. Adjusted odds ratios (aORs) were calculated after correcting for possible confounders identified on univariate analysis. Disruption in outcome trends were measured in time series analyses.
Results: Of 40,502 deliveries in our database, 29,179 (72%) met the inclusion criteria, with 3,842 (13.2%) delivering within 280 days of Hurricane Harvey landfall. Women delivering after Hurricane Harvey were on average less likely to be obese and more likely to be older, Caucasian, married, have a household income higher than 75,000,ドル a high school education, and private insurance. However, compared with the cohort of gravid patients who delivered before Hurricane Harvey, composite maternal morbidity increased by 27% (11.5% vs 14.7%, aOR 1.27, 95% CI 1.14-1.42) after the storm. Composite neonatal morbidity increased by 50% (7.8% vs 11.9%, aOR 1.52, 95% CI 1.34-1.71). In time series analyses, we observed a significant shift in composite maternal morbidity specific to women of low socioeconomic status (estimate 2.87, P=.028).
Conclusion: Despite having fewer at-risk baseline characteristics, gravid patients delivering after landfall by Hurricane Harvey had a significantly higher likelihood of adverse outcomes as did their neonates.
Conflict of interest statement
Financial Disclosure
The authors did not report any potential conflicts of interest.
Figures
References
-
- Historic Disaster Response to Hurricane Harvey in Texas. FEMA September 22, 2017. (Accessed Nov-9, 2018, at https://www.fema.gov/news-release/2017/09/22/historic-disaster-response-....)
-
- Service Assessment - August–September 2017 Hurricane Harvey. U.S. DEPARTMENT OF COMMERCE June 2018. (Accessed Nov-9, 2018, at https://www.weather.gov/media/publications/assessments/harvey6-18.pdf.)
-
- Texas Hurricane Harvey (DR-4332). FEMA September 2017. (Accessed Nov-9, 2018, at https://www.fema.gov/disaster/4332.)
Publication types
MeSH terms
Grants and funding
LinkOut - more resources
Full Text Sources
Medical
Miscellaneous