This site needs JavaScript to work properly. Please enable it to take advantage of the complete set of features!
Skip to main page content
U.S. flag

An official website of the United States government

Dot gov

The .gov means it’s official.
Federal government websites often end in .gov or .mil. Before sharing sensitive information, make sure you’re on a federal government site.

Https

The site is secure.
The https:// ensures that you are connecting to the official website and that any information you provide is encrypted and transmitted securely.

NIH NLM Logo
Log in
Access keys NCBI Homepage MyNCBI Homepage Main Content Main Navigation
. 2019 Oct 9;286(1912):20191867.
doi: 10.1098/rspb.2019.1867. Epub 2019 Oct 9.

Space-time dynamics of a triple epidemic: dengue, chikungunya and Zika clusters in the city of Rio de Janeiro

Affiliations

Space-time dynamics of a triple epidemic: dengue, chikungunya and Zika clusters in the city of Rio de Janeiro

Laís Picinini Freitas et al. Proc Biol Sci. .

Abstract

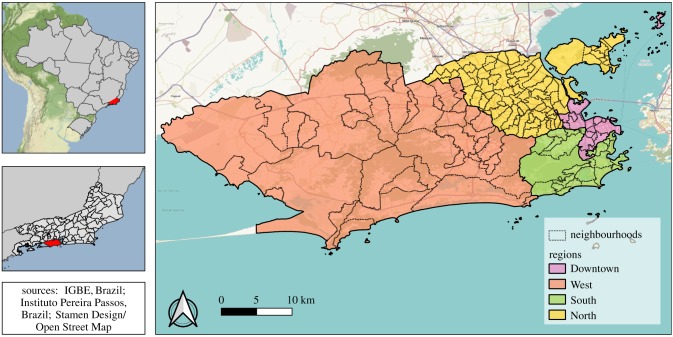
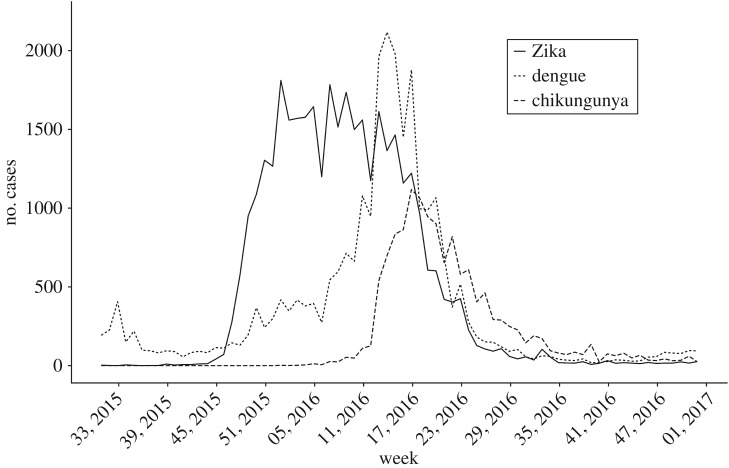
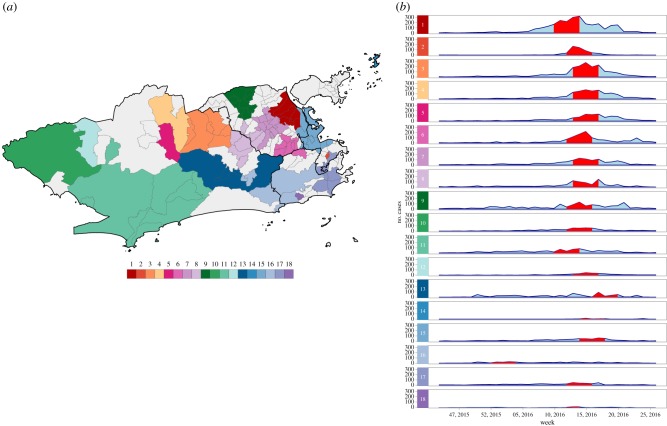
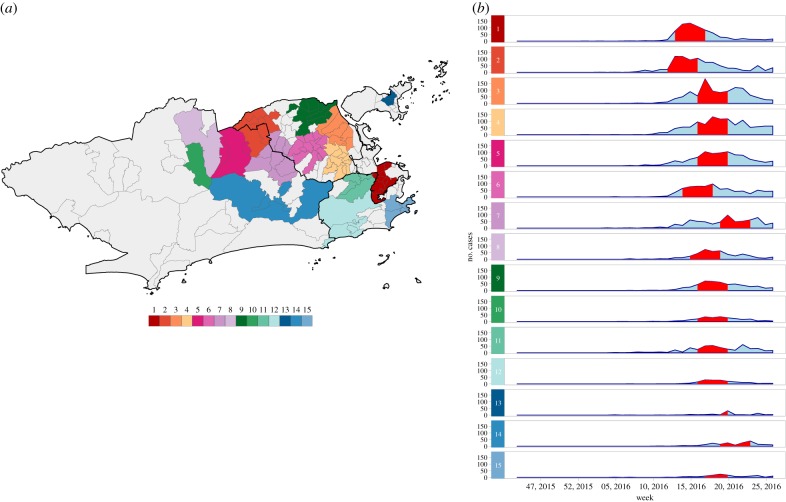
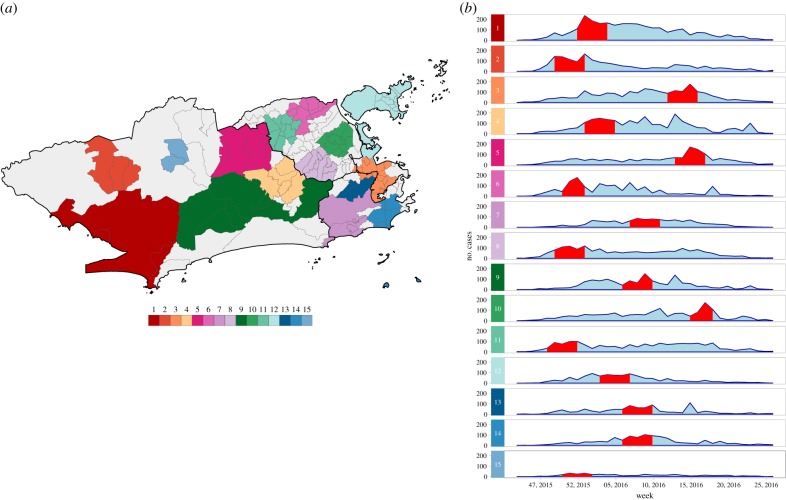
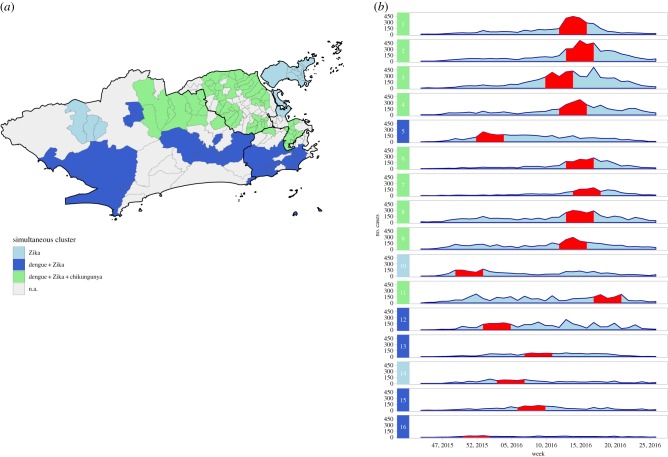
Dengue, an arboviral disease transmitted by Aedes mosquitoes, has been endemic in Brazil for decades. However, vector-control strategies have not led to a significant reduction in the disease burden and have not been sufficient to prevent chikungunya and Zika entry and establishment in the country. In Rio de Janeiro city, the first Zika and chikungunya epidemics were detected between 2015 and 2016, coinciding with a dengue epidemic. Understanding the behaviour of these diseases in a triple epidemic scenario is a necessary step for devising better interventions for prevention and outbreak response. We applied scan statistics analysis to detect spatio-temporal clustering for each disease separately and for all three simultaneously. In general, clusters were not detected in the same locations and time periods, possibly owing to competition between viruses for host resources, depletion of susceptible population, different introduction times and change in behaviour of the human population (e.g. intensified vector-control activities in response to increasing cases of a particular arbovirus). Simultaneous clusters of the three diseases usually included neighbourhoods with high population density and low socioeconomic status, particularly in the North region of the city. The use of space-time cluster detection can guide intensive interventions to high-risk locations in a timely manner, to improve clinical diagnosis and management, and pinpoint vector-control measures.

Keywords: Zika; chikungunya; cluster analysis; dengue; spatio-temporal analysis.


Conflict of interest statement

We declare we have no competing interests.

Figures

Figure 1.
Figure 1.
Rio de Janeiro city regions and neighbourhoods, 2010.
Figure 2.
Figure 2.
Number of reported dengue (dotted line), chikungunya (dashed line) and Zika (solid line) cases between 2 August 2015 and 31 December 2016, Rio de Janeiro city, Brazil.
Figure 3.
Figure 3.
(a) Dengue cases clusters and (b) temporal distribution of dengue cases by cluster, between epidemiological weeks 31, 2015 and 52, 2016, Rio de Janeiro city, Brazil. Red bands represent the time period at which the cluster was detected. Clusters are ordered according to the maximum LLR, with 1 being the most likely cluster.
Figure 4.
Figure 4.
(a) Chikungunya cases clusters and (b) temporal distribution of chikungunya cases by cluster, between epidemiological weeks 31, 2015 and 52, 2016, Rio de Janeiro city, Brazil. Red bands represent the time period at which the cluster was detected. Clusters are ordered according to the maximum LLR, with 1 being the most likely cluster.
Figure 5.
Figure 5.
(a) Zika cases clusters and (b) temporal distribution of Zika cases by cluster, between epidemiological weeks 31, 2015 and 52, 2016, Rio de Janeiro city, Brazil. Red bands represent the time period at which the cluster was detected. Clusters are ordered according to the maximum LLR, with 1 being the most likely cluster.
Figure 6.
Figure 6.
(a) Clusters of dengue, chikungunya and Zika detected using the multivariate scan statistic and (b) temporal distribution of cases by cluster, between epidemiological weeks 31, 2015 and 52, 2016, Rio de Janeiro city, Brazil. Red bands represent the time period in which the cluster was detected. Clusters are ordered according to the maximum LLR, with 1 being the most likely cluster.

References

    1. Nogueira RM, Eppinghaus AL. 2011. Dengue virus type 4 arrives in the state of Rio de Janeiro: a challenge for epidemiological surveillance and control. Mem. Inst. Oswaldo Cruz 106, 255–256. (10.1590/S0074-02762011000300001) - DOI - PubMed
    1. Brasil, Ministério da Saúde. 2017. Monitoramento dos casos de dengue, febre de chikungunya e febre pelo vírus Zika até a Semana Epidemiológica 52, 2016. Bol. Epidemiol. 48, 1–11.
    1. Brasil, Ministério da Saúde. 2015. Situação epidemiológica de ocorrência de microcefalias no Brasil, 2015. Bol. Epidemiol. 46, 1–3.
    1. Jaenisch T, Rosenberger KD, Brito C, Brady O, Brasil P, Marques ET. 2017. Risk of microcephaly after Zika virus infection in Brazil, 2015 to 2016. Bull. World Health Organ. 95, 191–198. (10.2471/BLT.16.178608) - DOI - PMC - PubMed
    1. Paixão ES, Teixeira MG, Rodrigues LC. 2018. Zika, chikungunya and dengue: the causes and threats of new and re-emerging arboviral diseases. BMJ Global Health 3, e000530 (10.1136/bmjgh-2017-000530) - DOI - PMC - PubMed

Publication types

Cite

AltStyle によって変換されたページ (->オリジナル) /