This site needs JavaScript to work properly. Please enable it to take advantage of the complete set of features!
Skip to main page content
U.S. flag

An official website of the United States government

Dot gov

The .gov means it’s official.
Federal government websites often end in .gov or .mil. Before sharing sensitive information, make sure you’re on a federal government site.

Https

The site is secure.
The https:// ensures that you are connecting to the official website and that any information you provide is encrypted and transmitted securely.

NIH NLM Logo
Log in
Access keys NCBI Homepage MyNCBI Homepage Main Content Main Navigation
. 2019 Jun 11;9(1):8445.
doi: 10.1038/s41598-019-44902-z.

Evaluation of ultra-low input RNA sequencing for the study of human T cell transcriptome

Affiliations

Evaluation of ultra-low input RNA sequencing for the study of human T cell transcriptome

Jingya Wang et al. Sci Rep. .

Abstract

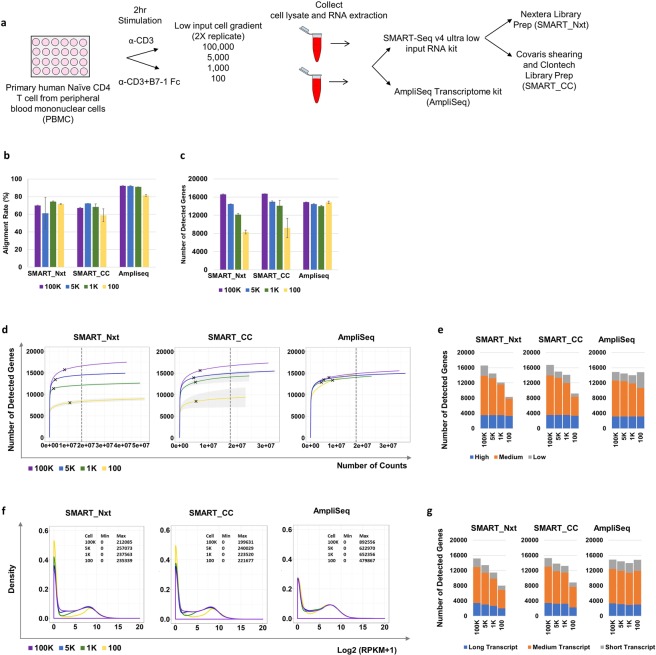
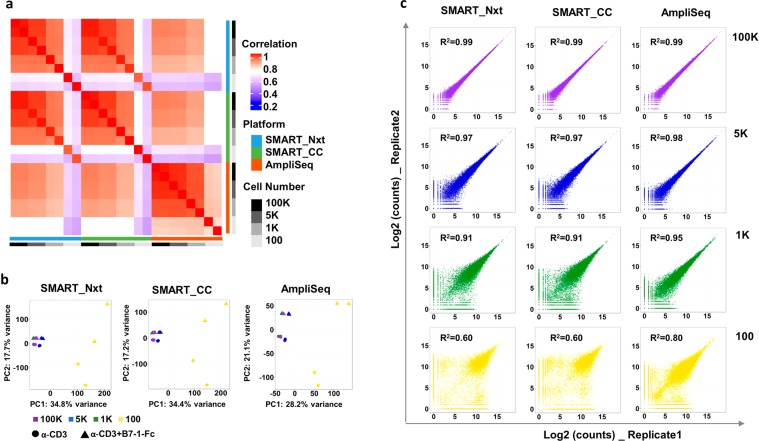
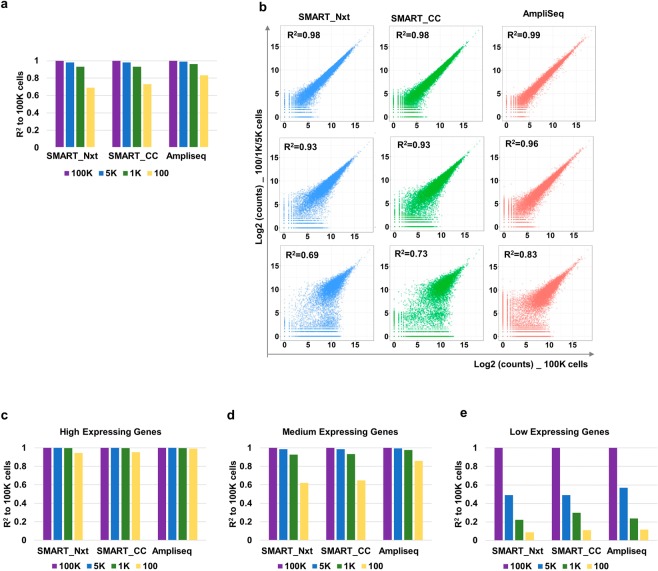
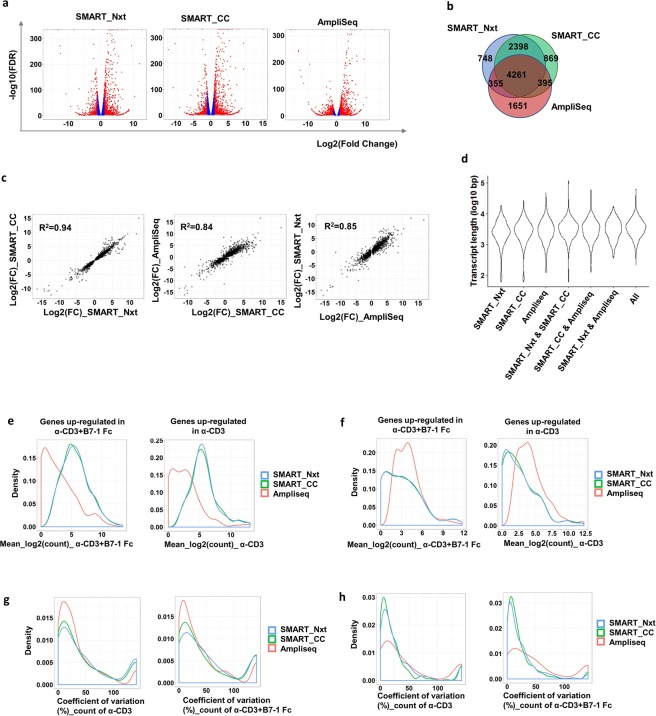
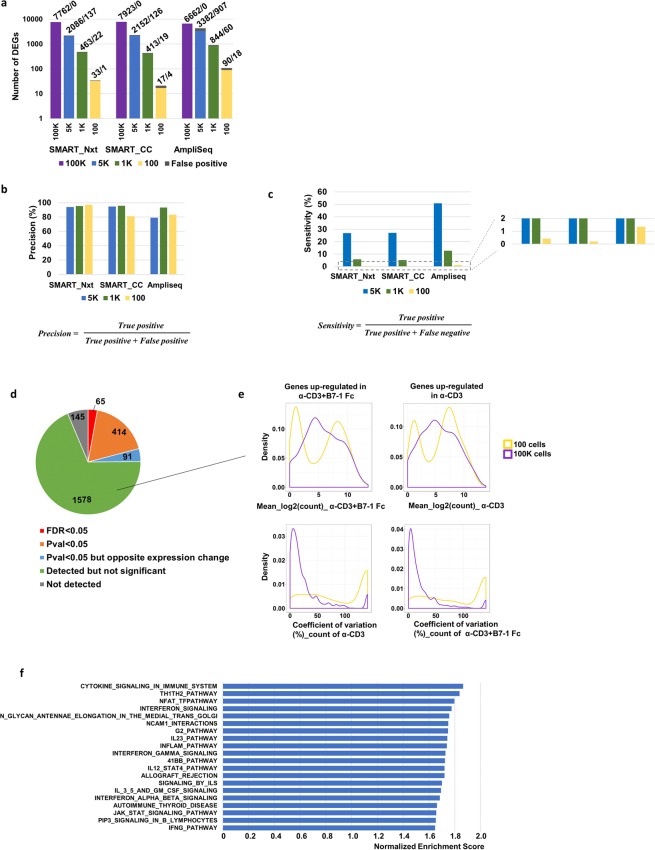
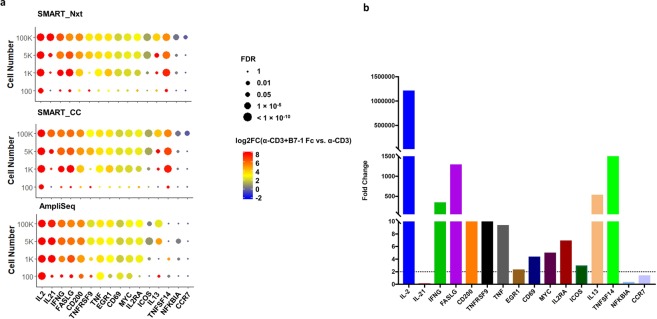
Deeper understanding of T cell biology is crucial for the development of new therapeutics. Human naïve T cells have low RNA content and their numbers can be limiting; therefore we set out to determine the parameters for robust ultra-low input RNA sequencing. We performed transcriptome profiling at different cell inputs and compared three protocols: Switching Mechanism at 5' End of RNA Template technology (SMART) with two different library preparation methods (Nextera and Clontech), and AmpliSeq technology. As the cell input decreased the number of detected coding genes decreased with SMART, while stayed constant with AmpliSeq. However, SMART enables detection of non-coding genes, which is not feasible for AmpliSeq. The detection is dependent on gene abundance, but not transcript length. The consistency between technical replicates and cell inputs was comparable across methods above 1 K but highly variable at 100 cell input. Sensitivity of detection for differentially expressed genes decreased dramatically with decreased cell inputs in all protocols, support that additional approaches, such as pathway enrichment, are important for data interpretation at ultra-low input. Finally, T cell activation signature was detected at 1 K cell input and above in all protocols, with AmpliSeq showing better detection at 100 cells.


Conflict of interest statement

Wang J., Rieder S., Hayes S., Halpin R., de los Reyes M., Shrestha Y., Kolbeck R., Raja R. are full time employees and shareholders of AstraZeneca plc. Wu J has been a full time employee and shareholder of AstraZeneca plc until recently.

Figures

Figure 1
Figure 1
Number of detected genes decreased with reduced input in SMART technology, while it remained constant for AmpliSeq technology. (a) Experiment design for low-input RNA-Sequencing platform evaluation using stimulated primary human naïve CD4 T cells. Three protocols based on two technologies and four cell gradients were tested. (b) Alignment rates for samples at the four input cell gradients (100, 1 K, 5 K, 100 K) for the three protocols. Bar plot shows mean +/− standard deviation of the replicates. (c) Number of USCS genes detected (count > 0) for samples at the four input cell gradients (100, 1 K, 5 K, 100 K) for the three protocols. Bar plot shows mean +/− standard deviation of the replicates. (d) Collection curves showing the number of detected genes at different sequencing depths in SMART_Nxt (left), SMART_CC (middle), AmpliSeq (right). Solid lines indicate the mean and shading regions indicate standard deviation. Black crosses in each sample indicates the sequencing depth where 90% of the genes were detected. Vertical dashed black lines indicate sampled library size for downstream analysis. (e) Number of detected genes grouped into high, medium and low expressing genes. (f) Density plot showing the distribution of the log2 transformed RPKM values in each cell input in SMART_Nxt (left), SMART_CC (middle), AmpliSeq (right). Minimum and maximum RPKM values at each cell input were also listed on the upper right of the plot. (g) Number of detected genes grouped into short, medium and long transcripts. Samples from α-CD3+ B7-1 Fc treatment were used for all figures.
Figure 2
Figure 2
Consistency between technical replicates was high at cell input equal to or above 1 K, and there was increased variability at 100 cell input. (a) Heatmap showing Pearson correlation of log2 transformed count values (Blue indicates low correlation and red indicates high correlation). Samples from α-CD3 + B7-1 Fc treatment are shown. (b) PCA plot show global expression pattern for sample in each cell gradient in each platform. Samples from both α-CD3 and α-CD3 + B7-1 Fc treatment are shown. (c) Scatter plots show correlation between the two replicates for each cell gradient in each platform. R2 indicates coefficient of determination. Samples from α-CD3 + B7-1 Fc treatment are shown.
Figure 3
Figure 3
Consistency between different gradients was high at cell input equal to or above 1 K, and the greatest impact was observed on the loss of low expressing genes at 100 cell input. (a) Bar plots show correlation between 5 K, 1 K or 100 cell inputs and 100 K cells input for each platform. Replicate 1 of each set was used for the calculation. R2 indicates coefficient of determination. (b) Scatter plot show the correlation between samples from the 5 K (top), 1 K (middle), 100 (bottom) cells to samples from the 100 K cells for each platform. Replicate 1 was used for the calculation. (ce) Bar plot show correlation between samples from the 5 K, 1 K or 100 cell input and 100 K cells for each platform. Panels are separated to represent (c) high, (d) medium and (e) low expressing genes. Replicate 1 was used for the calculation. R2 indicates coefficient of determination. In each figure, samples from α-CD3 + B7-1 Fc treatment were used.
Figure 4
Figure 4
Three different platforms detected common differentially expressed genes; however platform specific detection was also observed. (a) Differential gene expression analysis for each platform. Red dots indicate genes with FDR < 0.05 and Fold change > = 2, blue dots indicate genes with FDR < 0.05 and Fold change < 2, grey dots indicate genes with FDR > 0.05. (b) Overlapping differentially expressed genes (FDR < 0.05) among platforms. (c) Scatterplots showing the log2 transformed fold change between each pair of the three platforms for the 4261 common DEGs. R2 indicates coefficient of determination. (d) Distribution of transcript lengths of the common and platform specific DEGs as in (b). (e) The distribution in expression of 2398 genes that were common for SMART_Nxt and SMART_CC (expression in α-CD3 + B7-1 Fc for genes up-regulated in α-CD3 + B7-1 Fc vs. α-CD3, and expression in α-CD3 for genes down-regulated in α-CD3 + B7-1 Fc vs. α-CD3). (f) Distribution of transcript lengths for AmpliSeq specific 1651genes. (g,h) The coefficient of variation (CV) between replicates for (g) SMART_Nxt and SMART_CC common DEGs and (h) AmpliSeq specific genes.
Figure 5
Figure 5
Number of differentially expressed genes decreased with reduced input, precision of detection stayed robust and AmpliSeq demonstrated greater sensitivity. (a) Number of DEGs between α-CD3 and α-CD3 + B7-1-Fc at 100 K, 5 K, 1 K and 100 cells input using Amplieq, SMART_Nxt and SMART_CC platforms (FDR < 0.05). Gray boxes indicate the DEGs not detected in 100 K cell samples (benchmark sample) but detected at low cell-number gradients (false positive hits). The absolute number of true positive and false positive detected genes were shown above each bar in the plot. (b) Precision for detecting DEGs at low input samples. (c) Sensitivity for detecting DEGs at low input samples. (d) Pie plot showing the differential expression analysis results for the DEGs detected in the 100 K samples (FDR < 0.05 and Fold change > 2) but not the 100 cell samples. (e) For the 1578 non-significant genes as in (d), density plots showing the mean log2 count and coefficient of variation between replicates for the 100 K cell samples and 100 cell samples. (f) Top 20 pathways enriched in α-CD3 + B7-1 Fc from the gene set enrichment analysis (GSEA) for the 100 cell sample. Bar plot shows the normalized enrichment score. All pathways passed the FDR < 0.25 as recommended by the GSEA team.
Figure 6
Figure 6
Detection of well-known T cell activation markers was achieved at 1 K cell input and above, and AmpliSeq detected higher percentage of these genes at 100 cell input. (a) Log2 fold change and FDR between α-CD3 and α-CD3 + B7-1-Fc for selected genes that were reported previously to be up-regulated at T cell activation. Log2 fold change is indicated by color and significance (FDR) is indicated by size of the points. (b) qRT-PCR analysis of selected genes, fold change in α-CD3 + B7-1 Fc group when compared to α-CD3 only is shown.

References

    1. Kumar BV, Connors TJ, Farber DL. Human T Cell Development, Localization, and Function throughout Life. Immunity. 2018;48:202–213. doi: 10.1016/j.immuni.201801007. - DOI - PMC - PubMed
    1. Akdis CA. T cells in health and disease. J Allergy Clin Immunol. 2009;123:1022–1023. doi: 10.1016/j.jaci.2009年03月03日4. - DOI - PubMed
    1. Kamta J, Chaar M, Ande A, Altomare DA, Ait-Oudhia S. Advancing Cancer Therapy with Present and Emerging Immuno-Oncology Approaches. Front Oncol. 2017;7:64. doi: 10.3389/fonc.2017.00064. - DOI - PMC - PubMed
    1. Getts DR, et al. Current landscape for T-cell targeting in autoimmunity and transplantation. Immunotherapy. 2011;3:853–870. doi: 10.2217/imt.11.61. - DOI - PMC - PubMed
    1. Bluestone J. A., Bour-Jordan H. Current and Future Immunomodulation Strategies to Restore Tolerance in Autoimmune Diseases. Cold Spring Harbor Perspectives in Biology. 2012;4(11):a007542–a007542. doi: 10.1101/cshperspect.a007542. - DOI - PMC - PubMed
Cite

AltStyle によって変換されたページ (->オリジナル) /