This site needs JavaScript to work properly. Please enable it to take advantage of the complete set of features!
Skip to main page content
U.S. flag

An official website of the United States government

Dot gov

The .gov means it’s official.
Federal government websites often end in .gov or .mil. Before sharing sensitive information, make sure you’re on a federal government site.

Https

The site is secure.
The https:// ensures that you are connecting to the official website and that any information you provide is encrypted and transmitted securely.

NIH NLM Logo
Log in
Access keys NCBI Homepage MyNCBI Homepage Main Content Main Navigation
doi: 10.7554/eLife.44258.

Conversion of random X-inactivation to imprinted X-inactivation by maternal PRC2

Affiliations

Conversion of random X-inactivation to imprinted X-inactivation by maternal PRC2

Clair Harris et al. Elife. .

Abstract

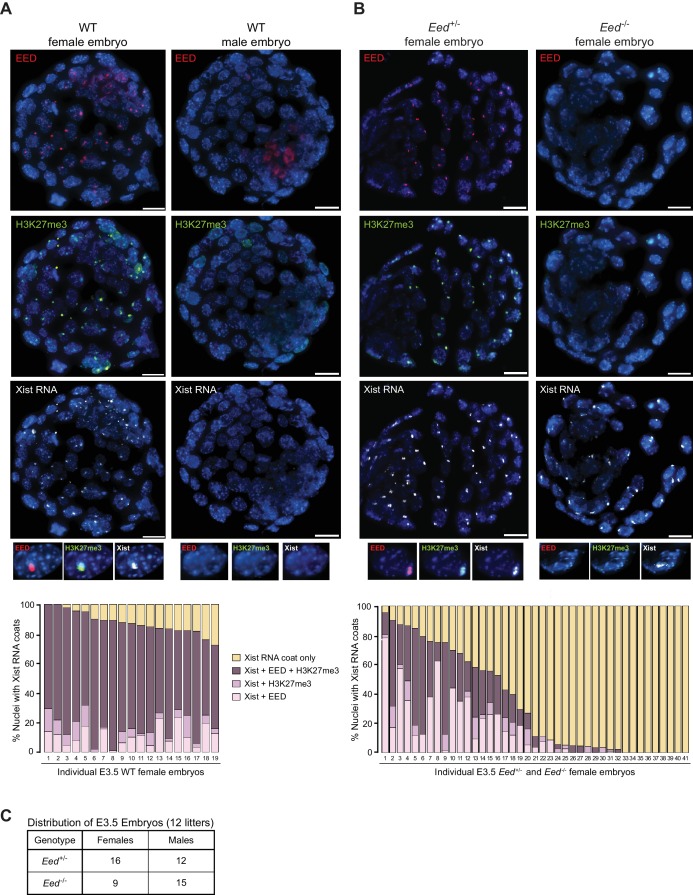
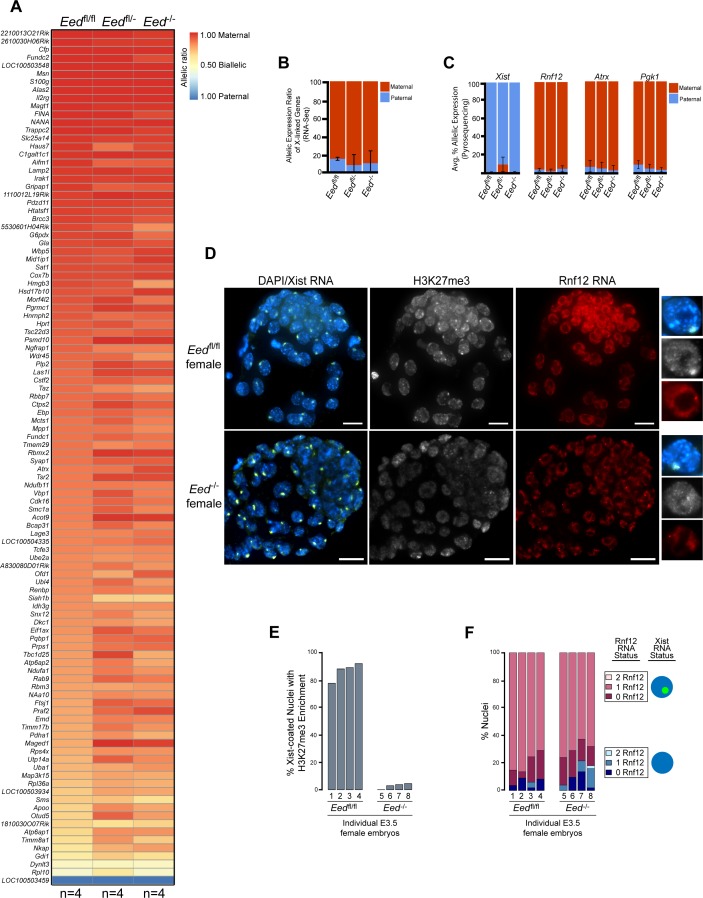
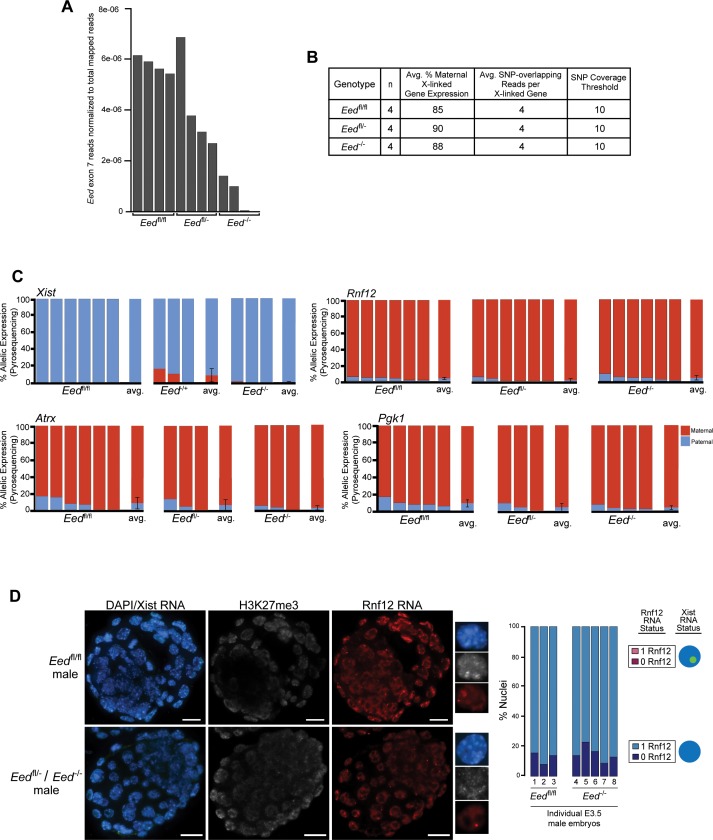
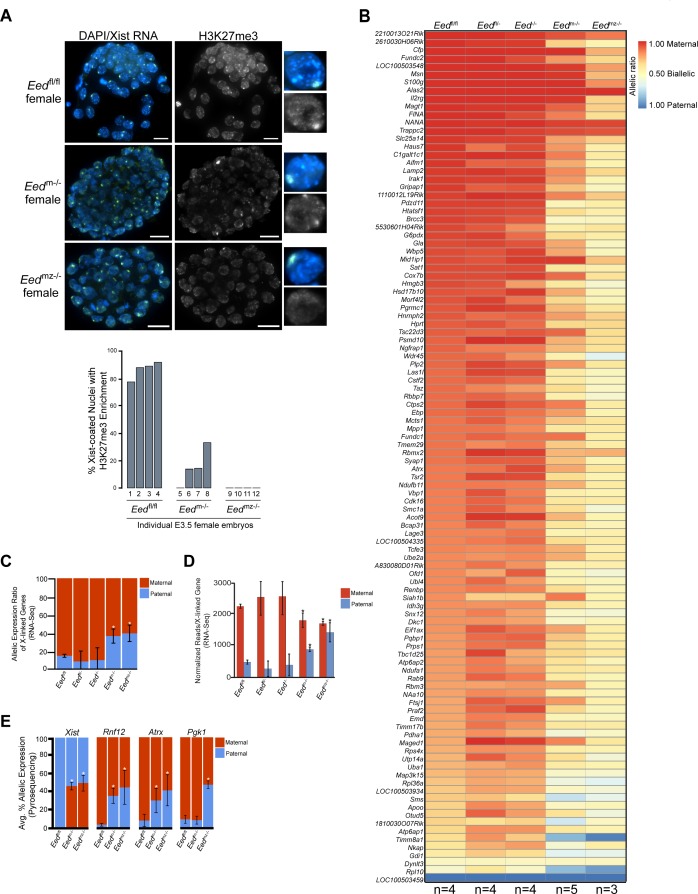
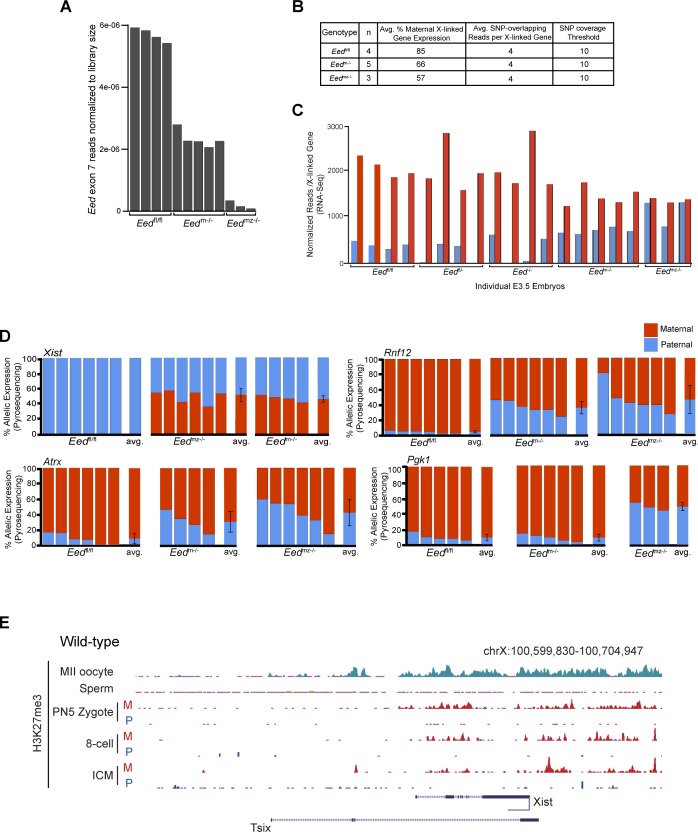
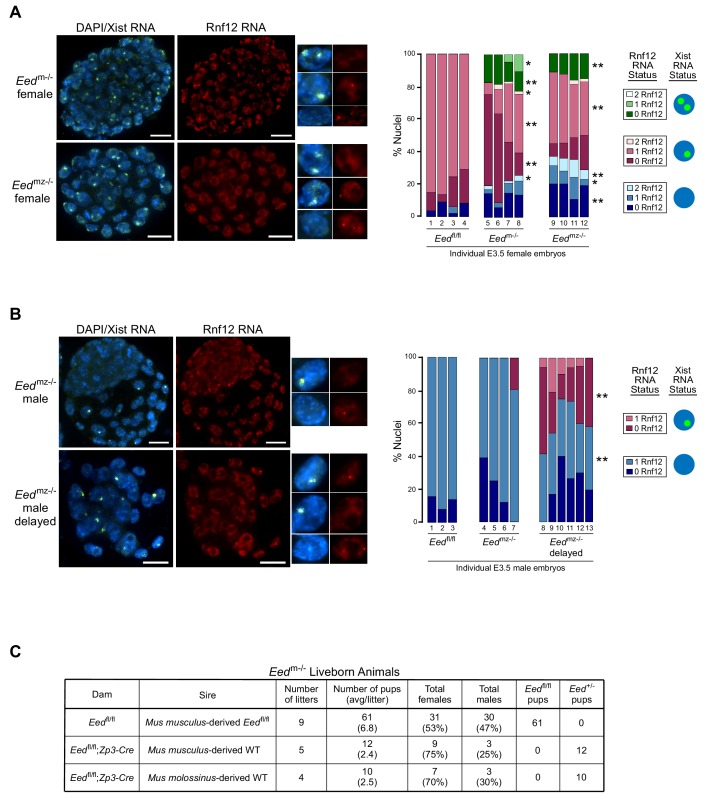
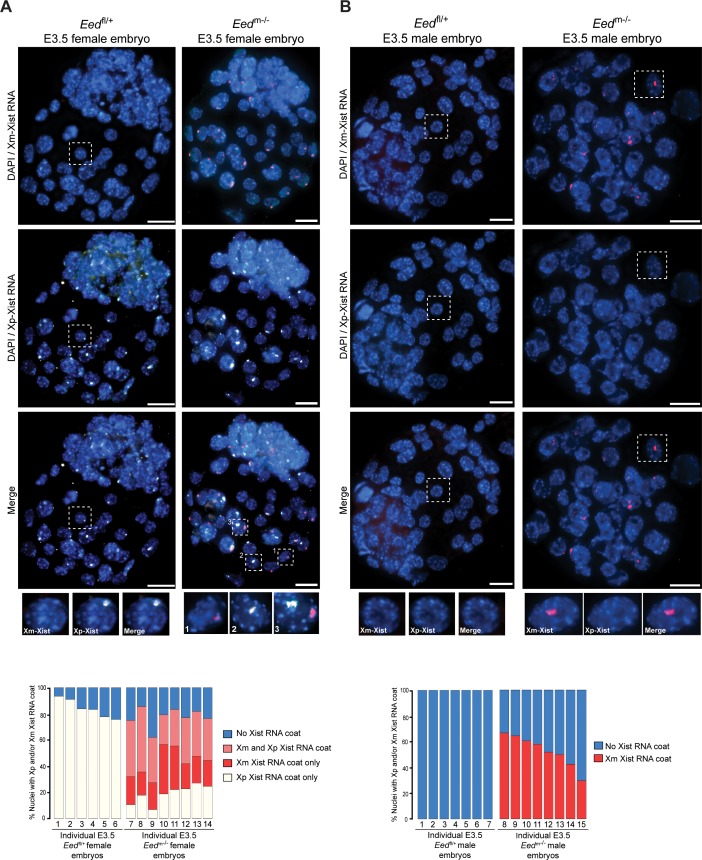
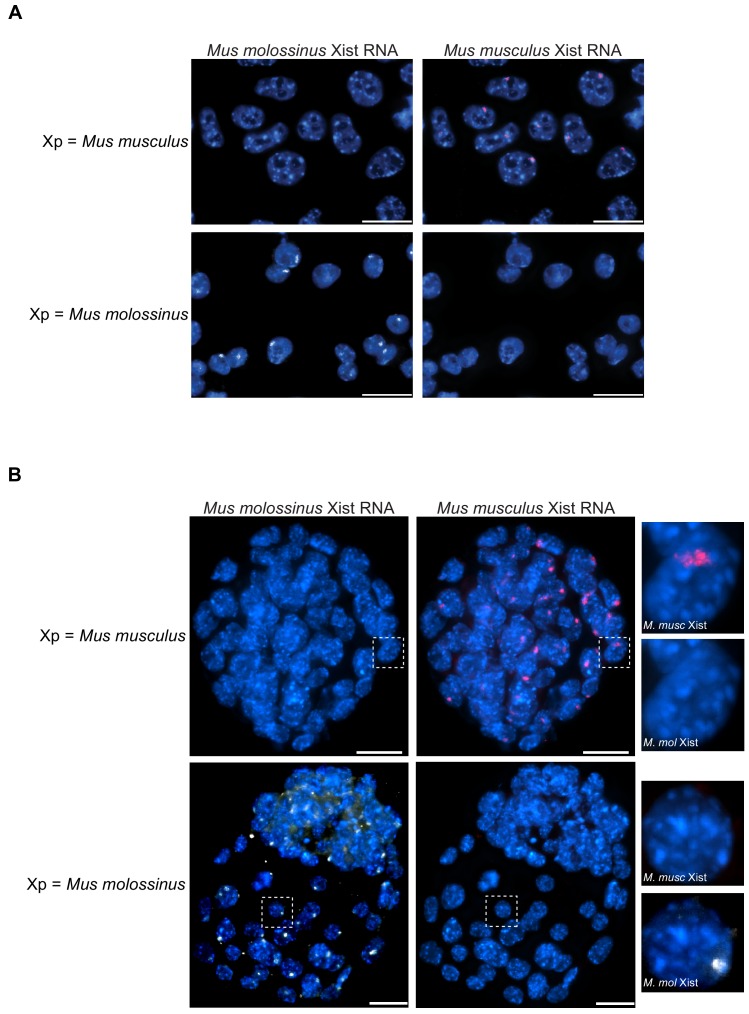
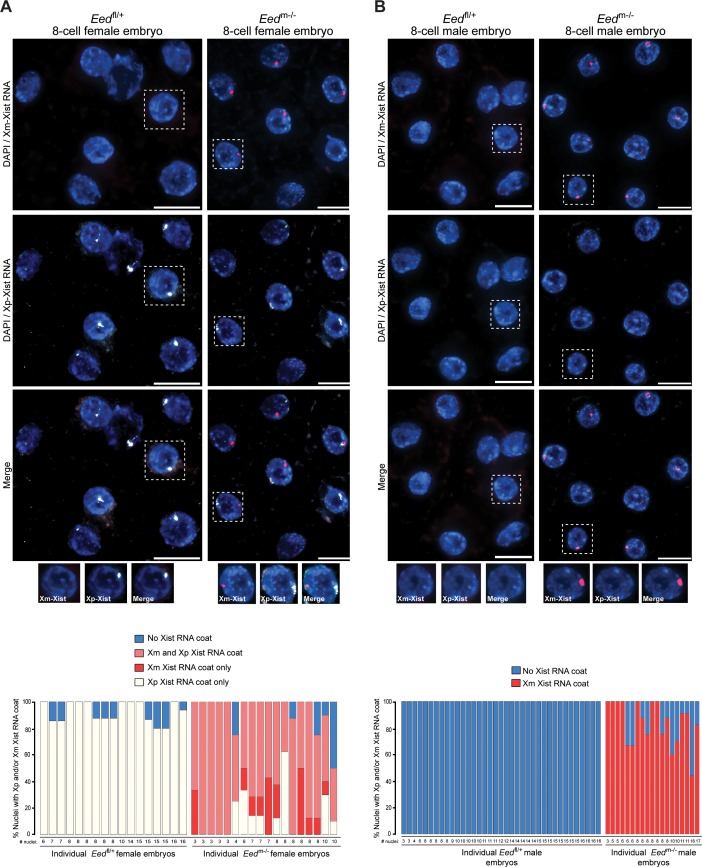
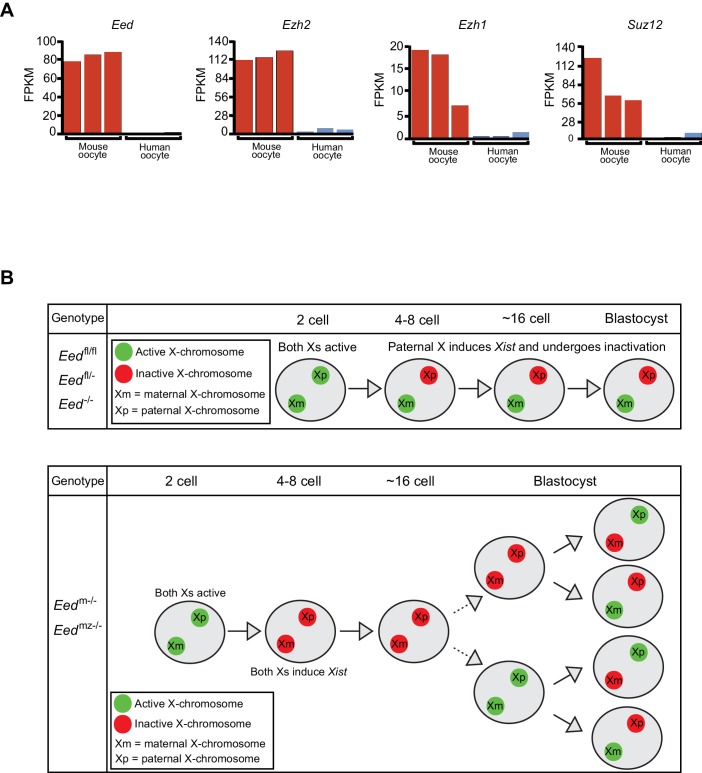
Imprinted X-inactivation silences genes exclusively on the paternally-inherited X-chromosome and is a paradigm of transgenerational epigenetic inheritance in mammals. Here, we test the role of maternal vs. zygotic Polycomb repressive complex 2 (PRC2) protein EED in orchestrating imprinted X-inactivation in mouse embryos. In maternal-null (Eedm-/-) but not zygotic-null (Eed-/-) early embryos, the maternal X-chromosome ectopically induced Xist and underwent inactivation. Eedm-/- females subsequently stochastically silenced Xist from one of the two X-chromosomes and displayed random X-inactivation. This effect was exacerbated in embryos lacking both maternal and zygotic EED (Eedmz-/-), suggesting that zygotic EED can also contribute to the onset of imprinted X-inactivation. Xist expression dynamics in Eedm-/- embryos resemble that of early human embryos, which lack oocyte-derived maternal PRC2 and only undergo random X-inactivation. Thus, expression of PRC2 in the oocyte and transmission of the gene products to the embryo may dictate the occurrence of imprinted X-inactivation in mammals.

Keywords: Polycomb repressive complex 2; X-chromosome inactivation; chromosomes; embryogenesis; epigenetic regulation; gene expression; imprinting; mouse.


Conflict of interest statement

CH, MC, MT, MH, SG, ZD, WX, SK No competing interests declared

Figures

Figure 1.
Figure 1.. Coincident accumulation of EED and H3K27me3 on the inactive X-chromosome in blastocyst-stage WT, Eed+/- and Eed-/- mouse embryos.
See also Figure 1—figure supplement 1. (A,B) RNA FISH detection of Xist RNA (white) and immunofluorescence (IF) detection of EED (red) and H3K27me3 (green) in representative female and male wild-type (WT) (A) or female Eed+/- and Eed-/- (B) E3.0 – E3.5 blastocyst embryos. Nuclei are stained blue with DAPI. Scale bars, 20 μm. Embryos ranged in size from 23 to 57 nuclei. Bar plots, percentage of nuclei with coincident accumulation of Xist RNA and EED and/or H3K27me3 enrichment in individual embryos. (C) Genotype and sex distribution of Eed+/- and Eed-/- mouse blastocyst embryos from the cross in (B). The difference between the frequency of Eed+/- vs Eed-/- male and female embryos is not significant (p>0.05, Two-tailed Student’s T-test).
Figure 1—figure supplement 1.
Figure 1—figure supplement 1.. Generation of Eed-/- embryos.
(A) Schematic depicting the deletion of floxed Eed exon seven by CRE recombinase. (B) Breeding data showing the efficiency of Prm-Cre deletion of the Eedfl allele.
Figure 2.
Figure 2.. Assessment of maternal and zygotic EED expression in early preimplantation embryos.
See also Figure 2—figure supplement 1, and Figure 2—source data 1. (A,B) Immunofluorescent (IF) detection of EED (red) and H3K27me3 (green) in 2- and 16-cell Eedfl/fl, Eedfl/- / Eed-/-, Eedm-/-, and Eedmz-/- embryos. Nuclei are stained blue by DAPI. (C) Dot plots of EED and H3K27me3 IF signals in the five genotypes (Eedfl/fl, Eedfl/-, Eed-/-, Eedm-/-, Eedmz-/-) at the ~2-cell,~4-cell, ~8-cell, and ~16-cell stage. Each dot represents an individual embryo. The gray line indicates mean fluorescence intensity. Pairwise statistical comparisons between all genotypes are included in Supplementary file 1. (D) Significance testing of differences in EED fluorescence intensity in ~2-cell embryos and ~16-cell embryos plotted in (C) (Two-tailed Student’s T-test). (E) Mean EED fluorescence intensity from data in (C) plotted across early embryogenesis. (F) Model of change in maternal, zygotic, and total EED expression levels during early embryonic development.
Figure 2—figure supplement 1.
Figure 2—figure supplement 1.. Analysis of EED and H3K27me3 fluorescence intensity in Eed mutants.
(A) Schematic depicting the deletion of Eed exon seven by Zp3-Cre used to generate embryos maternally null for Eed. (B) Representative images of Eedfl/fl, Eedfl/-, Eed-/-, Eedm-/-, and Eedmz-/- 4- and 8-cell embryos stained by IF for EED and H3K27me3. Nuclei are indicated by blue DAPI stain, EED stain is indicated in red, and H3K27me3 stain is indicated in green.
Figure 3.
Figure 3.. Lack of defective X-inactivation initiation in Eed-/- blastocysts.
See also Figure 3—figure supplement 1. (A) Allele-specific X-linked gene expression heat map of female Eedfl/fl, Eedfl/-, and Eed-/- blastocysts. Four embryos each of Eedfl/fl, Eedfl/-, and Eed-/- genotypes were sequenced individually and only genes with informative allelic expression in all samples are plotted (see Materials and methods). Genes are ordered on the basis of allelic expression in Eedfl/fl embryos. (B) Average allelic expression of the RNA-Seq data shown in (A). The mean allelic expression of X-linked genes lacks significant difference between each combination of the three genotypes (p>0.05, Welch’s two-sample T-test). Pairwise statistical comparisons between all genotypes are included in Supplementary file 3. (C) Pyrosequencing-based quantification of allelic expression of X-linked genes Xist, Rnf12, Atrx and Pgk1 in Eedfl/fl, Eedfl/-, and Eed-/- blastocysts. Error bars represent the standard deviation of data from 3 to 6 independent blastocyst embryos. The mean allelic expression of all four genes lack significant difference between each combination of the three genotypes (p>0.05, Welch’s two-sample T-test). Pairwise statistical comparisons for all genes and between all genotypes are included in Supplementary file 4. (D) RNA FISH detection of Xist RNA (green), Rnf12 RNA (red), and IF detection of H3K27me3 (white) in representative Eedfl/fl or Eed-/- female blastocysts. Nuclei are stained blue with DAPI. Scale bars, 20 μm. Individual nuclei displaying representative categories of stains are shown to the right of each embryo. Embryos ranged in size from 39 to 100 nuclei. (E) Bar plot of percentage of nuclei with coincident accumulation of Xist RNA and H3K27me3 in individual Eedfl/fl and Eed-/- embryos. Each bar is an individual embryo. Embryo numbers under the bars correspond to the same embryos plotted in F). (F) Bar plots of percentage of nuclei with or without Xist RNA-coating and Rnf12 RNA expression in the embryos stained in D) and plotted in E). The numbers under the bars correspond to the same embryos plotted in E).
Figure 3—figure supplement 1.
Figure 3—figure supplement 1.. X-linked gene expression analysis in Eed-/- embryos.
(A) Validation of genotypes of E3.5 Eedfl/fl, Eedfl/-, and Eed-/- female blastocyst embryos. Eed exon 7 RNA-Seq reads are normalized to total mapped RNA-Seq reads. (B) Table describing the RNA-Seq genotypes, number of sequenced embryos, average % maternal X-linked gene expression, average number of SNPs per X-linked gene, and the SNP overlapping read coverage threshold. A comprehensive list of expression levels of all informative genes is included in Supplementary file 2. (C) Pyrosequencing-based quantification of allelic expression of X-linked genes Xist, Rnf12, Atrx, and Pgk1 in individual Eedfl/fl, Eedfl/-, and Eed-/- female blastocysts. Error bars, standard deviation of data from 3 to 6 independent embryos. The mean allelic expression of all four genes lacks significant difference between each combination of the three genotypes (p>0.05, Welch’s two-sample T-test). Pairwise statistical comparisons for all genes and between all genotypes are included in Supplementary file 4. (D) RNA FISH detection of Xist RNA (green), Rnf12 RNA (red), and IF detection of H3K27me3 (white) in representative Eedfl/fl and Eedfl/- or Eed-/- male blastocysts. Nuclei are stained blue with DAPI. Scale bars, 20 μm. Right of each embryo, individual nuclei displaying representative categories of stains. Embryos ranged in size from 56 to 65 nuclei. Bar plot, percentage of nuclei with or without Xist RNA-coating and Rnf12 RNA expression.
Figure 4.
Figure 4.. Defective imprinted X-inactivation initiation in blastocysts lacking maternal EED.
See also Figure 4—figure supplement 1. (A) RNA FISH detection of Xist RNA (green) and IF stain for H3K27me3 (white) in representative Eedm-/- and Eedmz-/- female blastocysts. Nuclei are stained blue with DAPI. Scale bars, 20 μm. Eedfl/fl blastocyst from Figure 3D shown for comparison. Right, individual representative nuclei. Mutant embryos ranged in size from 46 to 80 nuclei. Bar plot shows percentage of nuclei in each embryo analyzed that displayed H3K27me3 enrichment on the Xist RNA-coated X-chromosome. (B) Maternal:paternal X-linked gene expression heat map of female Eedm-/- and Eedmz-/- blastocysts. Five Eedm-/- and three Eedmz-/- embryos were sequenced individually and only genes with informative allelic expression in all samples are plotted (see Materials and methods). Eedfl/fl, Eedfl/-, and Eed-/- data from Figure 3A shown for comparison. Genes are ordered on the basis of allelic expression in Eedfl/fl embryos. (C) Average maternal:paternal X-linked gene expression ratio from the RNA-Seq data shown in B). Eedfl/fl, Eedfl/-, and Eed-/- data from Figure 3B shown for comparison. The mean allelic expression of X-linked genes is significantly different between Eedm-/- and Eedfl/fl, and Eedmz-/- and Eedfl/fl blastocysts. (p<0.05, Welch’s two-sample T-test). Pairwise statistical comparisons between all genotype groups are included in Supplementary file 3. (D) Average normalized maternal and paternal X-linked gene expression in blastocysts. Maternal and paternal X-linked gene expression is significantly different between Eedm-/- and Eedmz-/- embryos compared to Eedfl/fl embryos (*, p<0.05, Two-tailed Student’s T-test). Pairwise statistical comparisons between all genotypes are included in Supplementary file 3. (E) Pyrosequencing-based quantification of allelic expression of X-linked genes in Eedm-/- and Eedmz-/- blastocysts. Eedfl/fl data from Figure 3C are shown for comparison. Error bars represent the standard deviation of data from 3 to 6 independent blastocyst embryos. The mean allelic expression of Xist, Rnf12, and Atrx is significantly different between Eedfl/fl and Eedm-/- embryos. The mean allelic expression of Xist, Rnf12, Pgk1, and Atrx is significantly different between Eedfl/fl and Eedmz-/- embryos (p<0.05, Welch’s two-sample T-test). Pairwise statistical comparisons for all genes and between all genotypes are included in Supplementary file 4.
Figure 4—figure supplement 1.
Figure 4—figure supplement 1.. Generation and X-linked gene profiling of Eedm-/- and Eedmz-/- embryos.
(A) Validation of genotypes of E3.5 female embryos. Eed exon 7 RNA-Seq reads are normalized to total mapped RNA-Seq reads. (B) Table describing the RNA-Seq genotypes, number of sequenced embryos, average percentage maternal X-linked gene expression, average number of SNPs per X-linked gene, and the SNP overlapping read coverage threshold. A comprehensive list of expression levels of all informative genes is included in Supplementary file 2. (C) Normalized maternal or paternal reads per X-linked gene in individual Eedfl/fl, Eedfl/-, Eed-/-, Eedm-/-, and Eedmz-/- female E3.5 blastocysts. (D) Pyrosequencing-based quantification of allelic expression of X-linked genes Xist, Rnf12, Atrx, and Pgk1 in individual Eedfl/fl, Eedm-/-, and Eedmz-/- female E3.5 blastocysts. Error bars, standard deviation of data from 3 to 6 independent embryos. The mean allelic expression for Xist, Rnf12, and Atrx is significantly different between Eedfl/fl and Eedm-/- embryos (p<0.05, Welch’s two-sample T-test). The mean allelic expression for Xist, Rnf12, Atrx, and Pgk1 is significantly different between Eedfl/fl and Eedmz-/- embryos (p<0.05, Welch’s two-sample T-test). The mean allelic expression of Pgk1 is significantly different between Eedm-/- and Eedmz-/- embryos (p<0.05, Welch’s two-sample T-test). Pairwise statistical comparisons for all genes and between all genotypes are included in Supplementary file 4. (E) Allele-specific H3K27me3 ChIP-Seq at the Xist locus of wild-type MII oocyte, sperm, PN5 zygote, 8 cell embryo, and inner cell mass (ICM) (Zheng et al., 2016).
Figure 5.
Figure 5.. RNA FISH analysis of X-inactivation in Eedm-/- and Eedmz-/- blastocysts.
(A,B) RNA FISH detection of Xist RNA (green) and Rnf12 RNA (red) in representative Eedm-/- and Eedmz-/- female (A) and Eedmz-/- male (B) blastocysts. Nuclei are stained blue with DAPI. Scale bars, 20 μm. Individual nuclei of representative categories of stain are shown to the right of each embryo. Eedfl/fl female data from Figure 3D shown for comparison. Mutant female embryos ranged in size from 46 to 80 nuclei. Fully developed mutant male embryos ranged in size from 53 to 110 nuclei. Delayed mutant male embryos ranged in size from 30 to 40 nuclei. Bar plot shows percentage of nuclei in each embryo with Xist RNA coats and/or Rnf12 RNA expression. Each bar represents an individual embryo and embryo numbers under the bars correspond to the same female embryos plotted in Figure 4A. *, p<0.05; **, p<0.01, Two-tailed Student’s T-test, between Eedm-/- and Eedfl/fl, or Eedmz-/- and Eedfl/fl. (C) Data showing the number of Eedm-/- embryos which can live to term compared to Eedfl/fl embryos. WT, wild-type. Table shows Eedm-/- litters sired by Mus musculus-derived male or Mus molossinus-derived male. Male Eedm-/- offspring are underrepresented compared to females, p=0.02, Two-tailed Student’s T-test.
Figure 6.
Figure 6.. Switching of imprinted to random X-inactivation in E3.5 embryos lacking maternal EED.
See also Figure 6—figure supplement 1. (A,B) Allele-Specific Xist RNA FISH in Eedfl/+ and Eedm-/- male and female E3.0-E3.5 blastocyst embryos. Xist RNA expressed from the maternal X-chromosome is indicated in red and from the paternal X-chromosome in white. Representative embryos are depicted. Nuclei are stained blue with DAPI. Scale bars, 20 μm.
Figure 6—figure supplement 1.
Figure 6—figure supplement 1.. Characterization of allele-specific Xist RNA FISH probe in cells and embryos.
(A) Female Trophoblast stem (TS) cells (top panel) and extraembryonic endoderm (XEN) stem cells (bottom panel) stained with an allele-specific Xist RNA FISH probe. Both TS cells and XEN cells express Xist from and undergo imprinted X-inactivation of the paternal X-chromosome (Kunath et al., 2005; Tanaka et al., 1998). The TS cells are derived from a cross of JF1 Mus molossinus dam with a 129/S1-derived Mus musculus sire. The XEN cells are generated from a cross of 129/S1 Mus musculus dam and JF1 Mus molossinus-derived sire. In the TS cells, the paternal-X is therefore Mus musculus derived while in the XEN cells the paternal-X is JF1 Mus molossinus derived. Mus musculus-specific Xist RNA FISH probe detects the complimentary Xist RNA in red and the Mus molossinus-specific Xist RNA FISH probe detects its complimentary Xist RNA in white. (B) Eedfl/+ female E3.5 embryos stained with the same allele-specific Xist RNA FISH probe as in (A). Top panels, representative stained embryo derived from a cross of Eedfl/fl;XJF1XJF1 Mus molossinus-derived dam with a Mus musculus sire. Bottom panels, representative stained embryo from an Eedfl/fl Mus musculus-derived dam with a JF1 Mus molossinus-derived sire (this embryo is also shown in Figure 6A). Due to imprinted X-inactivation, both E3.5 embryos are expected to express Xist RNA from their paternal X-chromosome.
Figure 7.
Figure 7.. Switching of imprinted to random X-inactivation in 3–16 cell embryos lacking maternal EED.
(A,B) Allele-Specific Xist RNA FISH in Eedfl/+ and Eedm-/- female and male 3–16 cell embryos. Xist RNA expressed from the maternal X-chromosome is indicated in red and from the paternal X-chromosome in white. Representative embryos are depicted. Nuclei are stained blue with DAPI. Scale bars, 20 μm.
Figure 8.
Figure 8.. Lack of PRC2 expression in human oocytes and a path to randomization of X-inactivation in early embryos.
(A) Expression levels by RNA-Seq of core PRC2 components in human and mouse oocytes. (B) Model of maternal PRC2 function during preimplantation mouse embryogenesis.

References

    1. Anders S, Pyl PT, Huber W. HTSeq--a Python framework to work with high-throughput sequencing data. Bioinformatics. 2015;31:166–169. doi: 10.1093/bioinformatics/btu638. - DOI - PMC - PubMed
    1. Barlow DP. Genomic imprinting: a mammalian epigenetic discovery model. Annual Review of Genetics. 2011;45:379–403. doi: 10.1146/annurev-genet-110410-132459. - DOI - PubMed
    1. Borensztein M, Syx L, Ancelin K, Diabangouaya P, Picard C, Liu T, Liang JB, Vassilev I, Galupa R, Servant N, Barillot E, Surani A, Chen CJ, Heard E. Xist-dependent imprinted X inactivation and the early developmental consequences of its failure. Nature Structural & Molecular Biology. 2017;24:226–233. doi: 10.1038/nsmb.3365. - DOI - PMC - PubMed
    1. Cao R, Wang L, Wang H, Xia L, Erdjument-Bromage H, Tempst P, Jones RS, Zhang Y. Role of histone H3 lysine 27 methylation in Polycomb-group silencing. Science. 2002;298:1039–1043. doi: 10.1126/science.1076997. - DOI - PubMed
    1. Cloutier M, Harris C, Gayen S, Maclary E, Kalantry S. Experimental Analysis of Imprinted Mouse X-Chromosome Inactivation. Methods in molecular biology. 2018;1861:177–203. doi: 10.1007/978-1-4939-8766-5_14. - DOI - PMC - PubMed

Publication types

MeSH terms

Associated data

Cite

AltStyle によって変換されたページ (->オリジナル) /