This site needs JavaScript to work properly. Please enable it to take advantage of the complete set of features!
Skip to main page content
U.S. flag

An official website of the United States government

Dot gov

The .gov means it’s official.
Federal government websites often end in .gov or .mil. Before sharing sensitive information, make sure you’re on a federal government site.

Https

The site is secure.
The https:// ensures that you are connecting to the official website and that any information you provide is encrypted and transmitted securely.

NIH NLM Logo
Log in
Access keys NCBI Homepage MyNCBI Homepage Main Content Main Navigation
. 2019 Mar 8;10(1):1124.
doi: 10.1038/s41467-019-08853-3.

Global monitoring of antimicrobial resistance based on metagenomics analyses of urban sewage

Collaborators, Affiliations

Global monitoring of antimicrobial resistance based on metagenomics analyses of urban sewage

Rene S Hendriksen et al. Nat Commun. .

Abstract

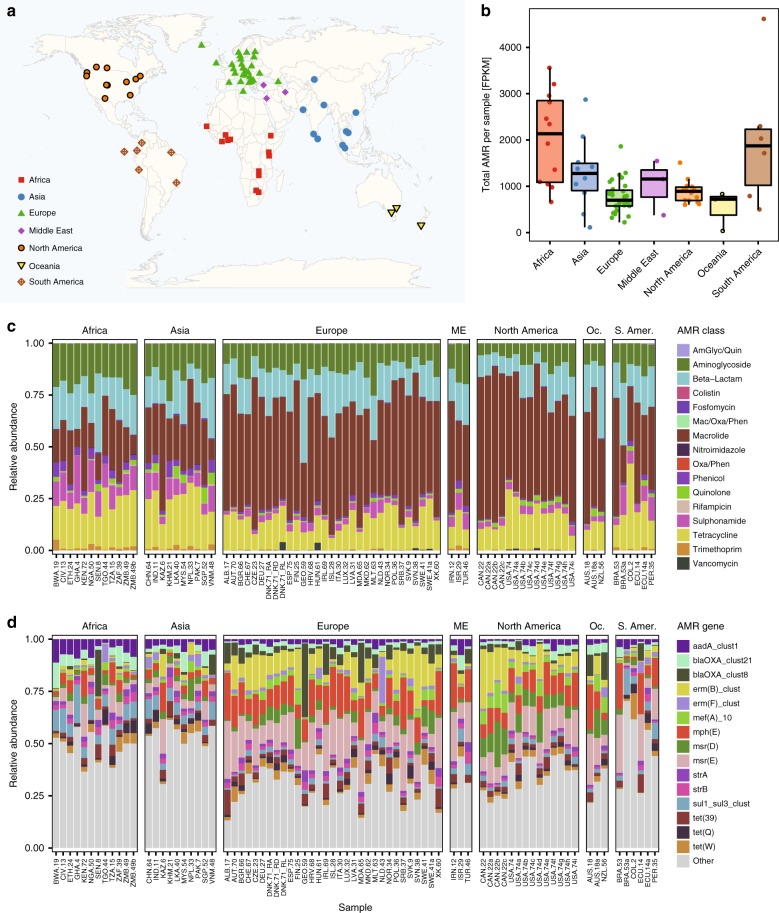
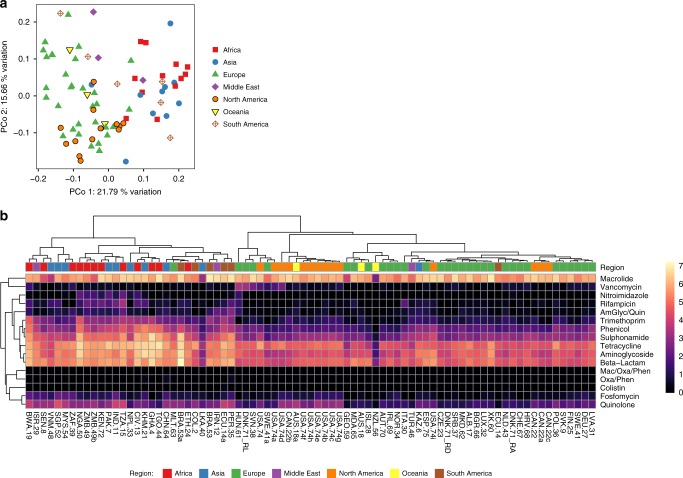
Antimicrobial resistance (AMR) is a serious threat to global public health, but obtaining representative data on AMR for healthy human populations is difficult. Here, we use metagenomic analysis of untreated sewage to characterize the bacterial resistome from 79 sites in 60 countries. We find systematic differences in abundance and diversity of AMR genes between Europe/North-America/Oceania and Africa/Asia/South-America. Antimicrobial use data and bacterial taxonomy only explains a minor part of the AMR variation that we observe. We find no evidence for cross-selection between antimicrobial classes, or for effect of air travel between sites. However, AMR gene abundance strongly correlates with socio-economic, health and environmental factors, which we use to predict AMR gene abundances in all countries in the world. Our findings suggest that global AMR gene diversity and abundance vary by region, and that improving sanitation and health could potentially limit the global burden of AMR. We propose metagenomic analysis of sewage as an ethically acceptable and economically feasible approach for continuous global surveillance and prediction of AMR.


Conflict of interest statement

The authors declare no competing interests.

Figures

Fig. 1
Fig. 1
Global sewage sampling sites and overview of antimicrobial resistance (AMR) abundance and composition. a Map of the sampling sites. b Boxplots of the total AMR fragments per kilo base per million fragments per sample, stratified by region. Each sample is represented by a dot with horizontal jitter for visibility. The horizontal box lines represent the first quartile, the median, and the third quartile. Whiskers denote the range of points within the first quartile − ×ばつ the interquartile range and the third quartile + ×ばつ the interquartile range. c Relative AMR abundance per antimicrobial class (AmGlyc aminoglycoside, Mac macrolide, Oxa oxazolidinone, Phen phenicol, Quin quinolone). d Relative abundance of the 15 most common AMR genes (mef(A)_10: mef(A)_10_AF376746)
Fig. 2
Fig. 2
Resistome clustering in sewage samples across regions. a Principal coordinate analysis (PCoA) performed on the resistome Bray–Curtis dissimilarity matrix. The amount of variation explained by coordinates 1 and 2 is included in the axis labels. b Antimicrobial resistance class-level heat map. Relative abundances of genes (fragments per kilo base per million fragments (FPKM)) were summed to drug classes (AmGlyc aminoglycoside, Mac macrolide, Oxa oxazolidinone, Phen phenicol, Quin quinolone). Colors represent log (ln) transformed relative abundances (FPKM). Complete-linkage clustering of Pearson correlation coefficients was used to hierarchically cluster both samples and drug classes
Fig. 3
Fig. 3
World Bank variables significantly associated with the observed antimicrobial resistance abundances. Detailed information concerning the variables in ar are presented in the same order in Supplementary Table 3
Fig. 4
Fig. 4
Global predictions of antimicrobial resistance (AMR) abundance in all countries and territories in the world. Map colored according to predicted abundance of AMR from light blue (low AMR abundance) to dark blue (high AMR abundance). Global resistance predictions for the 259 countries and territories are shown in Supplementary Data 5

References

    1. World Health Organization. Antimicrobial Resistance: Global Report on Surveillance. [https://apps.who.int/iris/bitstream/10665/112642/1/9789241564748_eng.pdf] (WHO Press, World Health Organization, Geneva, 2014).
    1. Aarestrup FM. The livestock reservoir for antimicrobial resistance: a personal view on changing patterns of risks, effects of interventions and the way forward. Philos. Trans. R. Soc. Lond. B Biol. Sci. 2015;370:20140085. doi: 10.1098/rstb.2014.0085. - DOI - PMC - PubMed
    1. Zignol M, et al. Twenty years of global surveillance of antituberculosis-drug resistance. N. Engl. J. Med. 2016;375:1081–1089. doi: 10.1056/NEJMsr1512438. - DOI - PubMed
    1. Weston, E. J., Wi, T. & Papp, J. Strengthening global surveillance for antimicrobial drug–resistant Neisseria gonorrhoeae through the Enhanced Gonococcal Antimicrobial Surveillance Program. Emerg. Infect. Dis. 23, 10.3201/eid2313.170443 (2017). - PMC - PubMed
    1. Hay SI, et al. Measuring and mapping the global burden of antimicrobial resistance. BMC Med. 2018;16:78. doi: 10.1186/s12916-018-1073-z. - DOI - PMC - PubMed

Publication types

MeSH terms

Cite

AltStyle によって変換されたページ (->オリジナル) /