This site needs JavaScript to work properly. Please enable it to take advantage of the complete set of features!
Skip to main page content
U.S. flag

An official website of the United States government

Dot gov

The .gov means it’s official.
Federal government websites often end in .gov or .mil. Before sharing sensitive information, make sure you’re on a federal government site.

Https

The site is secure.
The https:// ensures that you are connecting to the official website and that any information you provide is encrypted and transmitted securely.

NIH NLM Logo
Log in
Access keys NCBI Homepage MyNCBI Homepage Main Content Main Navigation
. 2019 Jan 24;9(1):762.
doi: 10.1038/s41598-018-37144-y.

Impaired activation of lesional CD8+ T-cells is associated with enhanced expression of Programmed Death-1 in Indian Post Kala-azar Dermal Leishmaniasis

Affiliations

Impaired activation of lesional CD8+ T-cells is associated with enhanced expression of Programmed Death-1 in Indian Post Kala-azar Dermal Leishmaniasis

Shibabrata Mukherjee et al. Sci Rep. .

Erratum in

Abstract

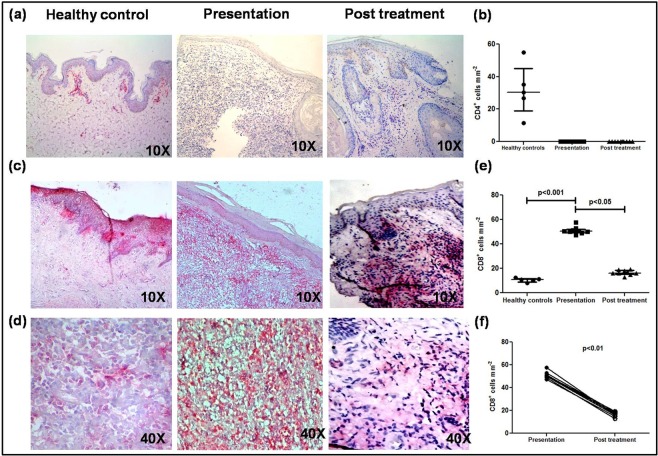
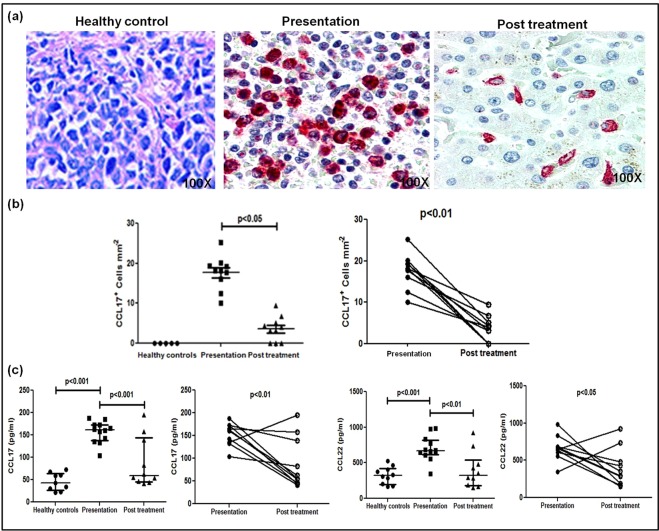
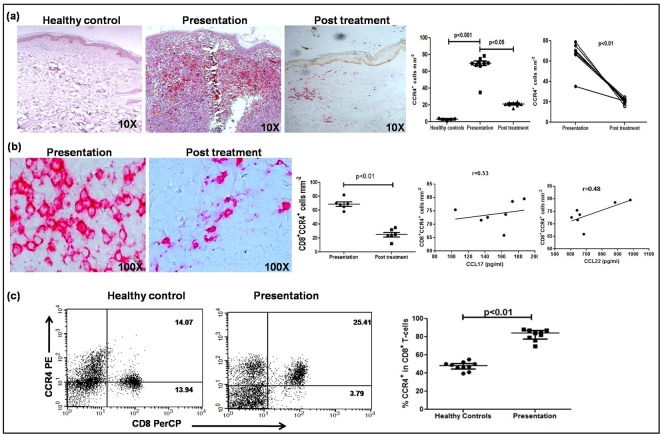
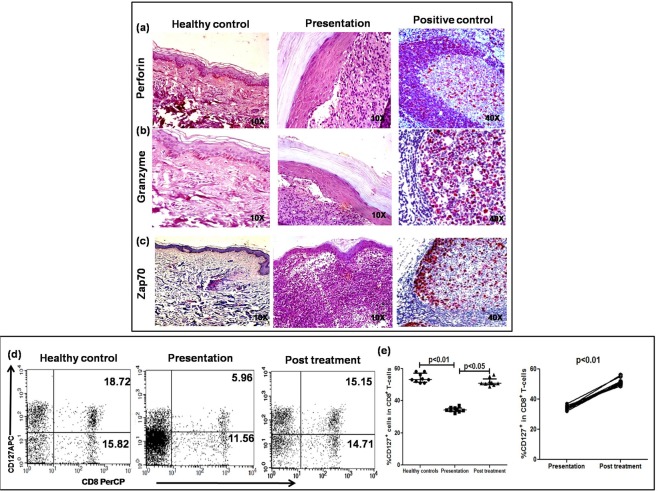
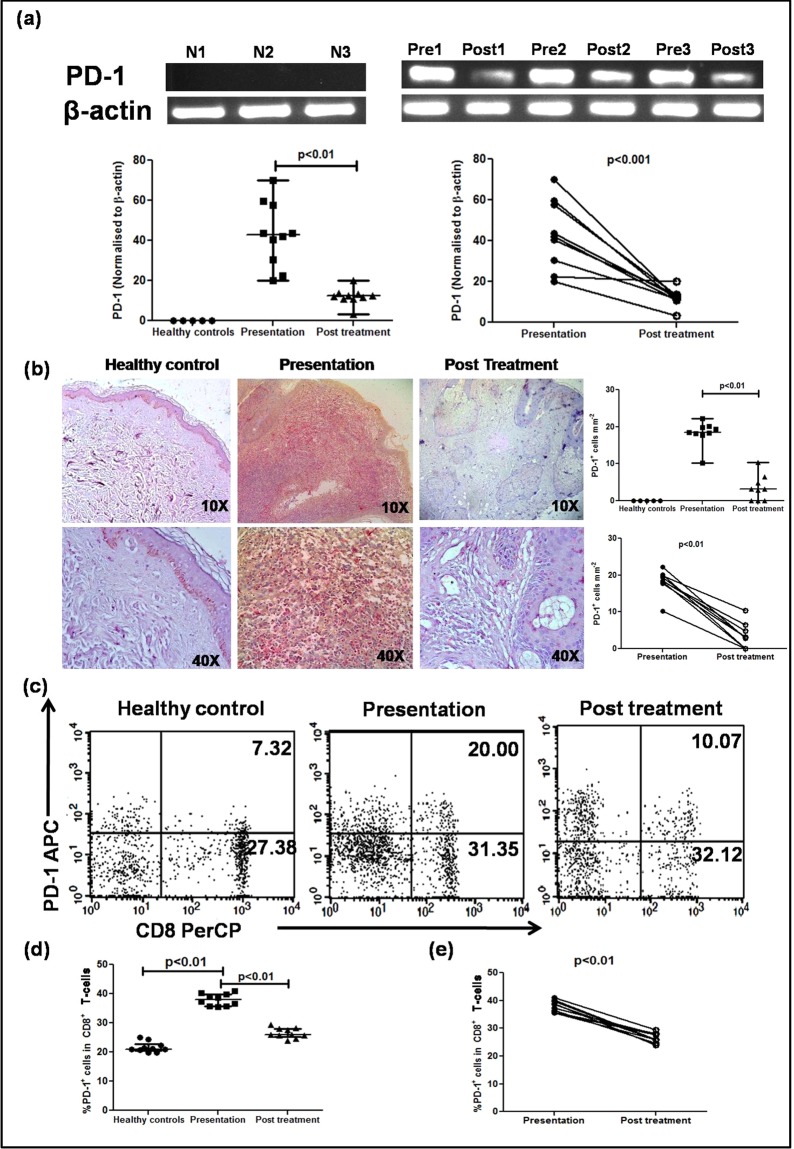
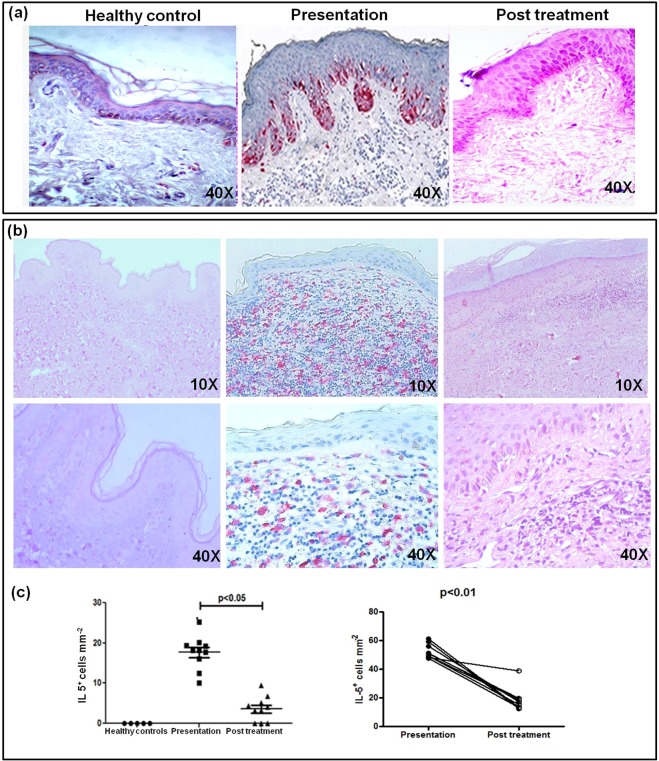
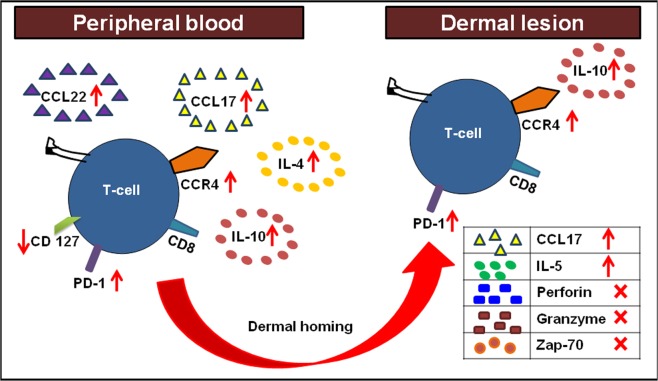
Post Kala-azar dermal leishmaniasis (PKDL), caused by Leishmania donovani is the dermal sequel of Visceral Leishmaniasis and importantly, is the proposed disease reservoir. The survival of Leishmania parasites within monocytes/macrophages hinges on its ability to effectively nullify immune activation mechanisms. Thus, delineating the disease-promoting immune mechanisms can facilitate development of immunotherapeutic strategies. Accordingly, in the absence of an animal model, this study aimed to delineate the status of CD8+ T-cells in patients with PKDL. At disease presentation, the absence of CD4+ T-cells at lesional sites was concomitant with an overwhelming infiltration of CD8+ T-cells that demonstrated an absence of Perforin, Granzyme and Zap-70, along with an enhanced expression of Programmed Death-1 (PD-1) and the skin-homing CCL17. Additionally, the lesional CCR4+CD8+ population was associated with an enhanced expression of IL-10 and IL-5. In circulation, the enhanced CD8+CCR4+ T-cell population and raised levels of CCL17/22 was associated with an increased frequency of PD-1, while CD127 was decreased. Taken together, in PKDL, the enhanced plasma and lesional CCL17 accounted for the dermal homing of CD8+CCR4+ T-cells, that along with a concomitant upregulation of PD-1 and IL-10 mediated immune inactivation, emphasizing the need for designing immunotherapies capable of reinvigorating T-cell potency.


Conflict of interest statement

The authors declare no competing interests.

Figures

Figure 1
Figure 1
Distribution of T-cells in dermal lesions of patients with PKDL. (a) Representative immunohistochemical profiles of CD4+ T-cells from dermal biopsies of a healthy control, patient with PKDL and post treatment (10X magnification). (b) Scatter plots of CD4+ T-cells in dermal biopsies of healthy controls (くろまる, n = 5) patients with PKDL (しかく, n = 10) and post treatment (さんかく, n = 10). Each horizontal bar represents the median value. (c,d) Representative immunohistochemical profiles of CD8+ T-cells from dermal biopsies of a healthy control, patient with PKDL and post treatment (10X and 40X magnification). (e) Scatter plots of CD8+ T-cells in dermal biopsies of healthy controls (くろまる, n = 5) patients with PKDL (しかく, n = 9) and post treatment (さんかく, n = 9). Each horizontal bar represents the median value. (f) Before (くろまる) and after (しろまる) treatment plots of CD8+ T-cells.
Figure 2
Figure 2
Dermal homing of CD8+ T-cells in patients with PKDL. (a) Representative immunohistochemical profiles of CCL17+ cells from dermal biopsies of a healthy control, patient with PKDL and post treatment (100X magnification). (b) Scatter plots showing the status of dermal CCL17+ cells in healthy controls (くろまる, n = 5), patients with PKDL at presentation (しかく, n = 10), and post treatment (さんかく, n = 10), along with before (くろまる) and after (しろまる) treatment plots. Each horizontal bar represents the median value. (c) Scatter plots showing plasma levels of CCL17 and CCL22 in healthy controls (くろまる, n = 9 for CCL17, n = 10 for CCL22), patients with PKDL (しかく, n = 12), and post treatment (さんかく, n = 10); each horizontal bar represents the median value. Before (くろまる) and after (しろまる) treatment plots of CCL17 and CCL22.
Figure 3
Figure 3
Status of Chemokine Receptor 4 (CCR4) in CD8+ T-cells in patients with PKDL. (a) Representative immunohistochemical profiles of CCR4+ T-cells from dermal biopsies of a healthy control, patient with PKDL and post treatment (10X magnification). Scatter plots showing the status of dermal CCR4+ cells in healthy controls (くろまる, n = 5), patients with PKDL (しかく, n = 9), and post treatment (さんかく, n = 9), along with before (くろまる) and after (しろまる) treatment plots. Each horizontal bar represents the median value. (b) Representative immunohistochemical profiles of CD8+CCR4+ T-cells from dermal biopsies of a patient with PKDL and post treatment (100X magnification); in the co-localization stain, red denotes the CD8 staining and brown denotes the CCR4 stain, along with scatter plots of CD8+CCR4+T-cells at disease presentation (くろまる, n = 6) and post treatment (しかく, n = 6). Each horizontal bar represents the median value. Correlation of CD8+CCR4+ T-cells with plasma levels of CCL 17 and CCL 22 respectively. (c) Representative quadrant plots of CD8+CCR4+ T-cells in peripheral blood of a healthy control and a patient with PKDL. Scatter plot of CCR4+ cells in CD8+ T-cells of healthy controls (くろまる, n = 10) and at disease presentation (しかく, n = 10). The proportion of CCR4+ cells in the entire CD8+ population was calculated by dividing the percentages of upper right quadrant by the sum of the upper and lower right quadrant. Each horizontal bar represents the median value.
Figure 4
Figure 4
Activation status of lesional and peripheral CD8+ T-cells in patients with PKDL. (a–c) Representative immunohistochemical profiles of Perforin (a), Granzyme (b) and Zap70 (c) in dermal biopsies of a healthy control, patient with PKDL (10X magnification); a reactive lymph node served as the positive control (40X magnification). (d) Representative quadrant plots indicating frequency (%) of CD127+ within CD8+ T-cells in peripheral blood of a healthy control, patient with PKDL and post treatment. (e) Scatter plots showing frequency (%) of CD127+ within CD8+ T-cells of healthy controls (くろまる, n = 9), patients with PKDL (しかく, n = 10) and post treatment (さんかく, n = 9). The proportion of CD127+ within the entire CD8+ population was calculated by dividing the percentages of upper right quadrant by the sum of upper and lower right quadrant. Each horizontal bar represents the median value. Before (くろまる) and after (しろまる) treatment plots of CD127+ in CD8+ T-cells in patients with PKDL.
Figure 5
Figure 5
Presence of Programmed Death-1 (PD-1) in dermal lesions and circulation of patients with PKDL. (a) Representative mRNA expression profiles of PD-1 (cropped from original gel images, full-length gels are presented in Supplementary Fig. S6) in dermal biopsies of healthy controls (N1–3), patients with PKDL (Pre1–3) and post treatment (Post1–3). Scatter plots of PD-1 in healthy controls (くろまる, n = 5), at disease presentation (しかく, n = 10) and post treatment (さんかく, n = 10). Each horizontal bar represents the median value. Before (くろまる) and after (しろまる) treatment plots of PD-1. (b) Representative immunohistochemical profiles of PD-1+ cells from dermal biopsies of a healthy control, patient with PKDL and post treatment (10X and 40X magnification). Scatter plots of PD-1+ cells in dermal biopsies of healthy controls (くろまる, n = 5) patients with PKDL (しかく, n = 9) and post treatment (さんかく, n = 9). Each horizontal bar represents the median value. Before (くろまる) and after treatment (しろまる) plots of PD-1+ cells. (c) Representative quadrant plots indicating the frequency (%) of PD-1+ within CD8+ T-cells in peripheral blood of a healthy control, patient with PKDL and post treatment. (d) Scatter plots of PD-1+ in CD8+ T-cells of healthy controls (くろまる, n = 10), at disease presentation (しかく, n = 10) and post treatment (さんかく, n = 10). Each horizontal bar represents the median value. The proportion of PD-1+ in the entire CD8+ population was calculated by dividing percentages of the upper right quadrant by the sum of upper and lower right quadrant. (e) Before (くろまる) and after treatment (しろまる) plots of PD-1+ in CD8+ T-cells.
Figure 6
Figure 6
Distribution of IL-10 and IL-5 in dermal lesions of patients with PKDL. (a) Representative immunohistochemical profiles of IL-10 from dermal biopsies of a healthy control, a patient with PKDL and post treatment (40X magnification). (b) Representative immunohistochemical profiles of IL-5 from dermal biopsies of a healthy control, a patient with PKDL and post treatment (10X and 40X magnification). (c) Scatter plots showing distribution of IL-5+ cells in healthy controls (くろまる, n = 5), at disease presentation (しかく, n = 10) and post treatment (さんかく, n = 10). Each horizontal bar represents the median value. Before (くろまる) and after (しろまる) treatment plots of IL-5+ cells.
Figure 7
Figure 7
Cellular interactions between peripheral blood and dermal lesions in patients with PKDL. In patients with PKDL, the increased presence of CCL17/22 upon interaction with CCR4 paved the way for homing of CD8+ T-cells to the dermal lesional sites. These CD8+ T-cells showed exhaustion as confirmed by the increased presence of PD-1 in peripheral blood and dermal lesions, which benefitted from the milieu generated by the increased presence of IL-4/IL-5 and IL-10.

References

    1. Ganguly S, Das NK, Barbhuiya JN, Chatterjee M. Post-kala-azar dermal leishmaniasis-an overview. Int J Dermatol. 2010;49:921–931. doi: 10.1111/j.1365-4632.2010.04558.x. - DOI - PubMed
    1. Zijlstra EE, Musa AM, Khalil EA, el-Hassan IM, el-Hassan AM. Post kala-azar dermal leishmaniasis. Lancet Infect Dis. 2003;3:87–98. doi: 10.1016/S1473-3099(03)00517-6. - DOI - PubMed
    1. Ramesh V, Kaushal H, Mishra AK, Singh R, Salotra P. Clinico-epidemiological analysis of Post kala-azar dermal leishmaniasis (PKDL) cases in India over last two decades: a hospital based retrospective study. BMC Public Health. 2015;15:1092. doi: 10.1186/s12889-015-2424-8. - DOI - PMC - PubMed
    1. Zijlstra EE, Khalil EA, Kager PA, El-Hassan AM. Post-kala-azar dermal leishmaniasis in the Sudan: clinical presentation and differential diagnosis. Br J Dermatol. 2000;143:136–143. doi: 10.1046/j.1365-2133.2000.03603.x. - DOI - PubMed
    1. Bhattacharya SK, Dash AP. Elimination of Kala-Azar from the Southeast Asia Region. Am J Trop Med Hyg. 2017;96:802–804. - PMC - PubMed

Publication types

MeSH terms

Cite

AltStyle によって変換されたページ (->オリジナル) /