This site needs JavaScript to work properly. Please enable it to take advantage of the complete set of features!
Skip to main page content
U.S. flag

An official website of the United States government

Dot gov

The .gov means it’s official.
Federal government websites often end in .gov or .mil. Before sharing sensitive information, make sure you’re on a federal government site.

Https

The site is secure.
The https:// ensures that you are connecting to the official website and that any information you provide is encrypted and transmitted securely.

NIH NLM Logo
Log in
Access keys NCBI Homepage MyNCBI Homepage Main Content Main Navigation
. 2019 Oct 22;220(11):1738-1749.
doi: 10.1093/infdis/jiz016.

Genomic Analysis of Plasmodium vivax in Southern Ethiopia Reveals Selective Pressures in Multiple Parasite Mechanisms

Affiliations

Genomic Analysis of Plasmodium vivax in Southern Ethiopia Reveals Selective Pressures in Multiple Parasite Mechanisms

Sarah Auburn et al. J Infect Dis. .

Abstract

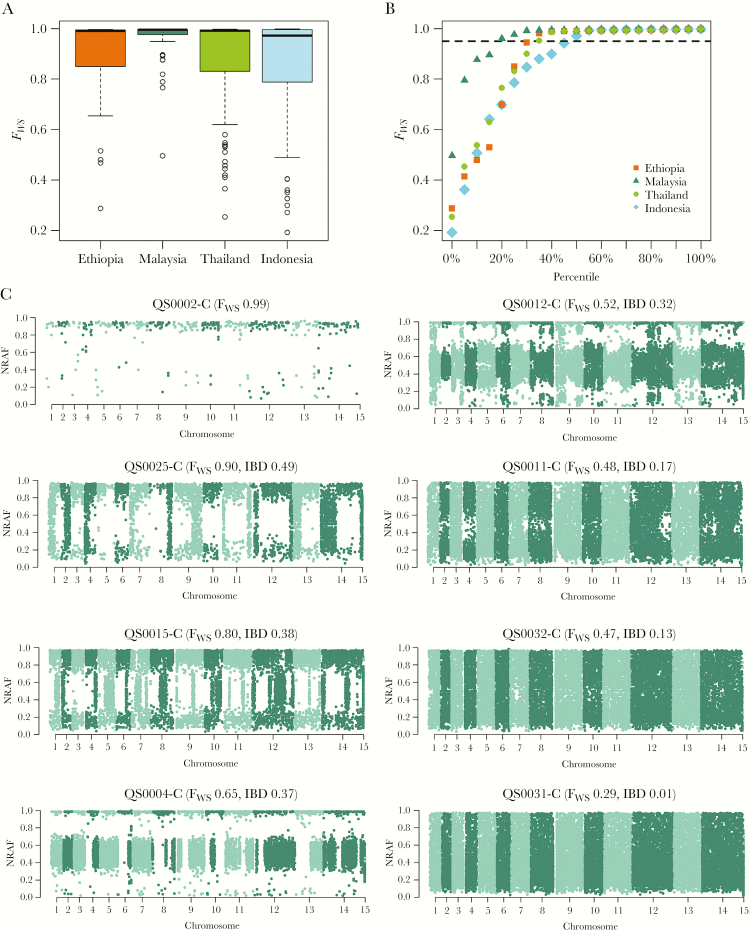
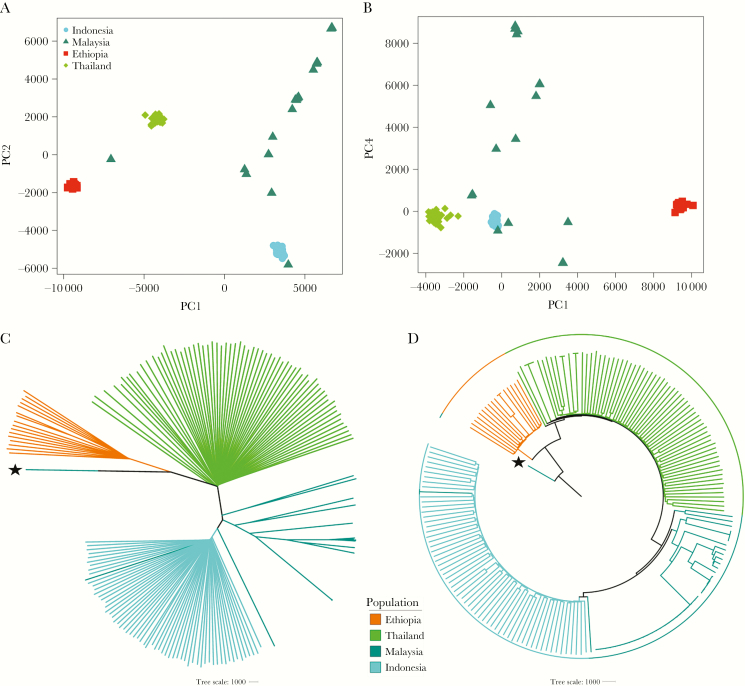
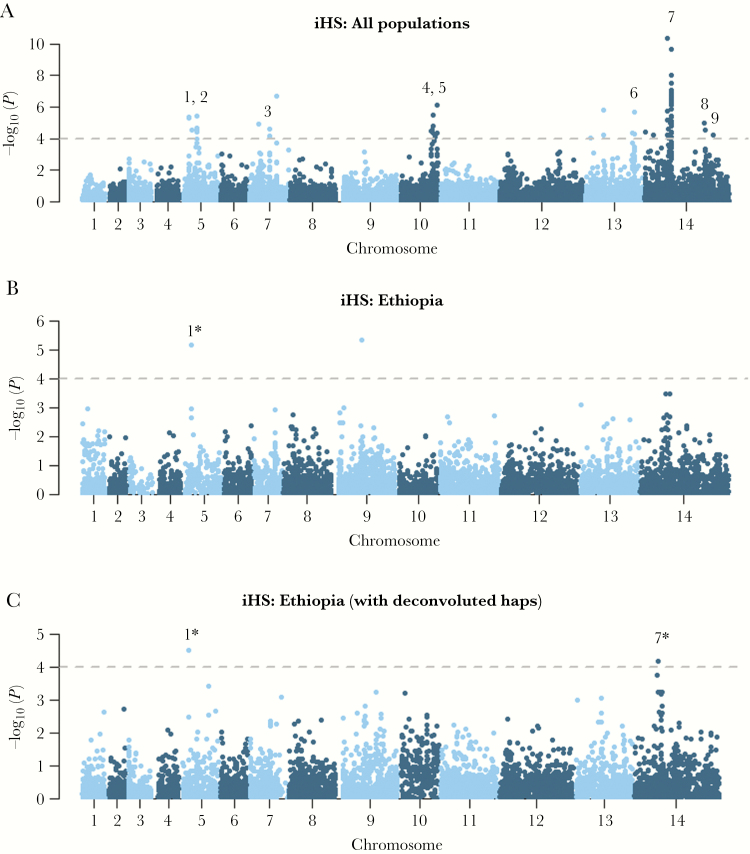
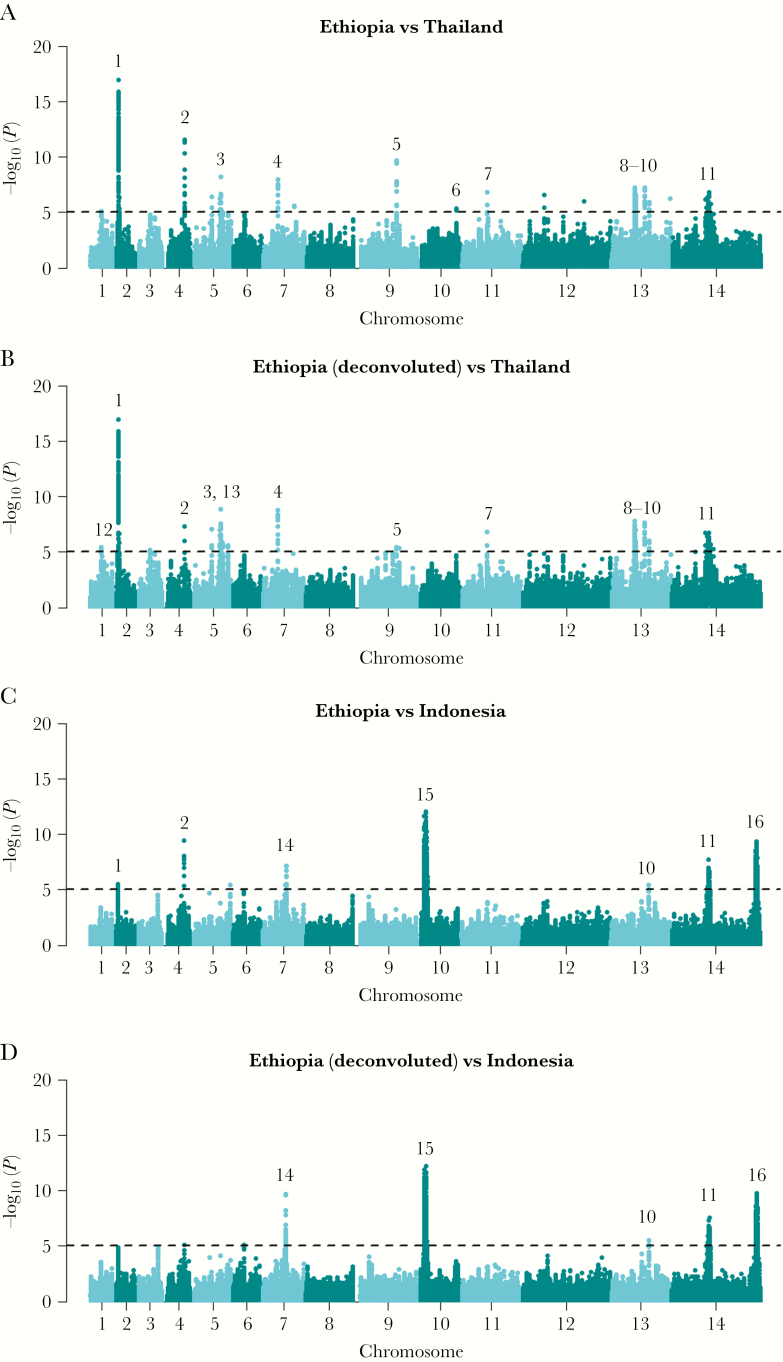
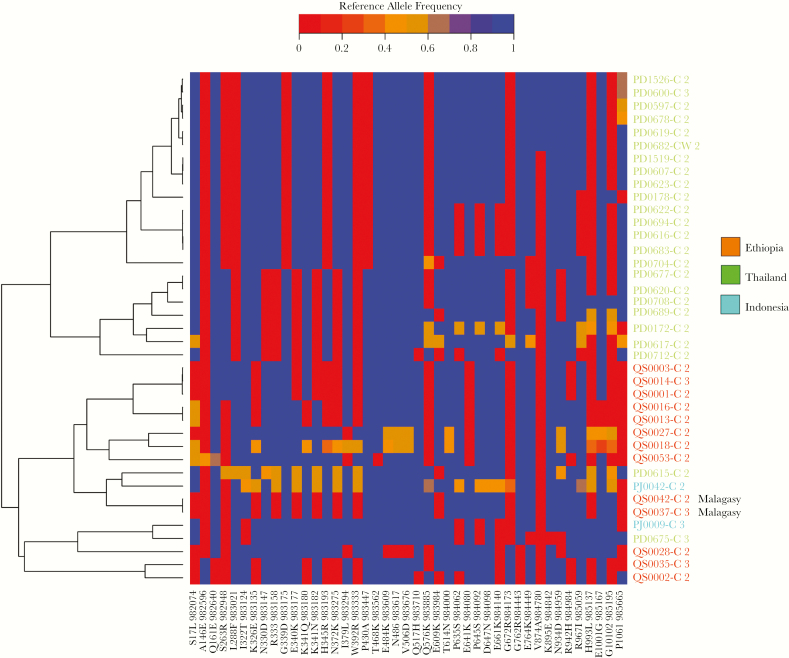
The Horn of Africa harbors the largest reservoir of Plasmodium vivax in the continent. Most of sub-Saharan Africa has remained relatively vivax-free due to a high prevalence of the human Duffy-negative trait, but the emergence of strains able to invade Duffy-negative reticulocytes poses a major public health threat. We undertook the first population genomic investigation of P. vivax from the region, comparing the genomes of 24 Ethiopian isolates against data from Southeast Asia to identify important local adaptions. The prevalence of the Duffy binding protein amplification in Ethiopia was 79%, potentially reflecting adaptation to Duffy negativity. There was also evidence of selection in a region upstream of the chloroquine resistance transporter, a putative chloroquine-resistance determinant. Strong signals of selection were observed in genes involved in immune evasion and regulation of gene expression, highlighting the need for a multifaceted intervention approach to combat P. vivax in the region.

Keywords: Plasmodium; Duffy; Ethiopia; genomics; malaria; vivax.


Figures

Figure 1.
Figure 1.
Within-sample infection complexity in Ethiopia relative to the Southeast Asian populations and within polyclonal Ethiopian infections. The boxplots (A) and scatterplots (B) illustrate the distribution of within-sample F statistic (FWS) scores in Ethiopia relative to Thailand, Indonesia, and Malaysia. Data are presented on all 293 high-quality samples. B, Dashed line illustrates FWS = 0.95, above which infections are essentially monoclonal. Ethiopia exhibits an intermediate proportion of monoclonal infections relative to Malaysia and Indonesia, most comparable to Thailand. C, Manhattan plots of the nonreference allele frequency (NRAF) in 7 Ethiopian infections identified as polyclonal based on FWS < 0.95, and 1 monoclonal infection as a baseline reference (QS0002-C). Trends in the pairwise identity by descent (IBD) between clones in a given infection (as determined by DEploid-IBD) correlated positively with the FWS scores and approximated runs of homozygosity (RoH, not presented). DEploid-IBD found evidence of 2 major clones in QS0025-C, QS0015-C, and QS0004-C, and 3 clones in QS0012-C, QS0011-C, QS0032-C, and QS0031-C. The clones within QS0025-C demonstrated the highest pairwise IBD (0.49), indicative of siblings sharing approximately 50% of their genomes, as illustrated by the long stretches of homology (regions with NRAF approximating 0 or 1) on each chromosome. In striking contrast, the clones within QS0031-C exhibited the lowest pairwise IBD (<0.01%), with no evidence of recent common ancestry, rather reflecting a probable superinfection.
Figure 2.
Figure 2.
Plasmodium vivax population structure and relatedness in Ethiopia relative to the Asian populations. All plots were generated using genomic data derived from 191 high-quality, monoclonal (within-sample F statistic [FWS] > 0.95) samples. A and B, Principal coordinates analysis plots illustrating the genetic differentiation within and between populations, respectively. Principal components (PC) 1–4 reflect 16.8%, 10.8%, 9%, and 2.9% of the variance, respectively. C and D, Unrooted and rooted neighbor-joining trees, respectively. The rooted tree is presented to illustrate similarity between infections in a given population rather than evolutionary patterns. The PY0120-C isolate from Malaysia, labeled with a star, was used as the ancestral sample; this sample is a suspected imported case that has been shown to have close identity with infections from India and Bangladesh (data not presented).
Figure 3.
Figure 3.
Genome-wide scans of extended haplotype homozygosity using the integrated haplotype score (iHS) illustrating regions under recent directional selection in Ethiopia and across populations. Manhattan plots of the iHS P value for the given populations: all monoclonal (within-sample F statistic [FWS] > 0.95) samples from Ethiopia, Thailand, and Indonesia (A), all monoclonal (FWS > 0.95) samples from Ethiopia (B), and all monoclonal (FWS > 0.95) samples from Ethiopia plus the 7 major haplotypes derived from polyclonal Ethiopian isolates that were deconvoluted (C) using DEploid identity by descent (IBD) software. Data are presented on 260 982 loci for which derived alleles could be confidently called. The dashed black lines demark the thresholds of –log10 (P value) > 4: signals supported by a minimum of 3 single-nucleotide polymorphisms (SNPs) above the threshold within 50 kb of one another and with an overall SNP density <10 kb per SNP are numbered. Details can be found in Supplementary Data 4. In brief, the putative genetic drivers include an SPRY domain protein (PVP01_0508000) (signal 1), 3 conserved proteins with unknown function (PVP01_0515000, PVP01_1029200, and PVP01_1455300) (signals 2, 4, and 9 respectively), gamma-glutamylcysteine synthetase (PVP01_0717300), an AP2 domain transcription factor (PVP01_1418100) or ferredoxin (PVP01_1419000) (signal 7), and an amino acid transporter (PVP01_1449600) (signal 8). The driver in the 92-kb region on chromosome 13 (signal 6) remains unclear. *Signals were supported by a minimum of 3 SNPs above the threshold in the population-wide data but only 1 SNP in Ethiopia.
Figure 4.
Figure 4.
Genome-wide scans of Rsb-based cross-population extended haplotype homozygosity illustrating regions under divergent selection between Ethiopia and Thailand and Indonesia. A–D, Manhattan plots of the Rsb P value for the given populations. The dashed black lines demark the thresholds of –log10 (P value) > 5: signals supported by a minimum of 3 single-nucleotide polymorphisms (SNPs) above the threshold within 50 kb of one another and with an overall SNP density <10 kb per SNP are numbered. The multi-SNP signals are detailed in Supplementary Data 4. Several previously described signals in known or putative drug resistance candidates were identified including MRP1 (signal 1), DHFR (signal 3), and DHPS (signal 11). Signals were also observed in regions upstream of CRT (signal 12) and MDR1 (signal 15). The putative genetic drivers in other regions include MSP5 (signal 2), a tRNA (signal 4), AMA1 (signal 5), a merozoite surface protein 3 family cluster (signal 6), a voltage-dependent anion-selective channel (signal 8), liver-specific protein 1 (signal 10), and an AP2 domain transcription factor (signal 13). The putative genetic drivers in regions 14 and 16 are conserved Plasmodium proteins with unknown function, and those in regions 7 and 9 remain unclear.
Figure 5.
Figure 5.
Heatplot illustrating multiple Duffy binding protein 1 (DBP1) haplotypes between samples and divergence between DBP1 copies within samples in monoclonal infections with copy number amplifications. The heat plot presents color-coded genotype calls at single-nucleotide polymorphisms in the DBP1 gene with minor allele frequency ≥1%. Genotypes are presented as reference allele frequencies ranging from 0 in red (homozygote alternative allele) to 1 in blue (homozygote reference allele). Samples are ordered on the y-axis according to their genetic relatedness as per the left-hand phylogram. Sample labels are color-coded according to country. Only monoclonal (within-sample F statistic > 0.95) infections with ≥2 DBP1 copies were included in the analyses. Therefore, heterozygous positions (in orange) reflect differences between the DBP1 copies within a given infection. Two Malagasy-type DBP1 amplifications are labeled; all other amplifications were Cambodian type.

Comment in

References

    1. Guerra CA, Howes RE, Patil AP, et al. . The international limits and population at risk of Plasmodium vivax transmission in 2009. PLoS Negl Trop Dis 2010; 4:e774. - PMC - PubMed
    1. Sattabongkot J, Tsuboi T, Zollner GE, Sirichaisinthop J, Cui L. Plasmodium vivax transmission: chances for control? Trends Parasitol 2004; 20:192–8. - PubMed
    1. Hupalo DN, Luo Z, Melnikov A, et al. . Population genomics studies identify signatures of global dispersal and drug resistance in Plasmodium vivax. Nat Genet 2016; 48:953–8. - PMC - PubMed
    1. Neafsey DE, Galinsky K, Jiang RH, et al. . The malaria parasite Plasmodium vivax exhibits greater genetic diversity than Plasmodium falciparum. Nat Genet 2012; 44:1046–50. - PMC - PubMed
    1. Pearson RD, Amato R, Auburn S, et al. . Genomic analysis of local variation and recent evolution in Plasmodium vivax. Nat Genet 2016; 48:959–64. - PMC - PubMed

Publication types

Cite

AltStyle によって変換されたページ (->オリジナル) /