This site needs JavaScript to work properly. Please enable it to take advantage of the complete set of features!
Skip to main page content
U.S. flag

An official website of the United States government

Dot gov

The .gov means it’s official.
Federal government websites often end in .gov or .mil. Before sharing sensitive information, make sure you’re on a federal government site.

Https

The site is secure.
The https:// ensures that you are connecting to the official website and that any information you provide is encrypted and transmitted securely.

NIH NLM Logo
Log in
Access keys NCBI Homepage MyNCBI Homepage Main Content Main Navigation
. 2019 Jan 14;16(1):1.
doi: 10.1186/s12976-018-0097-6.

Assessing parameter identifiability in compartmental dynamic models using a computational approach: application to infectious disease transmission models

Affiliations

Assessing parameter identifiability in compartmental dynamic models using a computational approach: application to infectious disease transmission models

Kimberlyn Roosa et al. Theor Biol Med Model. .

Abstract

Background: Mathematical modeling is now frequently used in outbreak investigations to understand underlying mechanisms of infectious disease dynamics, assess patterns in epidemiological data, and forecast the trajectory of epidemics. However, the successful application of mathematical models to guide public health interventions lies in the ability to reliably estimate model parameters and their corresponding uncertainty. Here, we present and illustrate a simple computational method for assessing parameter identifiability in compartmental epidemic models.

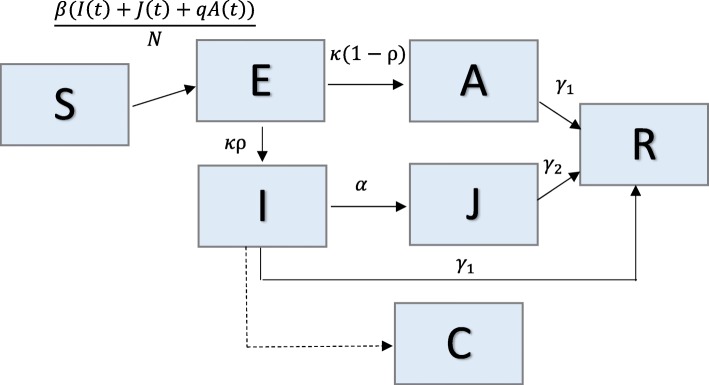
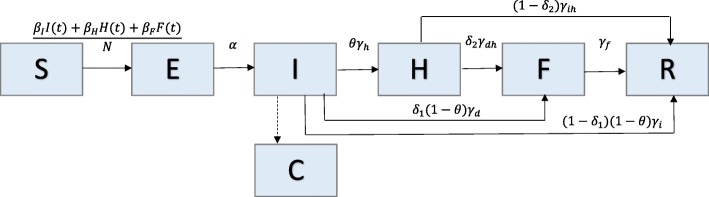
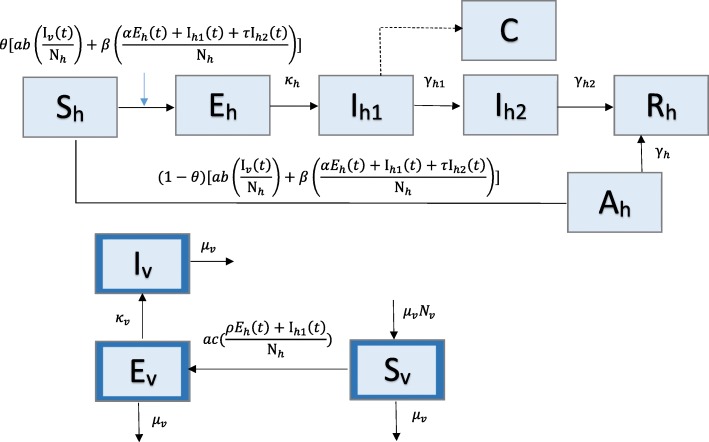
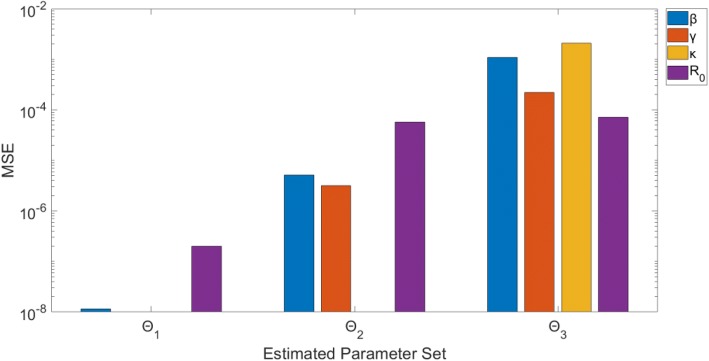
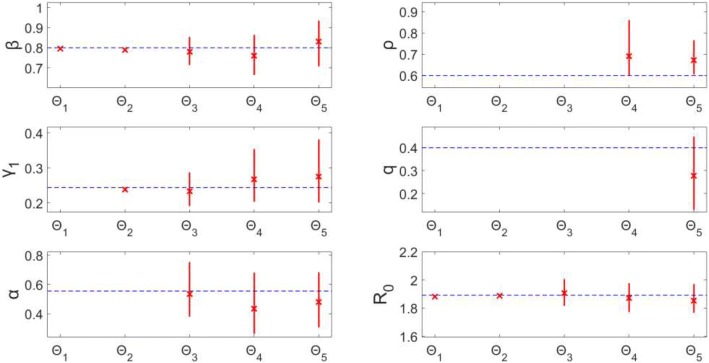
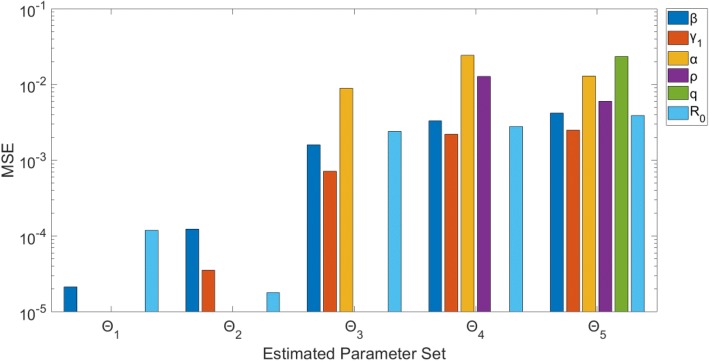
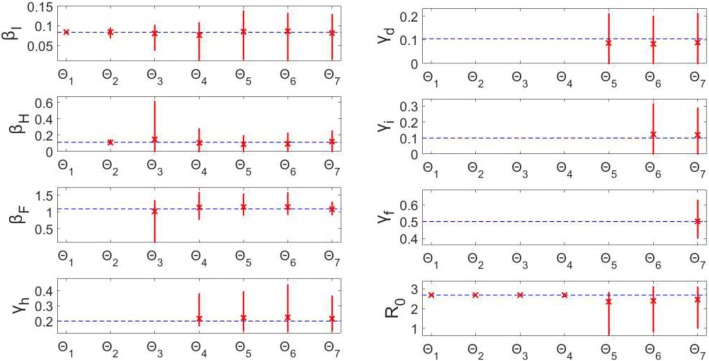
Methods: We describe a parametric bootstrap approach to generate simulated data from dynamical systems to quantify parameter uncertainty and identifiability. We calculate confidence intervals and mean squared error of estimated parameter distributions to assess parameter identifiability. To demonstrate this approach, we begin with a low-complexity SEIR model and work through examples of increasingly more complex compartmental models that correspond with applications to pandemic influenza, Ebola, and Zika.

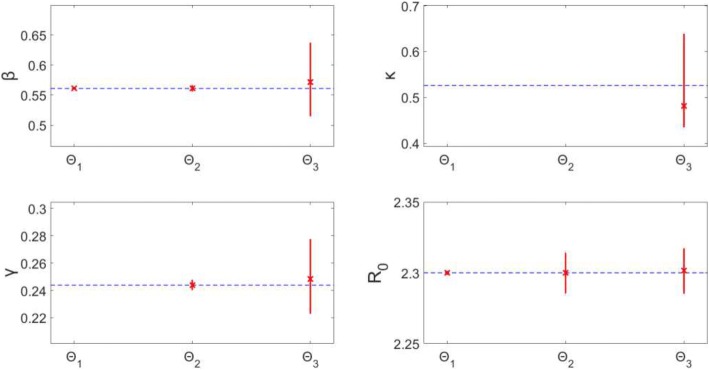
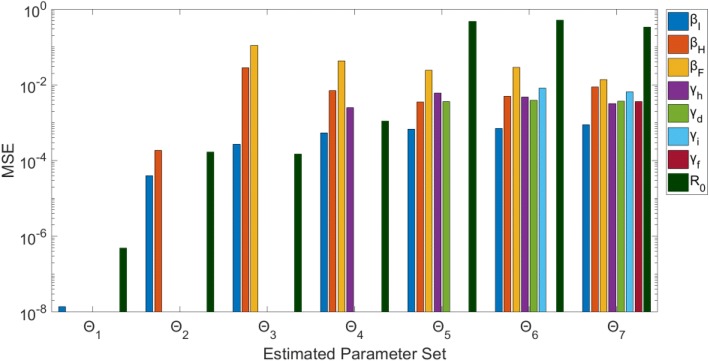
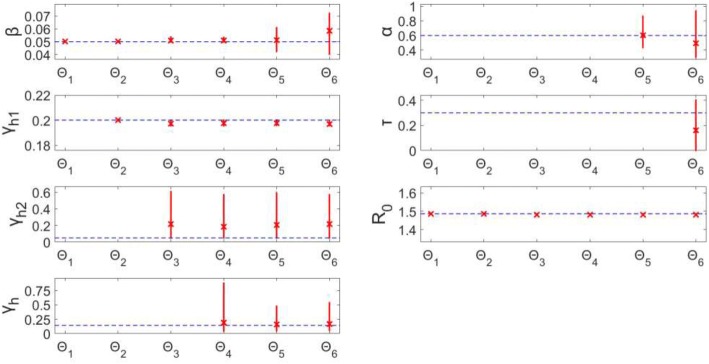
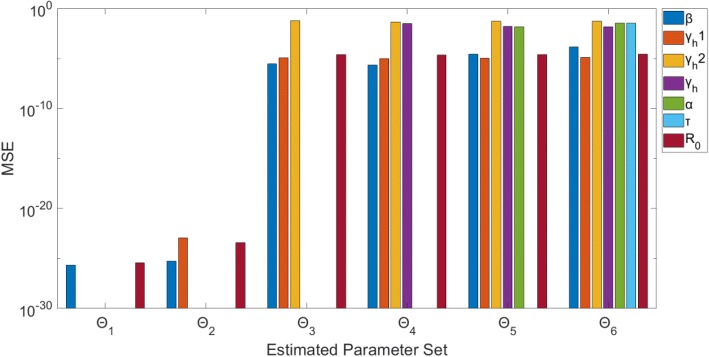
Results: Overall, parameter identifiability issues are more likely to arise with more complex models (based on number of equations/states and parameters). As the number of parameters being jointly estimated increases, the uncertainty surrounding estimated parameters tends to increase, on average, as well. We found that, in most cases, R0 is often robust to parameter identifiability issues affecting individual parameters in the model. Despite large confidence intervals and higher mean squared error of other individual model parameters, R0 can still be estimated with precision and accuracy.

Conclusions: Because public health policies can be influenced by results of mathematical modeling studies, it is important to conduct parameter identifiability analyses prior to fitting the models to available data and to report parameter estimates with quantified uncertainty. The method described is helpful in these regards and enhances the essential toolkit for conducting model-based inferences using compartmental dynamic models.

Keywords: Compartmental models; Epidemic models; Parameter identifiability; Practical parameter identifiability; Structural parameter identifiability; Uncertainty quantification.


Conflict of interest statement

Ethics approval and consent to participate

All of the data employed in this study were generated through simulations. Data are deemed exempt from institutional review board assessment.

Consent for publication

Not applicable.

Competing interests

The authors declare that they have no competing interests.

Publisher’s Note

Springer Nature remains neutral with regard to jurisdictional claims in published maps and institutional affiliations.

Figures

Fig. 1
Fig. 1
Model 1: Simple SEIR – Population is divided into 4 classes: susceptible (S), exposed (E), infectious (I), and recovered/removed (R). Class C represents the auxiliary variable C (t) and tracks the cumulative number of infectious individuals from the start of the outbreak. This is presented as a dashed line, as it is not a state of the system of equations, but simply a class to track the cumulative incidence cases; meaning, individuals from the population are not moving to class C. Parameter(s) above arrows denote the rate individuals move between classes. Parameter descriptions and values are found in Table 1
Fig. 2
Fig. 2
Model 2: SEIR with asymptomatic and hospitalized/diagnosed and reported – Population is divided into 6 classes: susceptible (S), exposed (E), clinically ill and infectious (I), asymptomatic and partially infectious (A), hospitalized/diagnosed and reported (J), and recovered (R). Class C represents the auxiliary variable C(t) and tracks the cumulative number of newly infectious individuals. Parameter(s) above (or to the left of) arrows denote the rate individuals move between classes. Parameter descriptions and values are found in Table 2
Fig. 3
Fig. 3
Model 3: The Legrand et al. Model – Population is divided into 6 classes: susceptible (S), exposed (E), infectious in the community (I), infectious in the hospital (H), infectious after death at funeral (F), or recovered/removed (R). Class C represents the auxiliary variable C(t) and tracks the cumulative number of newly infectious individuals. Parameter(s) above arrows denote the rate that individuals move between classes. Parameter descriptions and values are found in Table 3
Fig. 4
Fig. 4
Model 4: Zika Model with human and mosquito populations – The human population (subscript h) is divided into 5 classes: susceptible (Sh), asymptomatically infected (Ah), exposed (Eh), symptomatically infectious (Ih1), convalescent (Ih2), or recovered (Rh). Class C represents the auxiliary variable C(t) and tracks the cumulative number of newly infectious individuals. The mosquito, or vector, population (subscript v; outlined in dark blue) is divided into 3 classes: susceptible (Sv), exposed (Ev), and infectious (Iv) classes. Parameter(s) above arrows denote the rate individuals/vectors move between classes. Parameter descriptions and values are found in Table 4
Fig. 5
Fig. 5
Model 1–95% confidence intervals (vertical red lines) for the distributions of each estimated parameter obtained from the 200 realizations of the simulated datasets. Mean estimated parameter value is denoted by a red x, and the true parameter value is represented by the blue dashed horizontal line. Θi denotes the estimated parameter set, where i indicates the number of parameters being jointly estimated
Fig. 6
Fig. 6
Model 1 – Mean squared error (MSE) of the distribution of parameter estimates (200 realizations) for each estimated parameter set Θi, where i indicates the number of parameters being jointly estimated. Note that the y-axis (MSE) is represented with a logarithmic scale
Fig. 7
Fig. 7
Model 2–95% confidence intervals (vertical red lines) for the parameter estimate distributions obtained from the 200 realizations of the simulated datasets. Mean estimated parameter value is denoted by red x, and the true parameter value is represented by the blue dashed horizontal line. Θi denotes the estimated parameter set, where i indicates the number of parameters being jointly estimated
Fig. 8
Fig. 8
Model 2 – Mean squared error (MSE) of the distribution of parameter estimates (200 realizations) for each estimated parameter set Θi, where i indicates the number of parameters being jointly estimated. Note that the y-axis (MSE) is represented with a logarithmic scale
Fig. 9
Fig. 9
Model 3–95% confidence intervals (vertical red lines) for the parameter estimate distributions obtained from the 200 realizations of the simulated datasets. Mean estimated parameter value is denoted by red x, and the true parameter value is represented by the blue horizontal line. Θi denotes the estimated parameter set, where i indicates the number of parameters being jointly estimated
Fig. 10
Fig. 10
Model 3 – Mean squared error (MSE) of the distribution of parameter estimates (200 realizations) for each estimated parameter set Θi, where i indicates the number of parameters being jointly estimated. Note that the y-axis (MSE) is represented with a logarithmic scale
Fig. 11
Fig. 11
Model 4–95% confidence intervals (vertical red lines) for the parameter estimate distributions obtained from the 200 realizations of the simulated datasets. Mean estimated parameter value is denoted by red x, and the true parameter value is represented by the blue horizontal line. Θi denotes the estimated parameter set, where i indicates the number of parameters being jointly estimated
Fig. 12
Fig. 12
Model 4 – Mean squared error (MSE) of the distribution of parameter estimates (200 realizations) for each estimated parameter set Θi, where i indicates the number of parameters being jointly estimated. Note that the y-axis (MSE) is represented with a logarithmic scale

References

    1. Anderson RM, May RM. Infectious diseases of humans: dynamics and control. Oxford: Oxford University Press; 1991.
    1. Diekmann O, Heesterbeek JA, Metz JA. On the definition and the computation of the basic reproduction ratio R0 in models for infectious diseases in heterogeneous populations. J Math Biol. 1990;28(4):365–382. doi: 10.1007/BF00178324. - DOI - PubMed
    1. Chowell G. Fitting dynamic models to epidemic outbreaks with quantified uncertainty: a primer for parameter uncertainty, identifiability, and forecasts. Infectious Disease Modelling. 2017;2:379–398. doi: 10.1016/j.idm.201708001. - DOI - PMC - PubMed
    1. He D, King A, King AA, Ionides EL. Plug-and-play inference for disease dynamics: measles in large and small populations as a case study. J R Soc Interface. 2010;7(43):271–283. doi: 10.1098/rsif.2009.0151. - DOI - PMC - PubMed
    1. Goeyvaerts N, Willem L, Van Kerckhove K, Vandendijck Y, Hanquet G, Beutels P, et al. Estimating dynamic transmission model parameters for seasonal influenza by fitting to age and season-specific influenza-like illness incidence. Epidemics. 2015;13:1–9. doi: 10.1016/j.epidem.201504002. - DOI - PubMed

Publication types

Cite

AltStyle によって変換されたページ (->オリジナル) /