This site needs JavaScript to work properly. Please enable it to take advantage of the complete set of features!
Skip to main page content
U.S. flag

An official website of the United States government

Dot gov

The .gov means it’s official.
Federal government websites often end in .gov or .mil. Before sharing sensitive information, make sure you’re on a federal government site.

Https

The site is secure.
The https:// ensures that you are connecting to the official website and that any information you provide is encrypted and transmitted securely.

NIH NLM Logo
Log in
Access keys NCBI Homepage MyNCBI Homepage Main Content Main Navigation
. 2018 Oct 18;3(20):e123467.
doi: 10.1172/jci.insight.123467.

Influenza-mediated reduction of lung epithelial ion channel activity leads to dysregulated pulmonary fluid homeostasis

Affiliations

Influenza-mediated reduction of lung epithelial ion channel activity leads to dysregulated pulmonary fluid homeostasis

Jeffrey D Brand et al. JCI Insight. .

Abstract

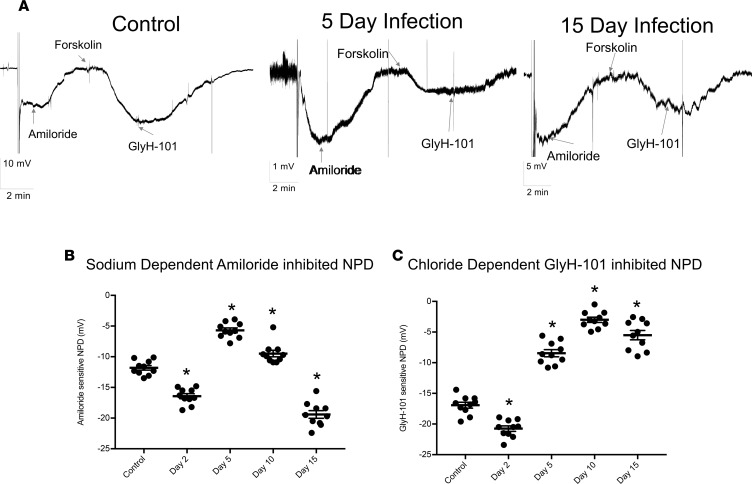
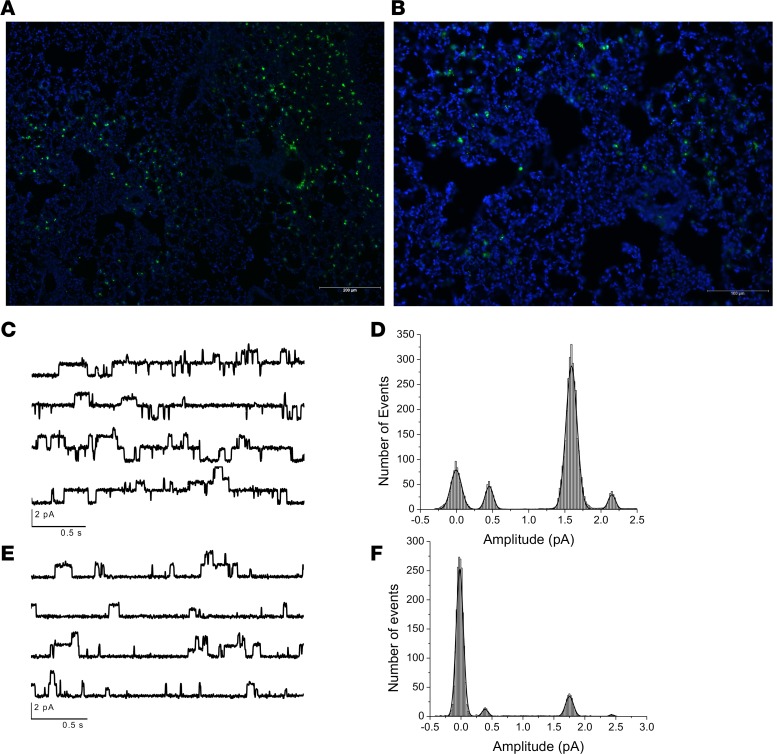
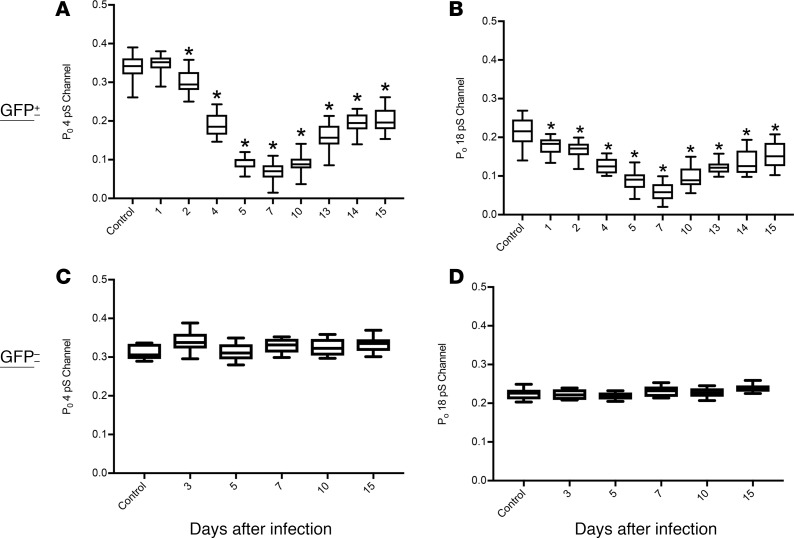
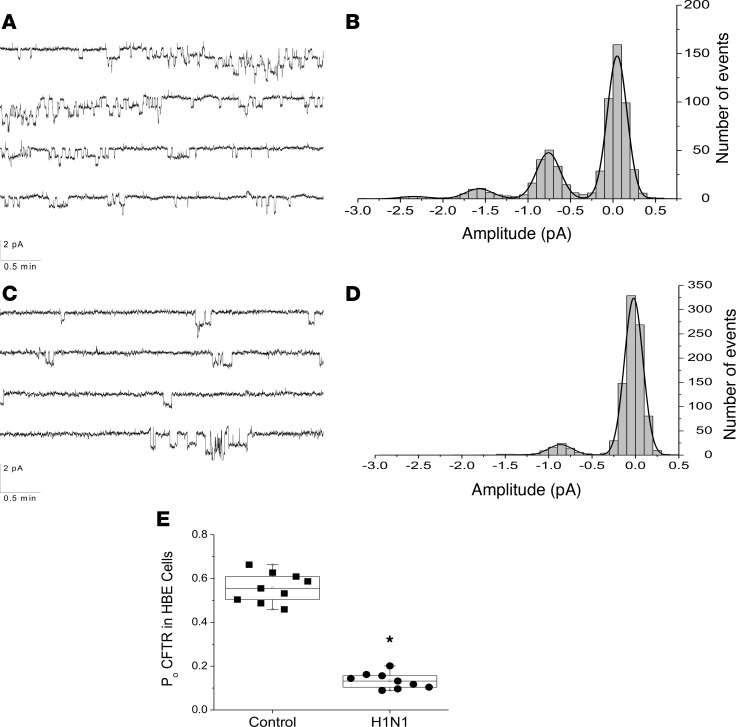
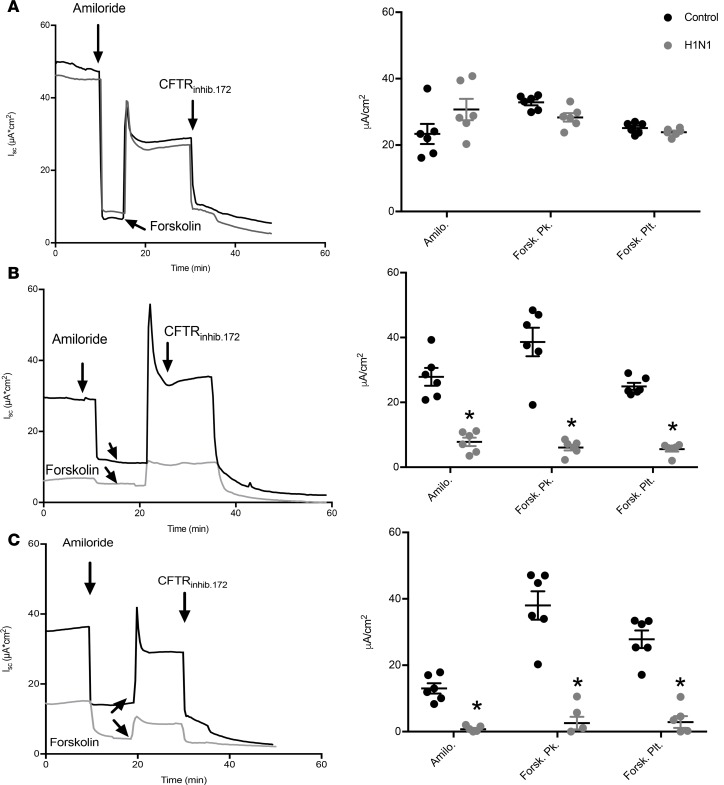
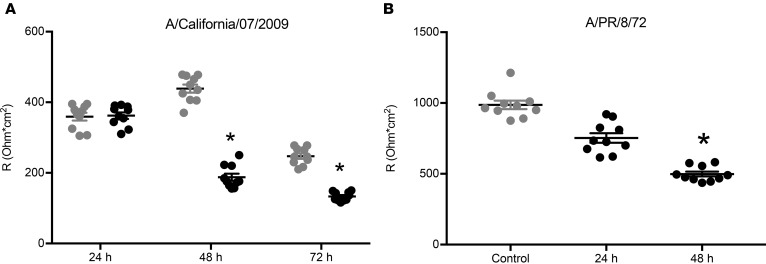
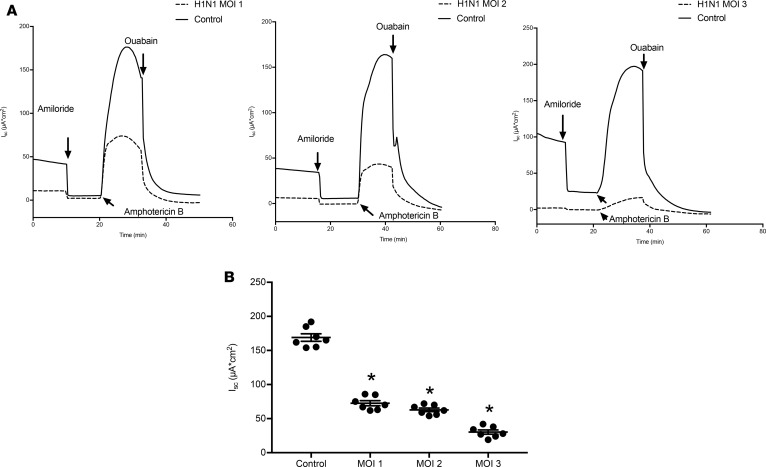
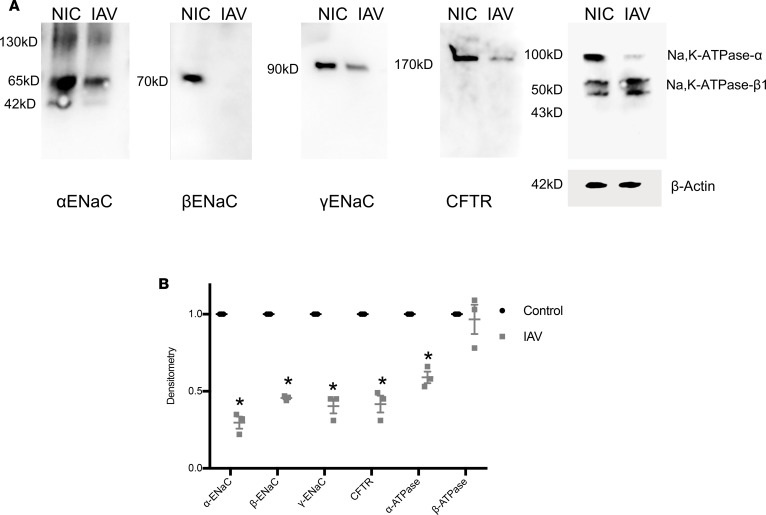
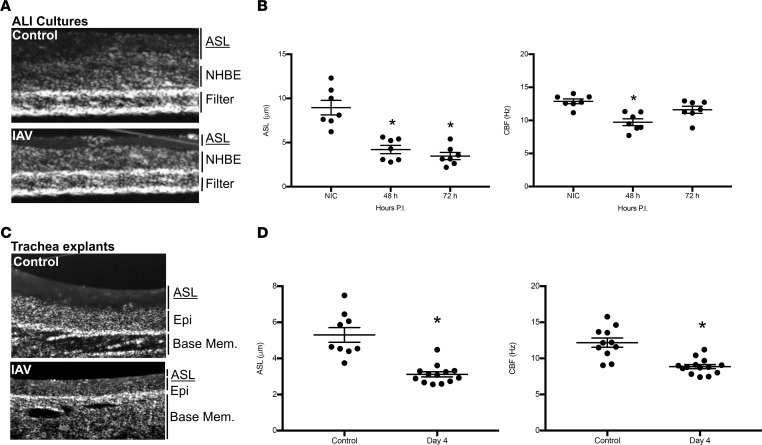
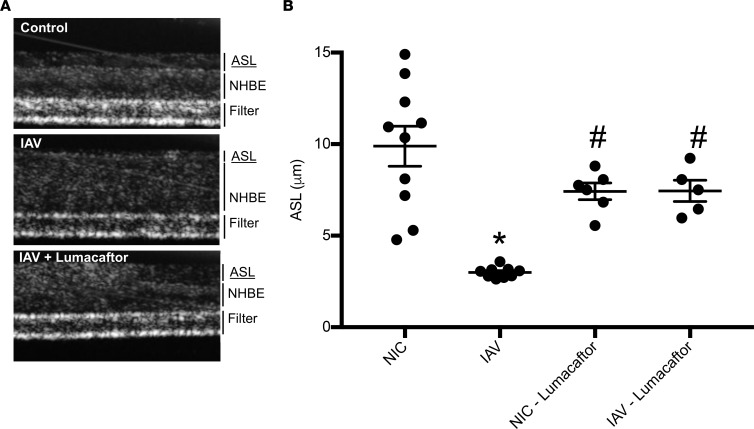
Severe influenza (IAV) infection can develop into bronchopneumonia and edema, leading to acquired respiratory distress syndrome (ARDS) and pathophysiology. Underlying causes for pulmonary edema and aberrant fluid regulation largely remain unknown, particularly regarding the role of viral-mediated mechanisms. Herein, we show that distinct IAV strains reduced the functions of the epithelial sodium channel (ENaC) and the cystic fibrosis transmembrane regulator (CFTR) in murine respiratory and alveolar epithelia in vivo, as assessed by measurements of nasal potential differences and single-cell electrophysiology. Reduced ion channel activity was distinctly limited to virally infected cells in vivo and not bystander uninfected lung epithelium. Multiple lines of evidence indicated ENaC and CFTR dysfunction during the acute infection period; however, only CFTR dysfunction persisted beyond the infection period. ENaC, CFTR, and Na,K-ATPase activities and protein levels were also reduced in virally infected human airway epithelial cells. Reduced ENaC and CFTR led to changes in airway surface liquid morphology of human tracheobronchial cultures and airways of IAV-infected mice. Pharmacologic correction of CFTR function ameliorated IAV-induced physiologic changes. These changes are consistent with mucous stasis and pulmonary edema; furthermore, they indicate that repurposing therapeutic interventions correcting CFTR dysfunction may be efficacious for treatment of IAV lung pathophysiology.

Keywords: Epithelial transport of ions and water; Influenza; Pulmonology; Virology.


Conflict of interest statement

Conflict of interest: SM reports income from the American Physiological Society for his role as editor in chief of Physiological Reviews.

Figures

Figure 1
Figure 1. IAV infection reduces ENaC and CFTR function in vivo.
Mice were infected with 4,000 PFU of PR8ΔGFP. NPD of control and infected mice were measured as described in Methods. (A) Recording traces depicting NPD in noninfected control mice, immediately after the probe was inserted in one the mouse nares; a negative voltage deflection was recorded and is indicative of the active Na+ ion absorption. Addition of 200 μM amiloride in the perfusate inhibited the voltage difference, indicating the role of ENaC in maintaining the initially recorded NPD. Subsequent perfusion with 10–20 μM forskolin activated a second potential difference due to the movement of Cl and HCO3, which was inhibited by 50 μM GlyH-101, showing the role of CFTR in this process. Representative NPD recordings from uninfected (Control) mice, 5 and 15 days p.i. are shown, with the electrical potential scale noted for each time point (bottom left). (B) ENaC activity, as measured by NPD across time course of IAV. Scatter plots with NPD value ± SEM at 2, 5, 10, and 15 days p.i. (C) Scatter plots of GlyH-101–sensitive (CFTR) NPD at days 2, 5, 10, and 15 p.i. Each data point corresponds to a single mouse, N = 9–13 per group; mean ± SEM. Significance was determined by 1-way ANOVA and post hoc Tukey test for multiple comparisons. *P < 0.0001 compared with noninfected controls.
Figure 2
Figure 2. IAV reduces ENaC single-channel activity in infected but not in uninfected cells.
Mice were infected with 4,000 PFU of PR8ΔGFP, lungs were harvested 5 days p.i., and fresh 250 μM slices were prepared using a live tissue slicer from uninfected controls and infected animals as previously described (14). Slices were incubated in culture medium for 3–4 hours before ion channel activity was recorded from GFP+ and GFP- cells. Lung cryosections display widespread infection. GFP- cells exhibited single channels with conductance of 4 pS and 18 pS. Recordings were obtained at Vpatch + 100 mV when Vm was 0 mV (slices incubated in 135 mM KCl Ringer). Original magnification, ×ばつ100 (A) and ×ばつ200 (B). (C) Tracings of ENaC open probability conductance in GFP- cells. Histogram shown in D shows number of events for the 4 Ps channel only. (E) A representative recording of channel activities recorded from GFP+-infected AT2 cells. (F) GFP+ AT2 cells exhibited substantial reduction of 4 pS and 18 pS activity, without affecting their unitary conductances. Please see Figure 3 for quantification of these findings.
Figure 3
Figure 3. ENaC channel dysfunction during IAV infection.
Mice were infected with 4,000 PFU of PR8ΔGFP; lungs were harvested at days 1, 2, 4, 5, 7, 10, 13, 14, and 15 p.i.; and live slices were cut using a live tissue slicer. ENaC activities in infected AT2 cells (GFP+) were recorded using cell-attached mode of the patch-clamp technique. (A and B) Reduction of ENaC open probabilities for various times after infection. N = 5 mice and n = 29 cells per group. The maximum inhibition was seen at day 7, after which a slow recovery of both conductances was observed. (C and D) ENaC activity, measured as open probability (Po), was not affected in noninfected cells. Data are plotted as mean open probabilities, top and bottom quartiles ± SEM. Data were analyzed by 1-way ANOVA and post hoc Bonferroni correction for multiple comparisons. *P < 0.0001 for each time point compared with noninfected control values.
Figure 4
Figure 4. IAV reduces CFTR single-channel activity in infected but not uninfected NHBEs.
NHBEs were grown on glass cover slips and infected with PR8ΔGFP at a MOI of 6. Infected (GFP+) and noninfected (GFP) cells were patch-clamped 48 hours p.i. in the cell-attached mode, and forskolin-treated single-channel activities (CFTR) were recorded. (A) Representative CFTR single-channel activity traces recorded from an uninfected NHBE. CFTR was activated with forskolin (10 μM) and inhibited with PPQ-102 (10 μM), a CFTR inhibitor. (B) Amplitude histogram showing the distribution of active channels after forskolin addition. Channel conductance recorded at –100 mV shows a peak at about 0.6 pA corresponding to a unitary conductance of 6 pS. (C and D) CFTR activity in NHBEs infected with PR8ΔGFP. (C) Typical recording after addition of 10 μM forskolin. (D) Forskolin activation of channel with 6 pS conductance was reduced markedly in GFP+ cells. (E) CFTR activity, as open probability of the channels recorded from 9 uninfected and 9 infected cells. Data were analyzed by 1-way ANOVA followed by post hoc Tukey test for multiple comparisons. Data are plotted as mean values (N = 9), top and lower quartiles ± SD. *P < 0.0001.
Figure 5
Figure 5. IAV reduces ENaC and CFTR short-circuit currents across intact normal human bronchial epithelial cell monolayers.
NHBEs were grown at an air-liquid interface and infected with A/California/07/2009 H1N1 IAV at a MOI of 3 for (A) 24, (B) 48, and (C) 72 hours, at which point they were mounted in Ussing chambers for the measurement of short-circuit currents (Isc) and transepithelial resistance. Amiloride (ENaC) and forskolin-sensitive currents inhibited by the specific CFTR inhibitor CFTRinh172 were significantly reduced by IAV infection. Amilo., amiloride trough; Forsk Pk., forskolin peak; Forsk. Plt., forskolin plateau. Characteristic records (A–C) and scatter plots (n = 6 filters per groups; mean ± 1SEM) (D–F). Data were analyzed by 1-way ANOVA and post hoc Tukey test for multiple comparisons. *P < 0.0001 compared with time-matched noninfected controls.
Figure 6
Figure 6. Transepithelial resistance is similarly decreased by two different strains of IAV.
NHBEs were grown at an air-liquid interface and infected with (A) A/California/07/2009 or (B) A/PR/8/72 H1N1 IAV at a MOI of 3, and total transepithelial resistance was measured in an Ussing chamber system. Both IAV strains significantly reduced transepithelial resistance 48 hours p.i. Scatter plots, n = 10, with mean ± SEM. Data were analyzed by 1-way ANOVA and post hoc Tukey test for multiple comparisons. *P < 0.0001 compared with noninfected controls.
Figure 7
Figure 7. IAV decreases Na+/K+-ATPase activity.
NHBEs were grown at an air-liquid interface and infected with A/California/07/2009 at MOIs of 1, 2, and 3, and Na/K-ATPase activity was measured in an Ussing chamber system, following permeabilization of the apical membranes with nystatin. IAV caused reductions in Na/K-ATPase activity at all MOIs tested. (A) Na/K-ATPase after IAV infection at MOIs of 1, 2, and 3. (B) Ouabain-sensitive currents are plotted as mean ± SEM, N = 7. Data were analyzed by 1-way ANOVA and post hoc Tukey test for multiple comparisons. *P < 0.0001 compared with noninfected controls.
Figure 8
Figure 8. IAV decreases specific subunits of ENaC, CFTR, and Na/K-ATPase at the cell surface.
NHBEs were grown at an air-liquid interface and infected with A/California/07/2009 at a MOI of 3. (A) ENaC, CFTR, and Na/K-ATPase protein abundance was measured by Western blotting. For ENaC and CFTR measurements, biotinylated apical membrane proteins were immunoblotted with specific antibodies against ENaC subunits and CFTR, respectively. Blots are representative of 3 separate experiments. (B) Densitometry demonstrates reductions in ENaC subunits, CFTR, and α-Na/K-ATPase subunit, but no difference was observed in the expression of the regulatory β subunit Na/K-ATPase levels. Data were analyzed by 1-way ANOVA and post hoc Tukey test for multiple comparisons. N = 3 per group. *P < 0.001 compared with mock-infected controls.
Figure 9
Figure 9. IAV infection reduces ASL depth and ciliary beat frequency in airway epithelial cultures and in vivo murine infection.
NHBEs were grown at an air-liquid interface and infected with A/California/07/2009 at a MOI of 1 for 48 or 72 hours. ASL depth and CBF were imaged using μOCT. (A) Representative OCT images from control or IAV-infected Transwell inserts identifying ASL, cell (NHBE), and filter structures. (B) IAV significantly (P < 0.003) reduced ASL depth and CBF within NHBE cultures at all time points and for the duration of experiments. (C) Representative images are displayed from μOCT imaging of tracheas. (D) ASL and CBF in tracheas from infected mice were significantly decreased after 4 days of infection. (B and D) Data, n = 7–13 per group, are plotted as mean ASL depth or CBF ± SEM. Data were analyzed by 1-way ANOVA and post hoc Tukey test for multiple comparisons. *P < 0.003 compared with noninfected controls.
Figure 10
Figure 10. Pharmacological correction of CFTR restores ASL depth after IAV infection.
NHBEs were grown at an air-liquid interface and infected with A/California/07/2009 at a MOI of 1 for 48 hours. Lumacaftor (10 μM) was given via the basolateral compartment 1 hour p.i. ASL depth was measured by μOCT imaging. (A) Representative images are displayed from μOCT imaging of uninfected NHBEs, infected NHBEs, and infected NHBEs with lumacaftor treatment. (B) ASL was restored to uninfected levels after treatment with lumacaftor. Data are plotted as mean ASL depth ± SEM, with n = 6–10 per group across 2 donors. Data were analyzed by 1-way ANOVA with a post hoc Tukey test for multiple comparisons. *P < 0.0001 compared with noninfected controls, #P < 0.04 compared with IAV.

References

    1. Louie JK, et al. Factors associated with death or hospitalization due to pandemic 2009 influenza A(H1N1) infection in California. JAMA. 2009;302(17):1896–1902. doi: 10.1001/jama.2009.1583. - DOI - PubMed
    1. Jain S, et al. Hospitalized patients with 2009 H1N1 influenza in the United States, April-June 2009. N Engl J Med. 2009;361(20):1935–1944. doi: 10.1056/NEJMoa0906695. - DOI - PubMed
    1. Taylor G, et al. Epidemiological features of influenza in Canadian adult intensive care unit patients. Epidemiol Infect. 2016;144(4):741–750. doi: 10.1017/S0950268815002113. - DOI - PMC - PubMed
    1. Birket SE, et al. Combination therapy with cystic fibrosis transmembrane conductance regulator modulators augment the airway functional microanatomy. Am J Physiol Lung Cell Mol Physiol. 2016;310(10):L928–L939. doi: 10.1152/ajplung.00395.2015. - DOI - PMC - PubMed
    1. Matalon S, Bartoszewski R, Collawn JF. Role of epithelial sodium channels in the regulation of lung fluid homeostasis. Am J Physiol Lung Cell Mol Physiol. 2015;309(11):L1229–L1238. doi: 10.1152/ajplung.00319.2015. - DOI - PMC - PubMed

Publication types

MeSH terms

Cite

AltStyle によって変換されたページ (->オリジナル) /