Typhoid Fever in Chile 1969-2012: Analysis of an Epidemic and Its Control
- PMID: 30047371
- PMCID: PMC6128366
- DOI: 10.4269/ajtmh.18-0125
Typhoid Fever in Chile 1969-2012: Analysis of an Epidemic and Its Control
Abstract
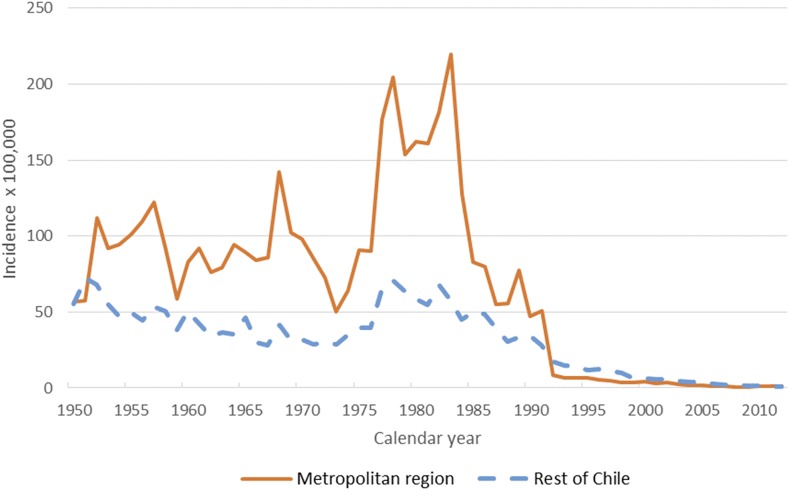
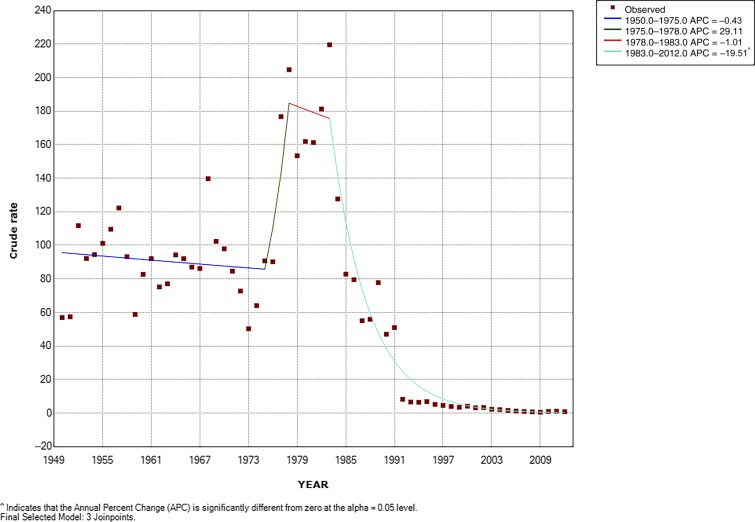
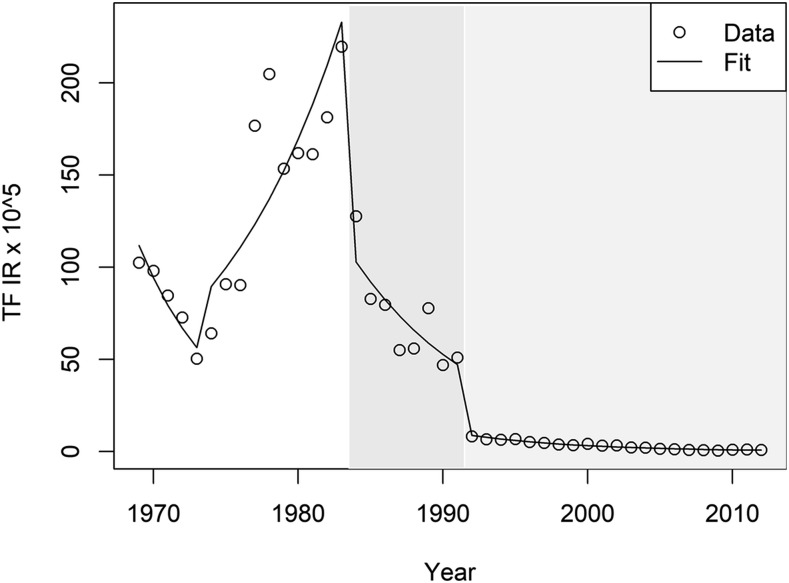
From 1975 to 1983, a large epidemic of typhoid fever (TF) affected the metropolitan region (MR) of Chile (incidence rate [IR] of 219.6 per 105 in 1983). In 1983-1984, interventions were implemented focusing on person-to-person transmission (vaccination, food handlers' control, and mass communication) and regulations to control irrigation waters containing fecal contaminates. In 1991, a second intervention was quickly implemented to avoid the cholera epidemic affecting neighboring countries (total prohibition of growing or selling crops in the MR). We explored the potential impact of these interventions on the epidemic. We created a yearly database of the MR TF cases, population, and contextual factors of TF from 1969 to 2012. We first analyzed the epidemic (Joinpoint regression), identified predictors of TF (Poisson multiple regression), and then analyzed the effect of the interventions (interrupted time series model). The main predictor of the TF epidemic was the rate of unemployment. In relation to the 1983-1984 person-to-person interventions, TF came down by 51% (95% confidence interval [CI]: 30.2-65.0%) and continued to decrease at a rate of 10.4% (95% CI: 5.8-15.6%) per year until 1991. In 1991, with the strong environmental control of the sewage-irrigated crops, TF further decreased by 77% (95% CI: 69.0-83.1%) and continued decreasing thereafter at 13% (95% CI: 11.3-15.6%) per year until the end of the study period. Today, 40 years after the epidemic, TF is a rare disease in the MR of Chile.
Figures
Comment in
-
Typhoid Fever in Chile.Cabello F. Cabello F. Am J Trop Med Hyg. 2018 Dec;99(6):1649-1650. doi: 10.4269/ajtmh.18-0677. Am J Trop Med Hyg. 2018. PMID: 30851026 Free PMC article. No abstract available.
References
-
- Enrique L, Ferreccio C, 2007. Fiebre tifoidea: emergencia, cúspide y declinación de una enfermedad infecciosa en Chile. Rev Chilena Infectol 24: 435–440. - PubMed
-
- Ernesto M, Yrarrazaval M, 1983. Fiebre tifoidea en Chile: consideraciones epidemiológicas. Rev Med Chil 111: 606–615. - PubMed
-
- Ricardo AA, Donoso P, 1990. Desarrollo socioeconómico de Chile: un análisis comparativo para América del Sur. Cuad Econ 27: 31–81.
-
- Ristori C, 1981. Epidemiologia de la fiebre tifoidea en Chile. Boletín de Vigilancia Epidemiológica 8: 8–11
-
- Superintendencia de Servicios Sanitarios (SISS) , 2015. Cobertura Histórica del Sector. Available at: http://www.siss.gob.cl/577/w3-article-3683.html. Accessed July 1, 2018.
Publication types
MeSH terms
LinkOut - more resources
Full Text Sources
Other Literature Sources
Miscellaneous