This site needs JavaScript to work properly. Please enable it to take advantage of the complete set of features!
Skip to main page content
U.S. flag

An official website of the United States government

Dot gov

The .gov means it’s official.
Federal government websites often end in .gov or .mil. Before sharing sensitive information, make sure you’re on a federal government site.

Https

The site is secure.
The https:// ensures that you are connecting to the official website and that any information you provide is encrypted and transmitted securely.

NIH NLM Logo
Log in
Access keys NCBI Homepage MyNCBI Homepage Main Content Main Navigation
. 2018 Jul;50(7):951-955.
doi: 10.1038/s41588-018-0150-8. Epub 2018 Jun 25.

Defining endemic cholera at three levels of spatiotemporal resolution within Bangladesh

Affiliations

Defining endemic cholera at three levels of spatiotemporal resolution within Bangladesh

Daryl Domman et al. Nat Genet. 2018 Jul.

Abstract

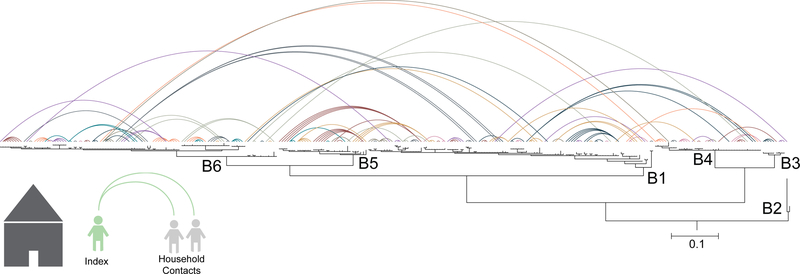
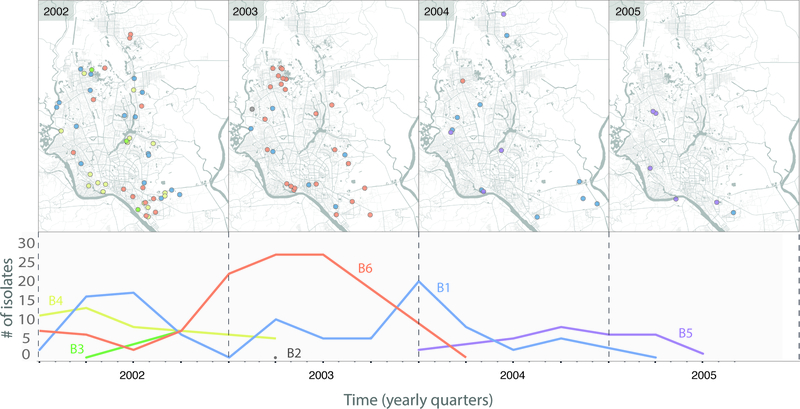
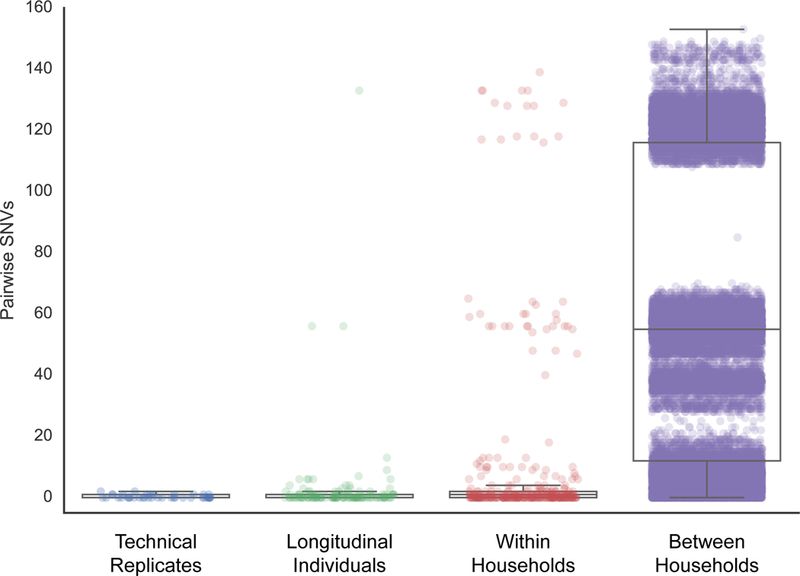
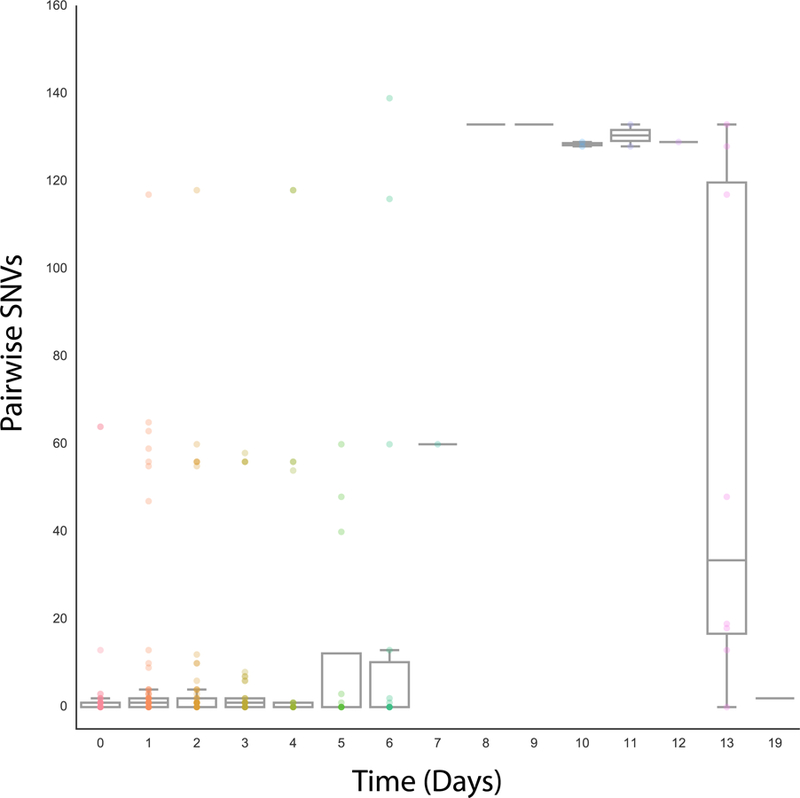
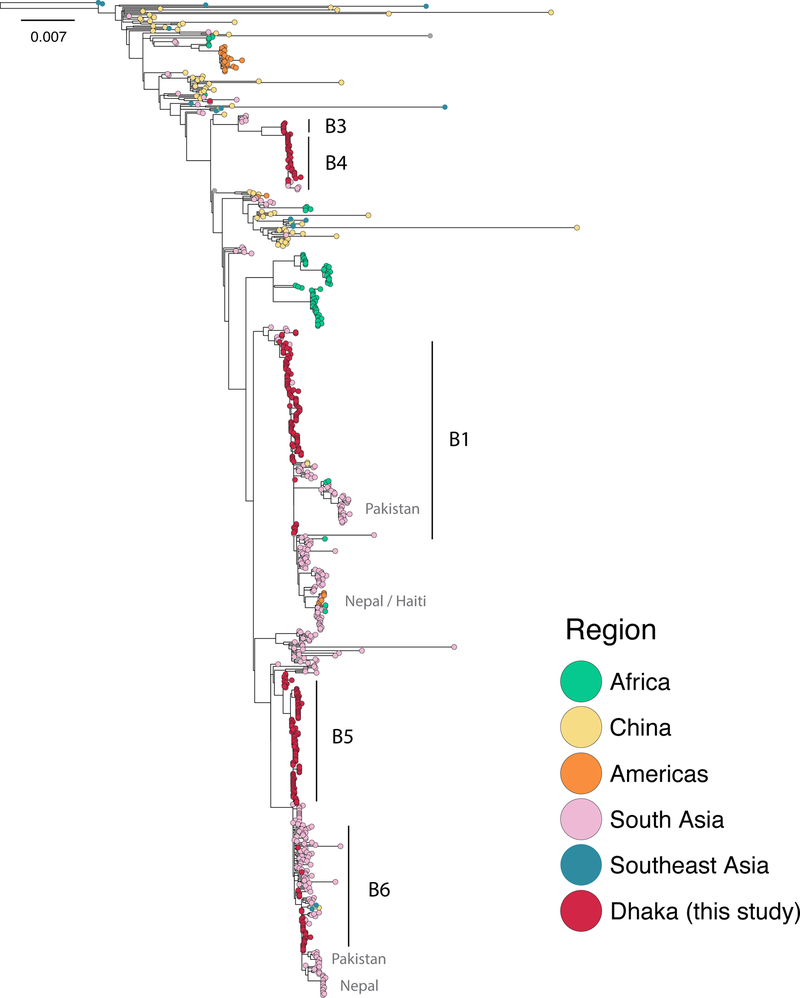
Although much focus is placed on cholera epidemics, the greatest burden occurs in settings in which cholera is endemic, including areas of South Asia, Africa and now Haiti1,2. Dhaka, Bangladesh is a megacity that is hyper-endemic for cholera, and experiences two regular seasonal outbreaks of cholera each year3. Despite this, a detailed understanding of the diversity of Vibrio cholerae strains circulating in this setting, and their relationships to annual outbreaks, has not yet been obtained. Here we performed whole-genome sequencing of V. cholerae across several levels of focus and scale, at the maximum possible resolution. We analyzed bacterial isolates to define cholera dynamics at multiple levels, ranging from infection within individuals, to disease dynamics at the household level, to regional and intercontinental cholera transmission. Our analyses provide a genomic framework for understanding cholera diversity and transmission in an endemic setting.


Conflict of interest statement

Competing Financial Interests

The authors declare no competing financial interests.

Figures

Figure 1.
Figure 1.. Phylogeny and household network of Vibrio cholerae 7th pandemic strains.
Bayesian phylogenetic reconstruction of the 300 7PET V. cholerae strains circulating in Dhaka from 2002–2005 along with the reference isolate N16961. The scale bar denotes number of substitutions per variable site. Labeled nodes delineate sublineages. The phylogeny was rooted on the wave 1 clade containing N16961. V. cholerae serogroup O139 lineages are B3 (n= 9) and B4 (n= 41). All other lineages are V. cholerae serogroup O1; B1 (n= 109) and B2 (n= 1) are serotype Inaba, and B5 (n= 34) and B6 (n= 106) are serotype Ogawa. The contact network was constructed by anchoring all household contacts to their respective index case on the phylogenetic tree. Colors denote household relationships when anchored to the same index case. Due to the number of households (n= 102), colors are non-unique.
Figure 2.
Figure 2.. Spatiotemporal dynamics of 7th pandemic strains.
The top panel displays the spatial distribution of the 7PET sublineages (as defined in Figure 1) within Dhaka city for each year of the study. The number of isolates sampled per sublineage over time is shown on the bottom panel.
Figure 3.
Figure 3.. Pairwise comparisons of SNVs within and between households and longitudinal samples.
The technical replicates consist of five colonies that were isolated from a single glycerol stock, which was repeated using four different starting stocks from different individuals. A total of 420 data points represent the pairwise comparisons between the five replicates from each of the four stocks. The longitudinal dataset comprises the 45 individuals sampled at more than one time point. For each individual, we calculated all pairwise comparisons between samples, for a total of 129 data points across all longitudinal individuals. The within household dataset comprises the comparisons within each of the 79 households with more than one individual, for a total of 200 individuals and 339 data points. Only unique person-person samples were compared in this set. The between household dataset includes comparisons between all 102 households within the study, and comprises comparisons across 224 individuals for a total of 39,802 data points. Box plots depict the mean and quartiles for each dataset and the lengths of the whiskers correspond to 1.5 times the interquartile range. Each dot represents the number of SNVs between two isolates and their opacity scales with the number of observations. The apparent tri-modal distributions seen in the plots are due to the underlying population structure of the isolates (see Figure 1).
Figure 4.
Figure 4.. Effect of time of sampling on genetic diversity within a household.
For each household with more than one isolate (n = 79), we calculated the pairwise number of SNVs and the number of days between sampling dates for each isolate. A total of 303 pairwise comparisons were performed. The opacity of the data points scales with the number of observations. Box plots for each time period display the mean and quartiles of the number of SNVs, with the whiskers extending to 1.5 times the interquartile range.
Figure 5.
Figure 5.. Maximum likelihood phylogeny of global 7th pandemic strains.
The Dhaka isolates were put into the context of a global collection of 7th pandemic V. cholerae, for a total of 813 isolates. The maximum likelihood phylogeny was estimated under the GTR model on 6,241 variable sites with 500 bootstrap replicates. The phylogeny was rooted using the pre-seventh pandemic strain M66. Nodes are colored according to the origin of the isolates. Sublineages seen in Dhaka are indicated, as well as important transmission events.

References

    1. Ali M, Nelson AR, Lopez AL & Sack DA Updated Global Burden of Cholera in Endemic Countries. PLoS Negl. Trop. Dis 9, (2015). - PMC - PubMed
    1. Clemens JD, Nair GB, Ahmed T, Qadri F & Holmgren J Cholera. The Lancet 0, (2017). - PubMed
    1. Longini IM et al. Epidemic and Endemic Cholera Trends over a 33-Year Period in Bangladesh. J. Infect. Dis 186, 246–251 (2002). - PubMed
    1. Kendall EA et al. Relatedness of Vibrio cholerae O1/O139 Isolates from Patients and Their Household Contacts, Determined by Multilocus Variable-Number Tandem-Repeat Analysis. J. Bacteriol 192, 4367–4376 (2010). - PMC - PubMed
    1. Faruque SM et al. Reemergence of Epidemic Vibrio cholerae O139, Bangladesh. Emerg. Infect. Dis 9, 1116–1122 (2003). - PMC - PubMed

Publication types

Cite

AltStyle によって変換されたページ (->オリジナル) /