This site needs JavaScript to work properly. Please enable it to take advantage of the complete set of features!
Skip to main page content
U.S. flag

An official website of the United States government

Dot gov

The .gov means it’s official.
Federal government websites often end in .gov or .mil. Before sharing sensitive information, make sure you’re on a federal government site.

Https

The site is secure.
The https:// ensures that you are connecting to the official website and that any information you provide is encrypted and transmitted securely.

NIH NLM Logo
Log in
Access keys NCBI Homepage MyNCBI Homepage Main Content Main Navigation
. 2018 Feb 20;15(2):e1002508.
doi: 10.1371/journal.pmed.1002508. eCollection 2018 Feb.

The 2014-2015 Ebola virus disease outbreak and primary healthcare delivery in Liberia: Time-series analyses for 2010-2016

Affiliations

The 2014-2015 Ebola virus disease outbreak and primary healthcare delivery in Liberia: Time-series analyses for 2010-2016

Bradley H Wagenaar et al. PLoS Med. .

Abstract

Background: The aim of this study is to estimate the immediate and lasting effects of the 2014-2015 Ebola virus disease (EVD) outbreak on public-sector primary healthcare delivery in Liberia using 7 years of comprehensive routine health information system data.

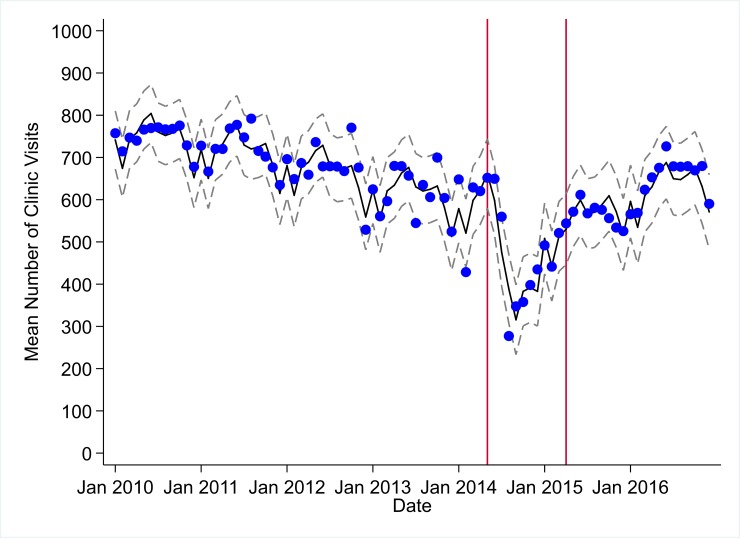
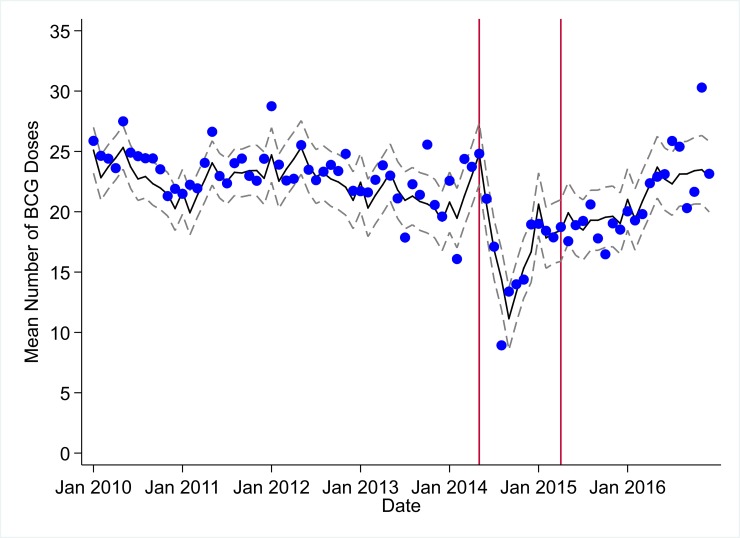
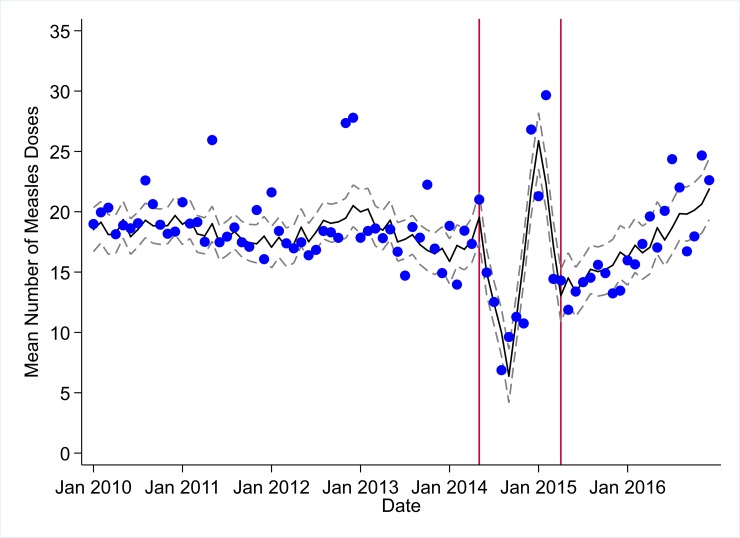
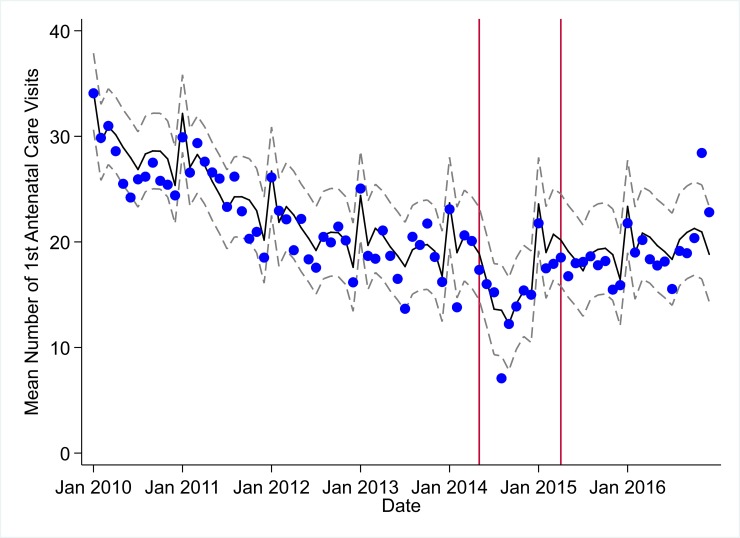
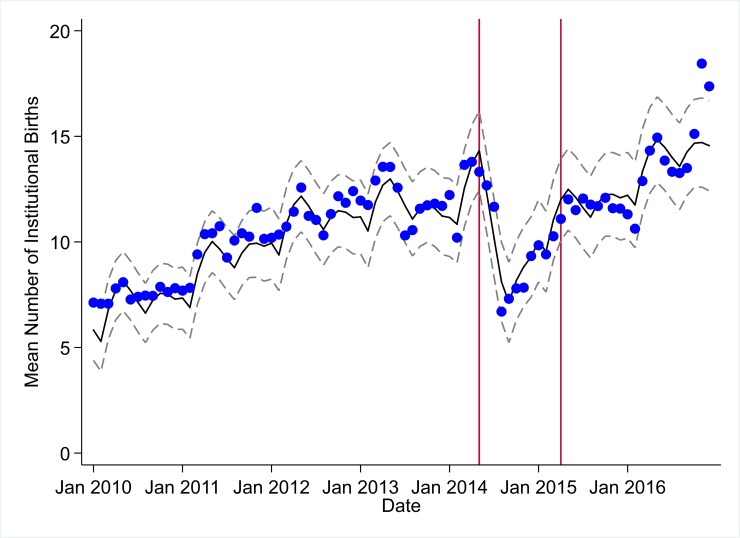
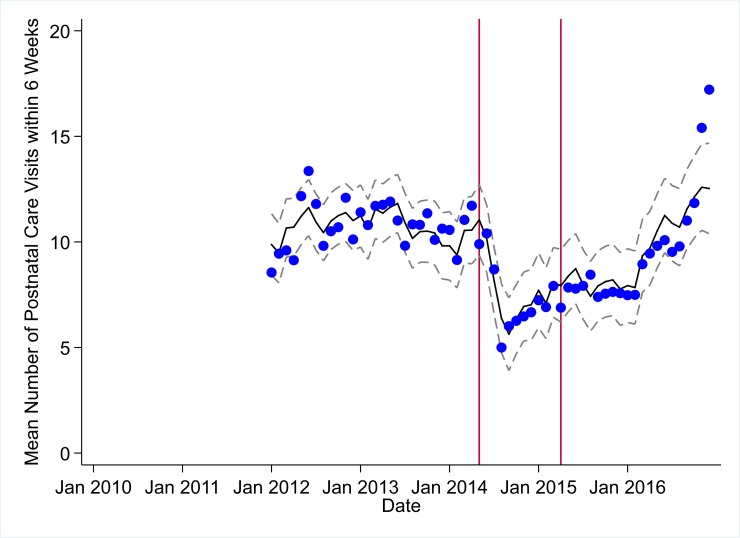
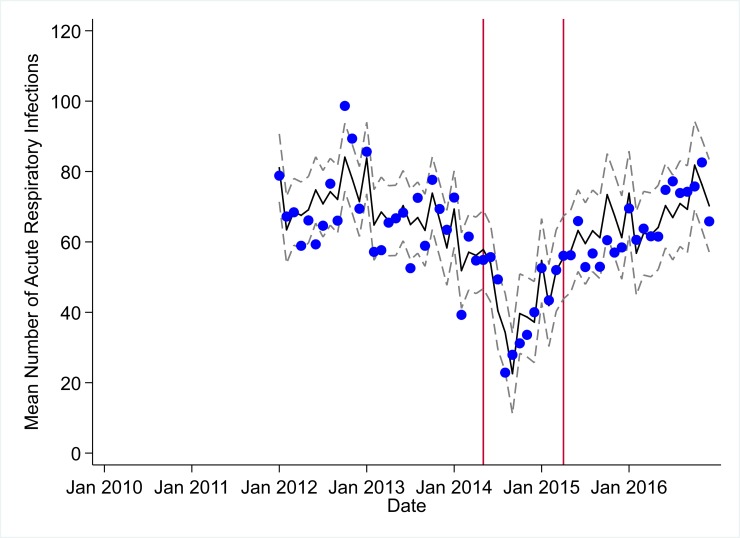
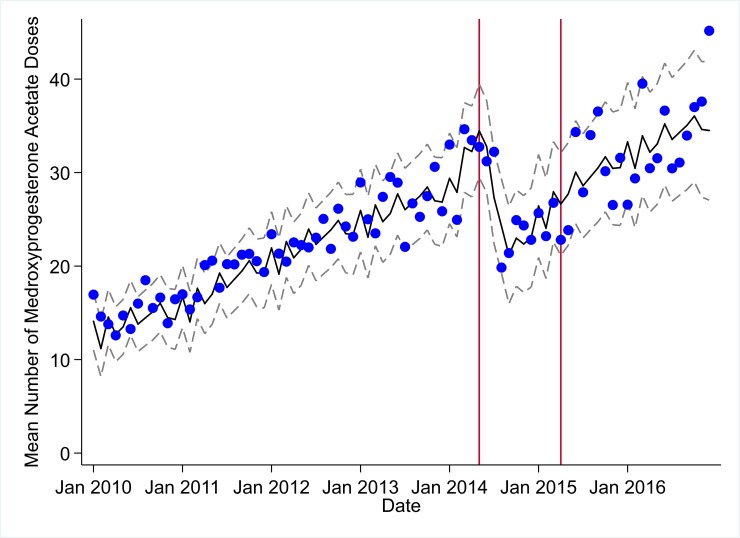
Methods and findings: We analyzed 10 key primary healthcare indicators before, during, and after the EVD outbreak using 31,836 facility-month service outputs from 1 January 2010 to 31 December 2016 across a census of 379 public-sector health facilities in Liberia (excluding Montserrado County). All indicators had statistically significant decreases during the first 4 months of the EVD outbreak, with all indicators having their lowest raw mean outputs in August 2014. Decreases in outputs comparing the end of the initial EVD period (September 2014) to May 2014 (pre-EVD) ranged in magnitude from a 67.3% decrease in measles vaccinations (95% CI: -77.9%, -56.8%, p < 0.001) and a 61.4% decrease in artemisinin-based combination therapy (ACT) treatments for malaria (95% CI: -69.0%, -53.8%, p < 0.001) to a 35.2% decrease in first antenatal care (ANC) visits (95% CI: -45.8%, -24.7%, p < 0.001) and a 38.5% decrease in medroxyprogesterone acetate doses (95% CI: -47.6%, -29.5%, p < 0.001). Following the nadir of system outputs in August 2014, all indicators showed statistically significant increases from October 2014 to December 2014. All indicators had significant positive trends during the post-EVD period, with every system output exceeding pre-Ebola forecasted trends for 3 consecutive months by November 2016. Health system outputs lost during and after the EVD outbreak were large and sustained for most indicators. Prior to exceeding pre-EVD forecasted trends for 3 months, we estimate statistically significant cumulative losses of -776,110 clinic visits (95% CI: -1,480,896, -101,357, p = 0.030); -24,449 bacille Calmette-Guérin vaccinations (95% CI: -45,947, -2,020, p = 0.032); -9,129 measles vaccinations (95% CI: -12,312, -5,659, p < 0.001); -17,191 postnatal care (PNC) visits within 6 weeks of birth (95% CI: -28,344, -5,775, p = 0.002); and -101,857 ACT malaria treatments (95% CI: -205,839, -2,139, p = 0.044) due to the EVD outbreak. Other outputs showed statistically significant cumulative losses only through December 2014, including losses of -12,941 first pentavalent vaccinations (95% CI: -20,309, -5,527, p = 0.002); -5,122 institutional births (95% CI: -8,767, -1,234, p = 0.003); and -45,024 acute respiratory infections treated (95% CI: -66,185, -24,019, p < 0.001). Compared to pre-EVD forecasted trends, medroxyprogesterone acetate doses and first ANC visits did not show statistically significant net losses. ACT treatment for malaria was the only indicator with an estimated net increase in system outputs through December 2016, showing an excess of +78,583 outputs (95% CI: -309,417, +450,661, p = 0.634) compared to pre-EVD forecasted trends, although this increase was not statistically significant. However, comparing December 2013 to December 2017, ACT malaria cases have increased 49.2% (95% CI: 33.9%, 64.5%, p < 0.001). Compared to pre-EVD forecasted trends, there remains a statistically significant loss of -15,144 PNC visits within 6 weeks (95% CI: -29,453, -787, p = 0.040) through December 2016.

Conclusions: The Liberian public-sector primary healthcare system has made strides towards recovery from the 2014-2015 EVD outbreak. All primary healthcare indicators tracked have recovered to pre-EVD levels as of November 2016. Yet, for most indicators, it took more than 1 year to recover to pre-EVD levels. During this time, large losses of essential primary healthcare services occurred compared to what would have been expected had the EVD outbreak not occurred. The disruption of malaria case management during the EVD outbreak may have resulted in increased malaria cases. Large and sustained investments in public-sector primary care health system strengthening are urgently needed for EVD-affected countries.


Conflict of interest statement

The authors have declared that no competing interests exist.

Figures

Fig 1
Fig 1. Mean trends and system losses due to Ebola virus disease (EVD) outbreak (June 2014–April 2015) for clinic visits in a census of 379 clinics providing services in Liberia from 2010–2016, excluding Montserrado County.
The black solid line represents the fitted mean from a linear mixed model using a segmented regression parameterization, random intercepts and slopes by facility, monthly indicator variables to adjust for seasonality, a fixed effect to adjust for clinic-level catchment area, and an AR(1) structure to account for autocorrelation in residual errors. Gray dashed lines are 95% confidence intervals around the fitted mean. Red lines are placed at the final month before the start (May 2014) and end (April 2015) of the EVD outbreak in Liberia.
Fig 2
Fig 2. Mean trends and system losses due to Ebola virus disease (EVD) outbreak (June 2014–April 2015) for bacille Calmette–Guérin (BCG) vaccinations in a census of 379 clinics providing services in Liberia from 2010–2016, excluding Montserrado County.
The black solid line represents the fitted mean from a linear mixed model using a segmented regression parameterization, random intercepts and slopes by facility, monthly indicator variables to adjust for seasonality, a fixed effect to adjust for clinic-level catchment area, and an AR(1) structure to account for autocorrelation in residual errors. Gray dashed lines are 95% confidence intervals around the fitted mean. Red lines are placed at the final month before the start (May 2014) and end (April 2015) of the EVD outbreak in Liberia.
Fig 3
Fig 3. Mean trends and system losses due to Ebola virus disease (EVD) outbreak (June 2014–April 2015) for measles vaccinations in a census of 379 clinics providing services in Liberia from 2010–2016, excluding Montserrado County.
The black solid line represents the fitted mean from a linear mixed model using a segmented regression parameterization, random intercepts and slopes by facility, monthly indicator variables to adjust for seasonality, a fixed effect to adjust for clinic-level catchment area, and an AR(1) structure to account for autocorrelation in residual errors. Gray dashed lines are 95% confidence intervals around the fitted mean. Red lines are placed at the final month before the start (May 2014) and end (April 2015) of the EVD outbreak in Liberia.
Fig 4
Fig 4. Mean trends and system losses due to Ebola virus disease (EVD) outbreak (June 2014–April 2015) for first pentavalent vaccinations in a census of 379 clinics providing services in Liberia from 2010–2016, excluding Montserrado County.
The black solid line represents the fitted mean from a linear mixed model using a segmented regression parameterization, random intercepts and slopes by facility, monthly indicator variables to adjust for seasonality, a fixed effect to adjust for clinic-level catchment area, and an AR(1) structure to account for autocorrelation in residual errors. Gray dashed lines are 95% confidence intervals around the fitted mean. Red lines are placed at the final month before the start (May 2014) and end (April 2015) of the EVD outbreak in Liberia.
Fig 5
Fig 5. Mean trends and system losses due to Ebola virus disease (EVD) outbreak (June 2014–April 2015) for first antenatal care visits in a census of 379 clinics providing services in Liberia from 2010–2016, excluding Montserrado County.
The black solid line represents the fitted mean from a linear mixed model using a segmented regression parameterization, random intercepts and slopes by facility, monthly indicator variables to adjust for seasonality, a fixed effect to adjust for clinic-level catchment area, and an AR(1) structure to account for autocorrelation in residual errors. Gray dashed lines are 95% confidence intervals around the fitted mean. Red lines are placed at the final month before the start (May 2014) and end (April 2015) of the EVD outbreak in Liberia.
Fig 6
Fig 6. Mean trends and system losses due to Ebola virus disease (EVD) outbreak (June 2014–April 2015) for institutional births in a census of 379 clinics providing services in Liberia from 2010–2016, excluding Montserrado County.
The black solid line represents the fitted mean from a linear mixed model using a segmented regression parameterization, random intercepts and slopes by facility, monthly indicator variables to adjust for seasonality, a fixed effect to adjust for clinic-level catchment area, and an AR(1) structure to account for autocorrelation in residual errors. Gray dashed lines are 95% confidence intervals around the fitted mean. Red lines are placed at the final month before the start (May 2014) and end (April 2015) of the EVD outbreak in Liberia.
Fig 7
Fig 7. Mean trends and system losses due to Ebola virus disease (EVD) outbreak (June 2014–April 2015) for postnatal care within 6 weeks in a census of 379 clinics providing services in Liberia from 2010–2016, excluding Montserrado County.
The black solid line represents the fitted mean from a linear mixed model using a segmented regression parameterization, random intercepts and slopes by facility, monthly indicator variables to adjust for seasonality, a fixed effect to adjust for clinic-level catchment area, and an AR(1) structure to account for autocorrelation in residual errors. Gray dashed lines are 95% confidence intervals around the fitted mean. Red lines are placed at the final month before the start (May 2014) and end (April 2015) of the EVD outbreak in Liberia.
Fig 8
Fig 8. Mean trends and system losses due to Ebola virus disease (EVD) outbreak (June 2014–April 2015) for artemisinin-based combination therapy (ACT) treatments for malaria in a census of 379 clinics providing services in Liberia from 2010–2016, excluding Montserrado County.
The black solid line represents the fitted mean from a linear mixed model using a segmented regression parameterization, random intercepts and slopes by facility, monthly indicator variables to adjust for seasonality, a fixed effect to adjust for clinic-level catchment area, and an AR(1) structure to account for autocorrelation in residual errors. Gray dashed lines are 95% confidence intervals around the fitted mean. Red lines are placed at the final month before the start (May 2014) and end (April 2015) of the EVD outbreak in Liberia.
Fig 9
Fig 9. Mean trends and system losses due to Ebola virus disease (EVD) outbreak (June 2014–April 2015) for acute respiratory infections treated in a census of 379 clinics providing services in Liberia from 2010–2016, excluding Montserrado County.
The black solid line represents the fitted mean from a linear mixed model using a segmented regression parameterization, random intercepts and slopes by facility, monthly indicator variables to adjust for seasonality, a fixed effect to adjust for clinic-level catchment area, and an AR(1) structure to account for autocorrelation in residual errors. Gray dashed lines are 95% confidence intervals around the fitted mean. Red lines are placed at the final month before the start (May 2014) and end (April 2015) of the EVD outbreak in Liberia.
Fig 10
Fig 10. Mean trends and system losses due to Ebola virus disease (EVD) outbreak (June 2014–April 2015) for medroxyprogesterone acetate doses in a census of 379 clinics providing services in Liberia from 2010–2016, excluding Montserrado County.
The black solid line represents the fitted mean from a linear mixed model using a segmented regression parameterization, random intercepts and slopes by facility, monthly indicator variables to adjust for seasonality, a fixed effect to adjust for clinic-level catchment area, and an AR(1) structure to account for autocorrelation in residual errors. Gray dashed lines are 95% confidence intervals around the fitted mean. Red lines are placed at the final month before the start (May 2014) and end (April 2015) of the EVD outbreak in Liberia.

References

    1. World Health Organization. Situation report: Ebola virus disease—10 June 2016. Geneva: World Health Organization; 2016 [cited 2017 Apr 5]. Available from: http://apps.who.int/iris/bitstream/10665/208883/1/ebolasitrep_10Jun2016_....
    1. Brolin Ribacke KJ, Saulnier DD, Eriksson A, von Schreeb J. Effects of the West Africa Ebola virus disease on health-care utilization—a systematic review. Front Public Health. 2016;4:222 doi: 10.3389/fpubh.2016.00222 - DOI - PMC - PubMed
    1. Camara BS, Delamou A, Diro E, Béavogui AH, El Ayadi AM, Sidibé S, et al. Effect of the 2014/2015 Ebola outbreak on reproductive health services in a rural district of Guinea: an ecological study. Trans R Soc Trop Med Hyg. 2017;111(1):22–9. doi: 10.1093/trstmh/trx009 - DOI - PMC - PubMed
    1. Delamou A, Ayadi AM El, Sidibe S, Delvaux T, Camara BS, Sandouno SD, et al. Effect of Ebola virus disease on maternal and child health services in Guinea: a retrospective observational cohort study. Lancet Glob Health. 2017;5(4):e448–57. doi: 10.1016/S2214-109X(17)30078-5 - DOI - PMC - PubMed
    1. Sesay T, Denisiuk O, Shringarpure K, Wurie B, George P, Sesay M, et al. Paediatric care in relation to the 2014–2015 Ebola outbreak and general reporting of deaths in Sierra Leone. Public Health Action. 2017;7(Suppl 1):S34–9. doi: 10.5588/pha.16.0088 - DOI - PMC - PubMed

Publication types

MeSH terms

Cite

AltStyle によって変換されたページ (->オリジナル) /