This site needs JavaScript to work properly. Please enable it to take advantage of the complete set of features!
Skip to main page content
U.S. flag

An official website of the United States government

Dot gov

The .gov means it’s official.
Federal government websites often end in .gov or .mil. Before sharing sensitive information, make sure you’re on a federal government site.

Https

The site is secure.
The https:// ensures that you are connecting to the official website and that any information you provide is encrypted and transmitted securely.

NIH NLM Logo
Log in
Access keys NCBI Homepage MyNCBI Homepage Main Content Main Navigation
. 2018 Feb 7;26(2):435-445.
doi: 10.1016/j.ymthe.2017年11月01日0. Epub 2017 Nov 21.

Synergy of Immune Checkpoint Blockade with a Novel Synthetic Consensus DNA Vaccine Targeting TERT

Affiliations

Synergy of Immune Checkpoint Blockade with a Novel Synthetic Consensus DNA Vaccine Targeting TERT

Elizabeth K Duperret et al. Mol Ther. .

Abstract

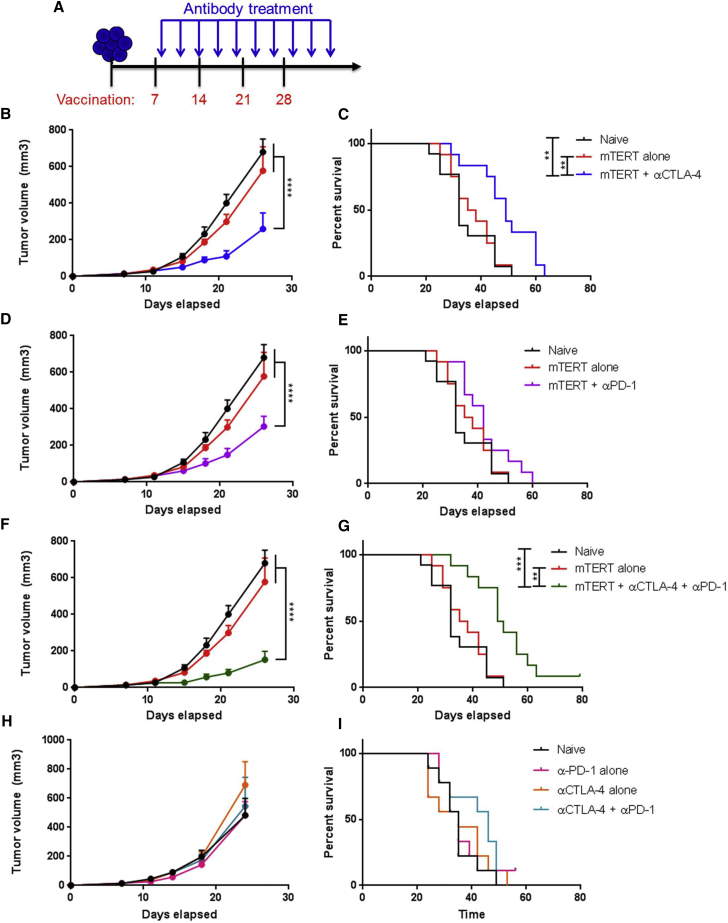
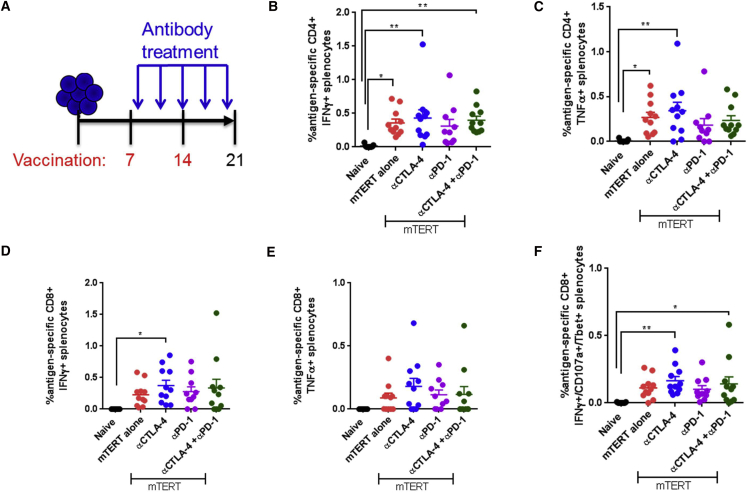
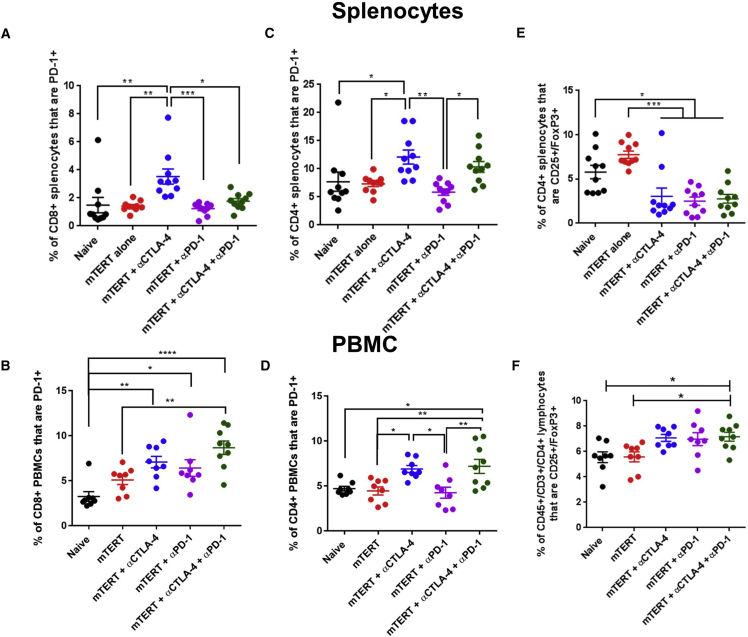
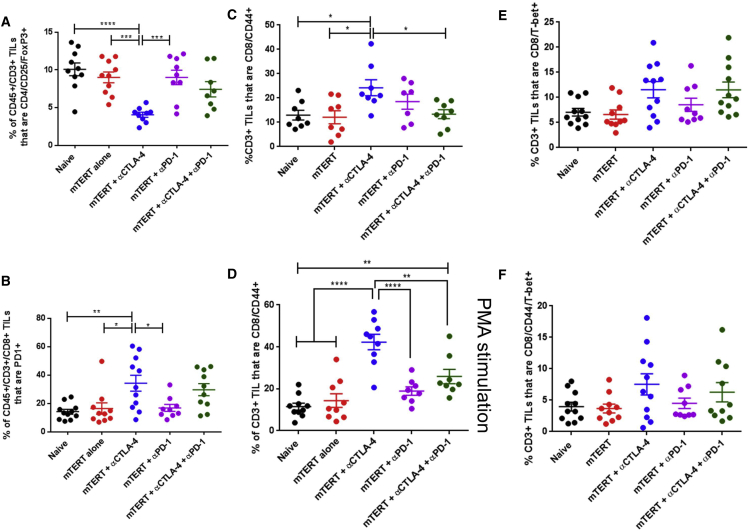
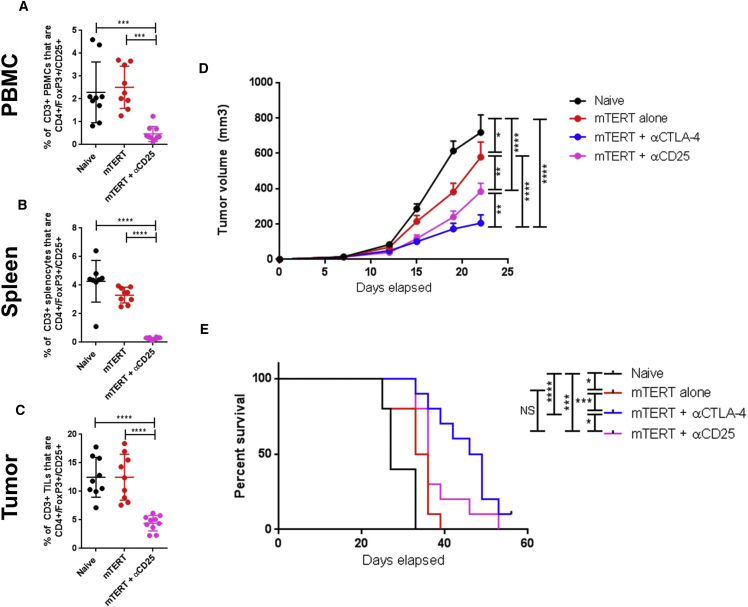
Immune checkpoint blockade antibodies are setting a new standard of care for cancer patients. It is therefore important to assess any new immune-based therapies in the context of immune checkpoint blockade. Here, we evaluate the impact of combining a synthetic consensus TERT DNA vaccine that has improved capacity to break tolerance with immune checkpoint inhibitors. We observed that blockade of CTLA-4 or, to a lesser extent, PD-1 synergized with TERT vaccine, generating more robust anti-tumor activity compared to checkpoint alone or vaccine alone. Despite this anti-tumor synergy, none of these immune checkpoint therapies showed improvement in TERT antigen-specific immune responses in tumor-bearing mice. αCTLA-4 therapy enhanced the frequency of T-bet+/CD44+ effector CD8+ T cells within the tumor and decreased the frequency of regulatory T cells within the tumor, but not in peripheral blood. CTLA-4 blockade synergized more than Treg depletion with TERT DNA vaccine, suggesting that the effect of CTLA-4 blockade is more likely due to the expansion of effector T cells in the tumor rather than a reduction in the frequency of Tregs. These results suggest that immune checkpoint inhibitors function to alter the immune regulatory environment to synergize with DNA vaccines, rather than boosting antigen-specific responses at the site of vaccination.

Keywords: CTLA4; DNA vaccine; PD1; TERT; immune tolerance.


Figures

Figure 1
Figure 1
Delivery of αCTLA-4 or αPD-1 Post-first Vaccination Synergizes with TERT DNA Vaccine above Checkpoint Alone in Generating Anti-tumor Immune Response (A) Experimental setup. Mice were implanted with TC-1 tumor cells on day 0 and then immunized four times at 1-week intervals starting 7 days after tumor implant. Mice were given antibodies (200 μg per mouse) every 3 days starting 1 day after the first immunization. Antibody delivery was continued until 1 week after the final vaccination. (B, D, F, and H) Tumor volume measurements over time for naive mice, mTERT vaccine-treated mice, or mice treated with mTERT vaccine plus αCTLA-4 (B), αPD-1 (D), or a combination of αCTLA-4 and αPD-1 (F). (C, E, and G) Mouse survival over time for naive mice, mTERT vaccine-treated mice, or mice treated with mTERT vaccine plus αCTLA-4 (C), αPD-1 (D), or a combination of αCTLA-4 and αPD-1 (G). For (B)–(G), n = 12–13 mice per group. (H) Tumor volume measurements over time for naive mice unvaccinated mice treated with αPD-1, αCTLA-4, or both αPD-1 and αCTLA-4. (I) Mouse survival over time for naive mice or unvaccinated mice treated with αPD-1, αCTLA-4, or both αPD-1 and αCTLA-4. Mice were euthanized if they appeared sick or if the tumor diameter exceeded 1.5 cm. For (H) and (I), n = 9 mice per groiup. Each experiment was repeated at least once to verify results. Significance for tumor volume measurements was determined by two-way ANOVA followed by Tukey’s HSD test. Significance for mouse survival was determined by the Gehan-Breslow-Wilcoxon test. *p < 0.05, **p < 0.01, ***p < 0.001, ****p < 0.0001. Error bars indicate ± SEM.
Figure 2
Figure 2
Antigen-Specific Intracellular Cytokine Production upon TERT DNA Vaccination and Immune Checkpoint Blockade in Tumor-Bearing Mice (A) Experimental setup. Mice were implanted with TC-1 tumor cells on day 0 and then immunized on days 7 and 14. Antibody delivery was started 1 day after the first immunization and continued every 3 days. Mice were sacrificed on day 21 for immune cell analysis. (B–F) Intracellular cytokine staining of CD8 or CD4 T cells after stimulation with native mouse TERT peptides for 5 hr. CD4 T cells were stained for IFN-γ (B) or TNF-α (C). CD8 T cells were stained for IFN-γ (D), TNF-α (E), or IFN-γ/CD107a/T-bet (F). Significance was determined by two-way ANOVA followed by Tukey’s HSD test. *p < 0.05, **p < 0.01, ***p < 0.001, ****p < 0.0001. n = 7–10 mice per group. A representative of three independent experiments is shown. Error bars indicate ± SEM.
Figure 3
Figure 3
Phenotype of Peripheral and Spleen T Cells upon TERT DNA Vaccination and Immune Checkpoint Blockade in Tumor-Bearing Mice (A–F) Staining of CD8 or CD4 T cells from spleen or peripheral blood of mice treated with the indicated therapies in accordance with the schedule in Figure 3A. CD8+ splenocytes (A) or PBMCs (B) were stained for PD-1. CD4+ splenocytes (C) or PBMCs (D) were stained for PD-1. CD4+ splenocytes (E) or PBMCs (F) were stained for CD25/FoxP3. Significance was determined by two-way ANOVA followed by Tukey’s HSD test. *p < 0.05, **p < 0.01, ***p < 0.001, ****p < 0.0001. n = 7–10 mice per group. A representative of three independent experiments is shown. Error bars indicate ± SEM.
Figure 4
Figure 4
Phenotype of Tumor-Infiltrating Lymphocytes upon TERT DNA Vaccination and Immune Checkpoint Blockade (A–F) Staining of CD8 or CD4 T cells isolated from the tumors of mice treated with the indicated therapies in accordance with the schedule in Figure 4A. mTERT-stimulated CD3+ TILs were stained for CD4/CD25/FoxP3 (A), CD8/PD-1 (B), CD8/CD44 (C), CD8/T-bet (E), or CD8/CD44/Tbet (F). PMA-stimulated CD3+ T cells were stained for CD8/CD44 (D). Significance was determined by two-way ANOVA followed by Tukey’s HSD test. *p < 0.05, **p < 0.01, ***p < 0.001, ****p < 0.0001. n = 7–10 mice per group. A representative of three independent experiments is shown. Error bars indicate ± SEM.
Figure 5
Figure 5
Delivery of αCTLA-4 in Combination with TERT DNA Vaccine Is Superior to Treg Depletion in Combination with TERT DNA Vaccine (A–C) Staining of CD8 or CD4 T cells from the peripheral blood (A), spleen (B), or tumor (C) of mice treated with the indicated therapies in accordance with the schedule in Figure 2. (D) Tumor volume measurements over time for mice with indicated treatment regimen. Mice were treated in accordance with the schedule shown in Figure 2A. (E) Mouse survival over time for mice with indicated treatment regimen. Mice were euthanized if they appeared sick or if the tumor diameter exceeded 1.5 cm. Significance for tumor volume measurements was determined by two-way ANOVA followed by Tukey’s HSD test. Significance for mouse survival was determined by the Gehan-Breslow-Wilcoxon test. *p < 0.05, **p < 0.01, ***p < 0.001, ****p < 0.0001. n = 10 mice per group. Error bars indicate ± SEM.

References

    1. Pardoll D.M. The blockade of immune checkpoints in cancer immunotherapy. Nat. Rev. Cancer. 2012;12:252–264. - PMC - PubMed
    1. Riley J.L. PD-1 signaling in primary T cells. Immunol. Rev. 2009;229:114–125. - PMC - PubMed
    1. Walunas T.L., Bluestone J.A. CTLA-4 regulates tolerance induction and T cell differentiation in vivo. J. Immunol. 1998;160:3855–3860. - PubMed
    1. Anderson A.C. Tim-3: an emerging target in the cancer immunotherapy landscape. Cancer Immunol. Res. 2014;2:393–398. - PubMed
    1. Duraiswamy J., Kaluza K.M., Freeman G.J., Coukos G. Dual blockade of PD-1 and CTLA-4 combined with tumor vaccine effectively restores T-cell rejection function in tumors. Cancer Res. 2013;73:3591–3603. - PMC - PubMed

Publication types

MeSH terms

Cite

AltStyle によって変換されたページ (->オリジナル) /