This site needs JavaScript to work properly. Please enable it to take advantage of the complete set of features!
Skip to main page content
U.S. flag

An official website of the United States government

Dot gov

The .gov means it’s official.
Federal government websites often end in .gov or .mil. Before sharing sensitive information, make sure you’re on a federal government site.

Https

The site is secure.
The https:// ensures that you are connecting to the official website and that any information you provide is encrypted and transmitted securely.

NIH NLM Logo
Log in
Access keys NCBI Homepage MyNCBI Homepage Main Content Main Navigation
Comparative Study
. 2018 Jan;3(1):108-120.
doi: 10.1038/s41564-017-0056-8. Epub 2017 Nov 6.

Viral and cellular N6-methyladenosine and N6,2'-O-dimethyladenosine epitranscriptomes in the KSHV life cycle

Affiliations
Comparative Study

Viral and cellular N6-methyladenosine and N6,2'-O-dimethyladenosine epitranscriptomes in the KSHV life cycle

Brandon Tan et al. Nat Microbiol. 2018 Jan.

Abstract

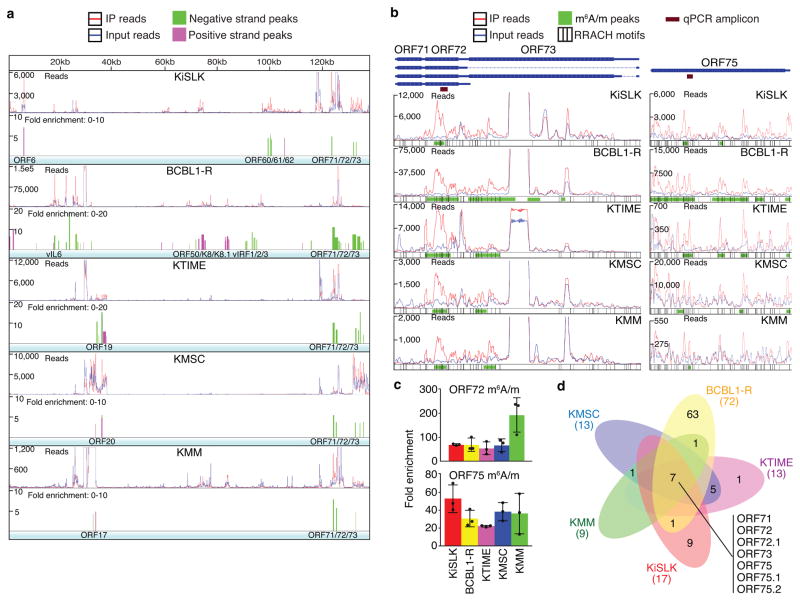
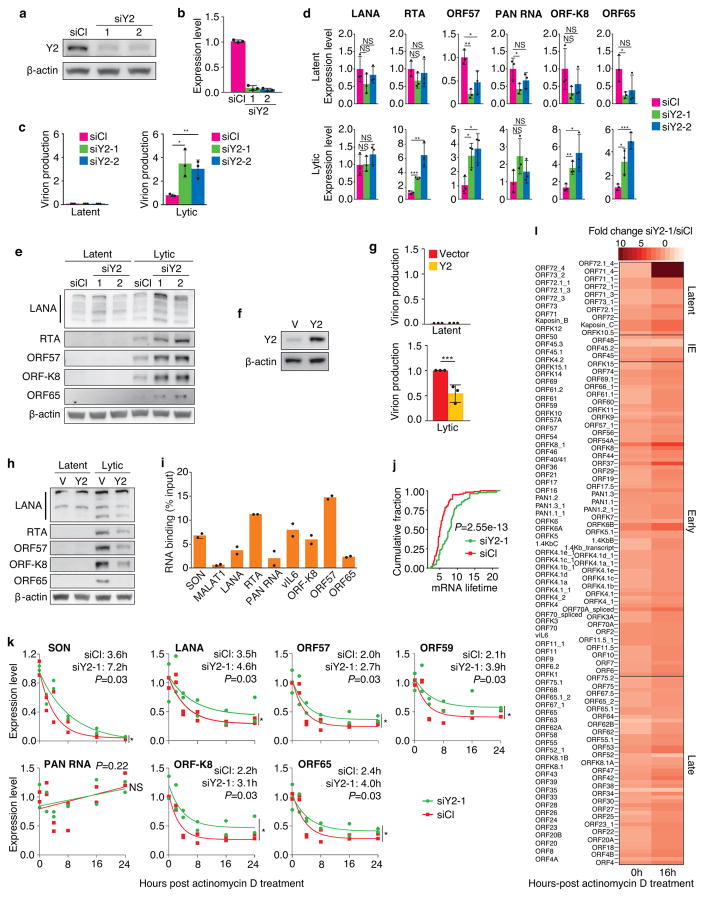
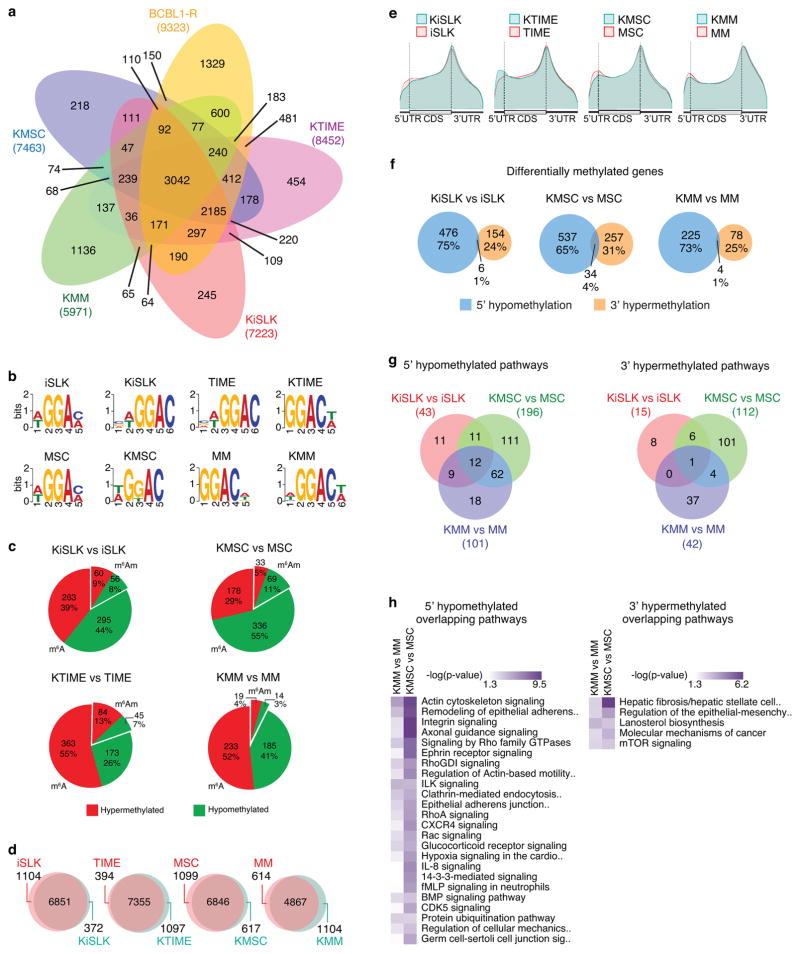
N6-methyladenosine (m6A) and N6,2'-O-dimethyladenosine (m6Am) modifications (m6A/m) of messenger RNA mediate diverse cellular functions. Oncogenic Kaposi's sarcoma-associated herpesvirus (KSHV) has latent and lytic replication phases that are essential for the development of KSHV-associated cancers. To date, the role of m6A/m in KSHV replication and tumorigenesis is unclear. Here, we provide mechanistic insights by examining the viral and cellular m6A/m epitranscriptomes during KSHV latent and lytic infection. KSHV transcripts contain abundant m6A/m modifications during latent and lytic replication, and these modifications are highly conserved among different cell types and infection systems. Knockdown of YTHDF2 enhanced lytic replication by impeding KSHV RNA degradation. YTHDF2 binds to viral transcripts and differentially mediates their stability. KSHV latent infection induces 5' untranslated region (UTR) hypomethylation and 3'UTR hypermethylation of the cellular epitranscriptome, regulating oncogenic and epithelial-mesenchymal transition pathways. KSHV lytic replication induces dynamic reprogramming of epitranscriptome, regulating pathways that control lytic replication. These results reveal a critical role of m6A/m modifications in KSHV lifecycle and provide rich resources for future investigations.


Conflict of interest statement

Competing interests

The authors declare no competing financial interests.

Figures

Figure 1
Figure 1. KSHV m6A/m epitranscriptome during viral latent infection
a, Transcriptome-wide maps of KSHV m6A/m-IP reads, input reads, and m6A/m peaks in KiSLK, BCBL1-R, KTIME, KMSC, and KMM cells latently infected by KSHV. Selected genes containing m6A/m peaks are listed below each track. Reads were normalized to KiSLK for ease of comparison. b, Enlarged regions of ORF71, ORF72 and ORF73 (left), and ORF75 (right) from (a) containing the positions of qPCR amplicons and RRACH motifs. c, Validation of m6A/m peaks in ORF72 and ORF75 by MeRIP-qPCR. Fold enrichment was determined by calculating the fold change of IP to input Ct values. Experiments were independently repeated three times, and results are presented as mean +/− SD from the three experiments. d, Venn diagram showing the overlaps of methylated viral genes in all latently infected cells.
Figure 2
Figure 2. KSHV m6A/m epitranscriptome during viral lytic replication
a, Transcriptome-wide maps of KSHV m6A/m-IP reads, input reads, and m6A/m peaks in KiSLK cells before (latent) and after induction for lytic replication for 24 h or 48 h, and in BCBL1-R cells before (latent) and after induction for lytic replication for 48 h. Selected genes containing m6A/m peaks are listed below each track. The latent datasets were reproduced from Fig. 1a for ease of comparison with the lytic datasets. Reads were normalized to KiSLK latent for ease of comparison. b, Enlarged regions of ORF71, ORF72, ORF73, RTA, ORF-K8, ORF-K8.1, ORF-K1, ORF4, ORF6, ORF-K3, ORF70, ORF8, ORF9, ORF10, ORF11, and ORF57 containing the positions of qPCR amplicons and RRACH motifs. c, Validation of m6A/m peaks by MeRIP-qPCR. Fold enrichment was determined by calculating the fold change of IP to input Ct values. Experiments were independently repeated three times, and results are presented as mean +/− SD from the three experiments. d, Venn diagrams comparing the number of methylated viral genes before (latent) and after induction for lytic replication in KiSLK (left) and BCBL1-R (right) cells. e, Comparison of methylated genes at 48 h after induction for lytic replication between KiSLK and BCBL1-R cells.
Figure 3
Figure 3. Silencing of YTHDF2 enhances KSHV lytic replication
a,b, Knockdown of YTHDF2 shown at the protein (a) and mRNA (b) levels in KiSLK cells at day 2 post-transfection of siRNAs. c–e, Quantification of KSHV virions in culture supernatant by qPCR (c), and levels of viral transcripts (d) and proteins (e) were examined by RT-qPCR and Western-blotting, respectively, at day 3 after induction of lytic replication. Experiments were independently repeated three times, and results are presented as mean +/− SD from the three experiments (b–d) except (a,e) where representative results from one experiment are presented. NS = not significant, * p<0.05, ** p<0.01, *** p<0.001. f, YTHDF2 overexpression in KiSLK cells two days after lentiviral transduction. g,h, Quantification of KSHV virions in culture supernatant by qPCR (g), and levels of viral proteins (h) were examined by Western-blotting at day 3 after induction of lytic replication. Experiments were independently repeated three times, and results are presented as mean +/− SD from the three experiments (g) except (f,h) where representative results from one experiment are presented. i, KiSLK cells overexpressing Flag-YTHDF2 were induced for lytic replication and cell lysate was collected at 48 h to detect YTHDF2 binding of viral RNAs by RIP-qPCR. SON and MALAT1 are cellular positive and negative controls, respectively. Experiments were independently repeated twice, and results are presented as mean from the two experiments. j, Lifetimes of KSHV transcripts were measured in cells transfected with YTHDF2 siRNA (siY2-1) or a control siRNA (siCl). Results are from two independent experiments. k, Quantification of levels of viral and cellular transcripts following treatment with actinomycin D at day 3 after induction of lytic replication in KiSLK cells transfected with an YTHDF2 siRNA (siY2-1) or a control siRNA (siCl). The half-lives of the transcripts in hours were calculated. Experiments were independently repeated twice, and results are presented as mean +/− SD from the two experiments. l, Fold changes of KSHV transcripts in cells transfected with YTHDF2 siRNA (siY2-1) and control siRNA (siCl) at 0 h and 16 h post-actinomycin D treatment sorted by transcript class. Results are from two independent experiments.
Figure 4
Figure 4. Reprograming of cellular m6A/m epitranscriptome during KSHV latency
a, Venn diagram showing the overlaps of methylated cellular genes in all five types of cells latently infected by KSHV. b, Most significant motifs in cellular m6A/m peaks identified by MEME in uninfected cells and cells latently infected by KSHV. c, The predicted proportions of m6A and m6Am methylated transcripts, and the percentages of hypermethylated and hypomethylated genes. d, Comparison of cellular m6A/m genes in different pairs of uninfected cells and cells latently infected by KSHV. e, Distribution of cellular m6A/m peaks on transcripts in different pairs of uninfected cells and cells latently infected by KSHV as plotted by the Guitar software package. f, Comparisons between cellular 5′ hypomethylated genes and 3′ hypermethylated genes in different pairs of uninfected cells and cells latently infected by KSHV. g, Venn diagram showing overlaps of significantly enriched pathways of cellular 5′ hypomethylated genes (top) and 3′ hypermethylated genes (bottom) as a result of KSHV latent infection in different types of cells. h, Heat maps of significantly enriched pathways of 5′ hypomethylated genes (left) and 3′ hypermethylated genes (right) sorted by P-values as a result of KSHV latent infection in different types of cells. The results are from three biological replicates.
Figure 5
Figure 5. Reprograming of cellular m6A/m epitranscriptome during KSHV lytic replication
a, Venn diagram comparing the number of methylated cellular genes before (latent) and after induction for lytic replication in KiSLK (left) and BCBL1-R (right) cells. b, Comparison of methylated cellular genes between KiSLK and BCBL1-R cells during latency (left) and lytic replication (right) at 48 h after induction. c, Most significant motifs in cellular m6A/m peaks identified by MEME in latent and lytic KiSLK and BCBL1-R cells. The latent KiSLK motifs are the same as in Fig. 4b and are replicated in this panel for ease of comparison. d, Distribution of cellular m6A/m peaks on transcripts in latent vs lytic cells in KiSLK cells (left) and BCBL1-R cells (right) as plotted by the Guitar software package. e, Comparison of significantly enriched pathways of cellular genes that are hypermethylated (left) or hypomethylated (right) as a result of reactivation from latency in KiSLK and BCBL1-R cells. f, Heat map of conserved hypermethylated pathways between KiSLK and BCBL1-R cells sorted by P-value. g, Heat map of conserved hypomethylated pathways between KiSLK and BCBL1-R cells sorted by P-value. h, The proportions of m6A and m6Am methylated transcripts, and the percentages of hypermethylated and hypomethylated genes. The results are from three biological replicates.

References

    1. Ye F, Lei X, Gao SJ. Mechanisms of Kaposi’s Sarcoma-Associated Herpesvirus Latency and Reactivation. Adv Virol. 2011;2011 doi: 10.1155/2011/193860. - DOI - PMC - PubMed
    1. Desrosiers R, Friderici K, Rottman F. Identification of methylated nucleosides in messenger RNA from Novikoff hepatoma cells. Proc Natl Acad Sci USA. 1974;71:3971–3975. - PMC - PubMed
    1. Dominissini D, et al. Topology of the human and mouse m6A RNA methylomes revealed by m6A-seq. Nature. 2012;485:201–206. doi: 10.1038/nature11112. - DOI - PubMed
    1. Meyer KD, et al. Comprehensive analysis of mRNA methylation reveals enrichment in 3′ UTRs and near stop codons. Cell. 2012;149:1635–1646. doi: 10.1016/j.cell.201205003. - DOI - PMC - PubMed
    1. Linder B, et al. Single-nucleotide-resolution mapping of m6A and m6Am throughout the transcriptome. Nat Meth. 2015;12:767–772. doi: 10.1038/nmeth.3453. - DOI - PMC - PubMed

Publication types

MeSH terms

Cite

AltStyle によって変換されたページ (->オリジナル) /