Modeling the environmental suitability of anthrax in Ghana and estimating populations at risk: Implications for vaccination and control
- PMID: 29028799
- PMCID: PMC5656412
- DOI: 10.1371/journal.pntd.0005885
Modeling the environmental suitability of anthrax in Ghana and estimating populations at risk: Implications for vaccination and control
Abstract
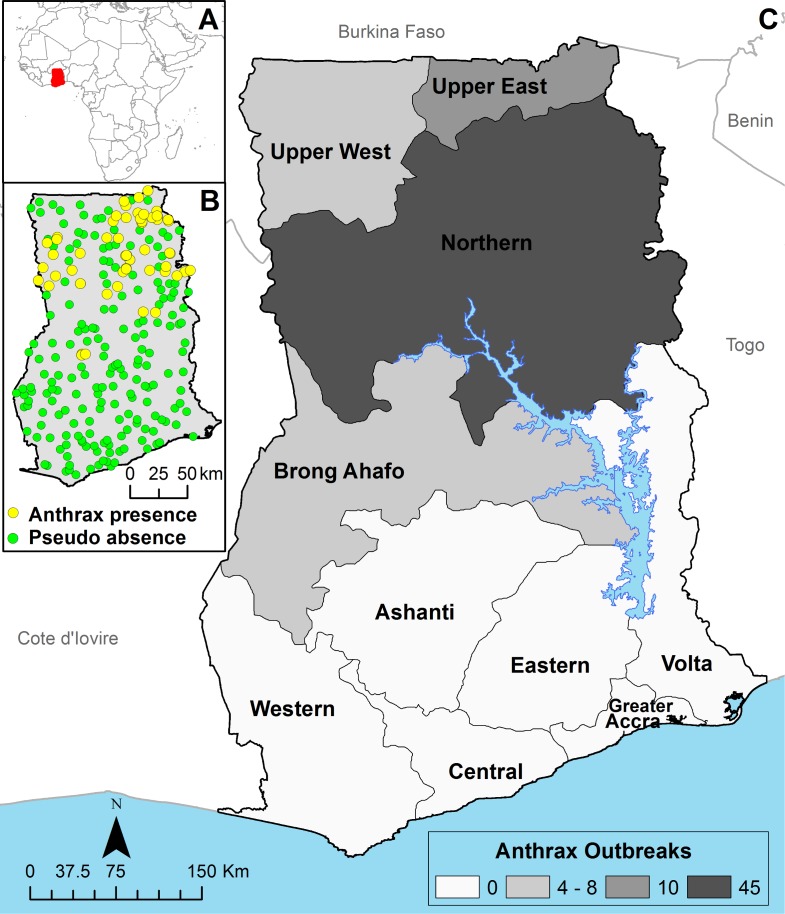
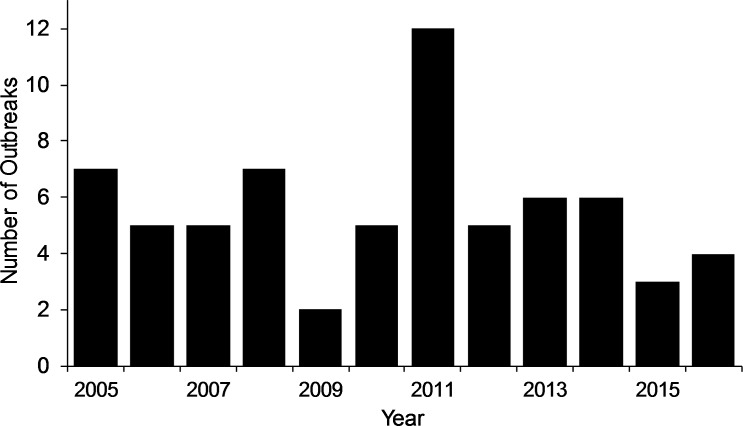
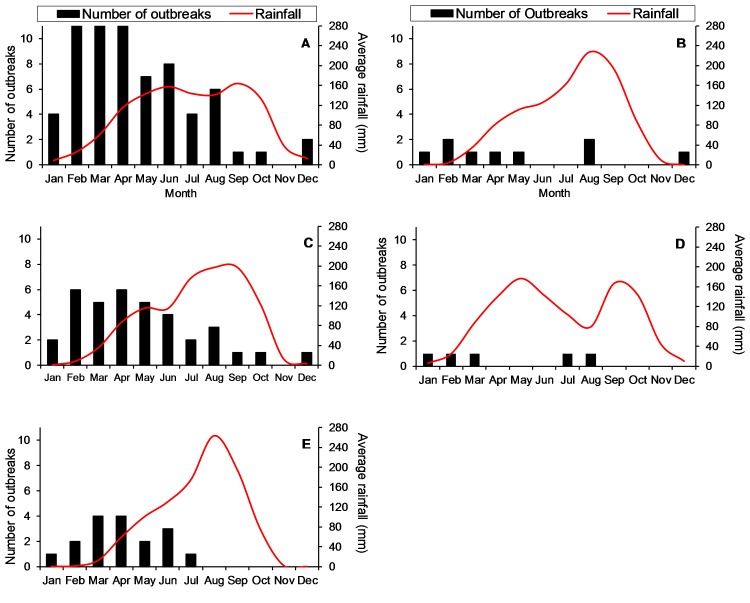
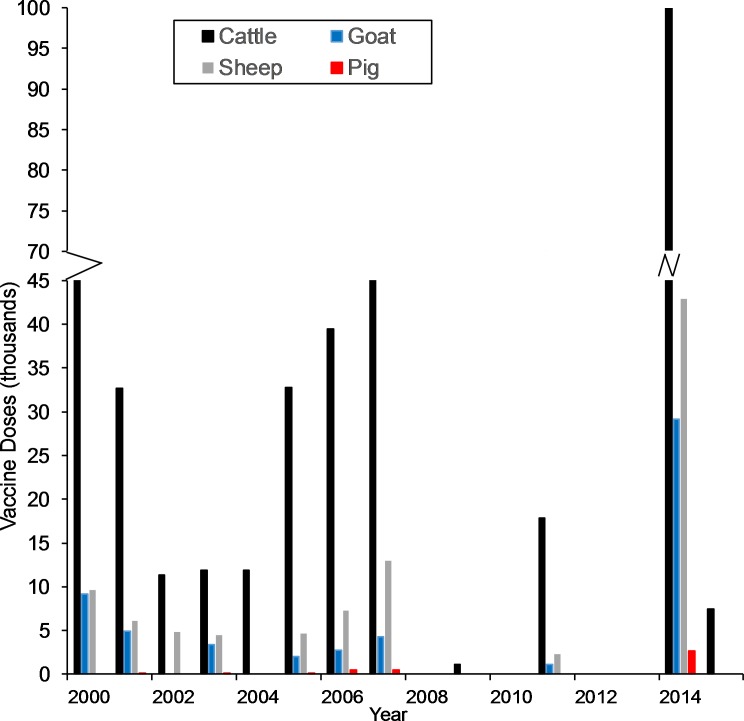
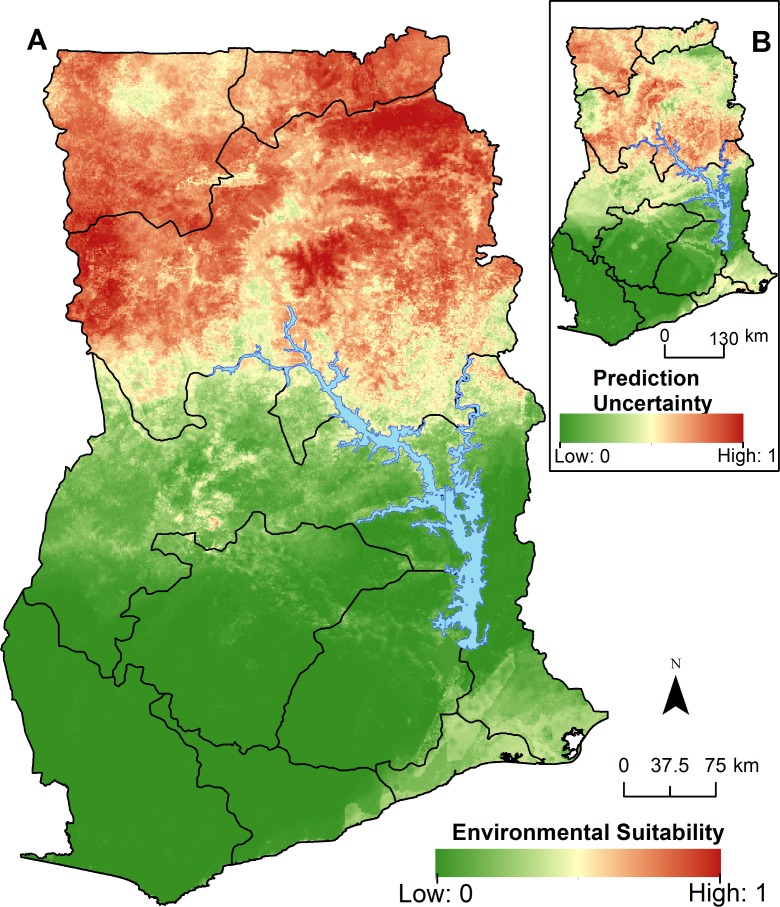
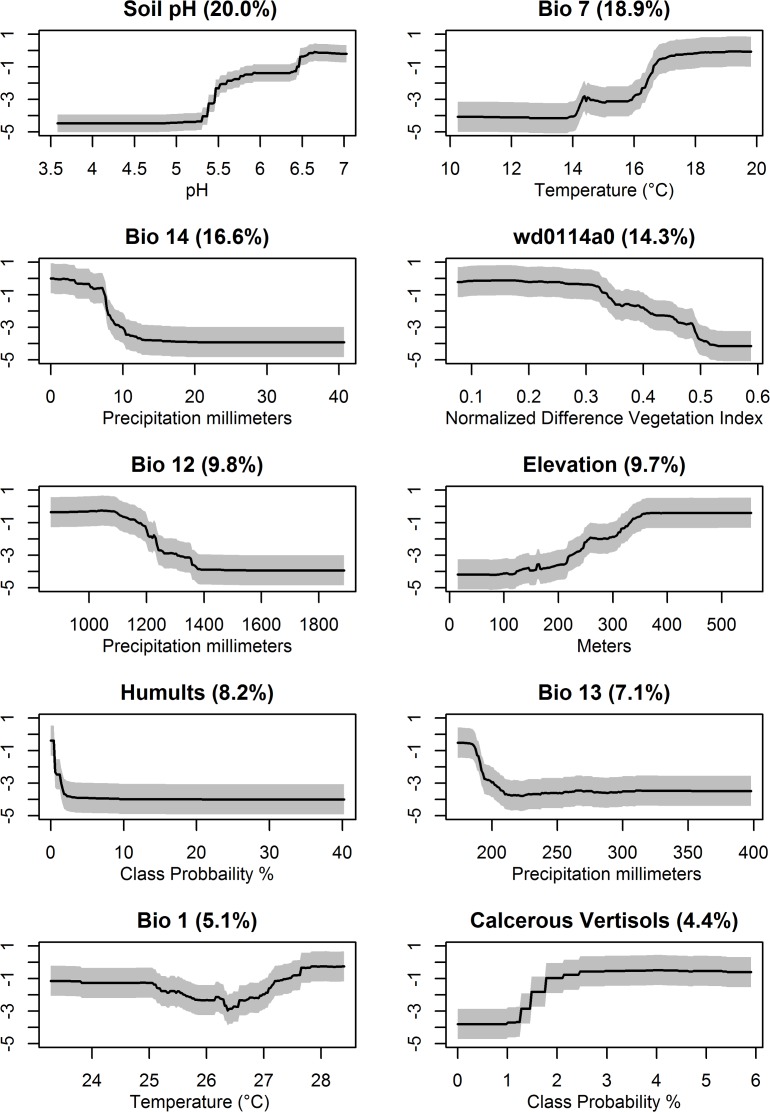
Anthrax is hyper-endemic in West Africa. Despite the effectiveness of livestock vaccines in controlling anthrax, underreporting, logistics, and limited resources makes implementing vaccination campaigns difficult. To better understand the geographic limits of anthrax, elucidate environmental factors related to its occurrence, and identify human and livestock populations at risk, we developed predictive models of the environmental suitability of anthrax in Ghana. We obtained data on the location and date of livestock anthrax from veterinary and outbreak response records in Ghana during 2005-2016, as well as livestock vaccination registers and population estimates of characteristically high-risk groups. To predict the environmental suitability of anthrax, we used an ensemble of random forest (RF) models built using a combination of climatic and environmental factors. From 2005 through the first six months of 2016, there were 67 anthrax outbreaks (851 cases) in livestock; outbreaks showed a seasonal peak during February through April and primarily involved cattle. There was a median of 19,709 vaccine doses [range: 0-175 thousand] administered annually. Results from the RF model suggest a marked ecological divide separating the broad areas of environmental suitability in northern Ghana from the southern part of the country. Increasing alkaline soil pH was associated with a higher probability of anthrax occurrence. We estimated 2.2 (95% CI: 2.0, 2.5) million livestock and 805 (95% CI: 519, 890) thousand low income rural livestock keepers were located in anthrax risk areas. Based on our estimates, the current anthrax vaccination efforts in Ghana cover a fraction of the livestock potentially at risk, thus control efforts should be focused on improving vaccine coverage among high risk groups.
Conflict of interest statement
The authors have declared that no competing interests exist.
Figures
References
-
- Turnbull P, Böhm R, Hugh-Jones M, Melling J. Guidelines for the Surveillance and Control of Anthrax in Humans and Animals, Fourth Edition. 2008; 219.
-
- Fasanella A, Galante D, Garofolo G, Jones MH. Anthrax undervalued zoonosis. Vet Microbiol. 2010;140: 318–331. doi: 10.1016/j.vetmic.2009年08月01日6 - DOI - PubMed
-
- Blackburn J, McNyset K, Curtis A, Hugh-Jones M. Modeling the geographic distribution of Bacillus anthracis, the causative agent of anthrax disease, for the contiguous United States using predictive ecologic niche modeling. Am J Trop Med Hyg. 2007;77: 1103 - PubMed
-
- Hugh-Jones M, Blackburn J. The ecology of Bacillus anthracis. Mol Aspects Med. 2009;30: 356–367. doi: 10.1016/j.mam.200908003 - DOI - PubMed
-
- Food and Agriculture Organization of the United Nations, Great Britain, Department for International Development, Animal Health Programme, International Office of Epizootics, World Health Organization, et al. The Control of neglected zoonotic diseases: a route to poverty alleviation: report of a joint WHO/DFID-AHP meeting, 20 and 21 September 2005, WHO Headquarters, Geneva, with the participation of FAO and OIE. Geneva, Switzerland: World Health Organization; 2006.
MeSH terms
Substances
LinkOut - more resources
Full Text Sources
Other Literature Sources
Medical
Miscellaneous