This site needs JavaScript to work properly. Please enable it to take advantage of the complete set of features!
Skip to main page content
U.S. flag

An official website of the United States government

Dot gov

The .gov means it’s official.
Federal government websites often end in .gov or .mil. Before sharing sensitive information, make sure you’re on a federal government site.

Https

The site is secure.
The https:// ensures that you are connecting to the official website and that any information you provide is encrypted and transmitted securely.

NIH NLM Logo
Log in
Access keys NCBI Homepage MyNCBI Homepage Main Content Main Navigation
. 2017 Nov;97(5):1378-1392.
doi: 10.4269/ajtmh.16-0305. Epub 2017 Oct 10.

Analysis of Health Indicators in Two Rural Communities on the Colombian Caribbean Coast: Poor Water Supply and Education Level Are Associated with Water-Related Diseases

Affiliations

Analysis of Health Indicators in Two Rural Communities on the Colombian Caribbean Coast: Poor Water Supply and Education Level Are Associated with Water-Related Diseases

María Stephany Ruiz-Díaz et al. Am J Trop Med Hyg. 2017 Nov.

Abstract

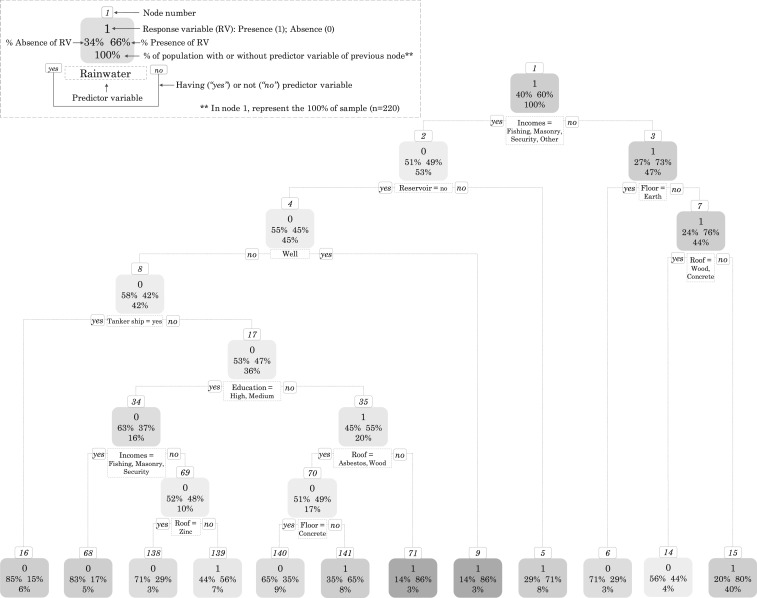
Water-related diseases are closely linked with drinking water, sanitation, and hygiene (WASH) indicators, socioeconomic status, education level, or dwelling's conditions. Developing countries exhibit a particular vulnerability to these diseases, especially rural areas and urban slums. This study assessed socioeconomic features, WASH indicators, and water-related diseases in two rural areas of the Colombian Caribbean coast. Most of this population did not finish basic education (72.3%, N = 159). Only one of the communities had a water supply (aqueduct), whereas the other received water via an adapted tanker ship. No respondents reported sewage services; 92.7% (N = 204) had garbage service. Reported cases of diarrhea were associated with low education levels (P = 2.37 ×ばつ 10-9) and an unimproved drinking water supply (P = 0.035). At least one fever episode was reported in 20% (N = 44) of dwellings, but the cases were not related to any indicator. The Aedes/House index (percentage of houses that tested positive for Aedes larvae and/or pupae) was 69%, the container index (percentage of water-holding containers positive for Aedes larvae or pupae) 29.4%, and the Breteau index (number of positive containers per 100 houses in a specific location) was three positive containers per 100 inspected houses. The presence of positive containers was associated with the absence of a drinking water supply (P = 0.04). The community with poorer health indicators showed greater health vulnerability conditions for acquisition of water-related diseases. In summary, water supply and educational level were the main factors associated with the presence of water-related diseases in both communities.


Figures

Figure 1.
Figure 1.
The map shows the location of the communities in Ararca and Barú, close to urban areas of Cartagena de Indias.
Figure 2.
Figure 2.
(A) Ages of the different groups taking the education grade into account: none, incomplete elementary school, completed elementary school, incomplete high school, completed high school, technical, technologist, university education (P < 2.2 ×ばつ 10−16). (B) AG = agriculture; BE = beautician; CS = clean services; CAR = carpentry; ES = electricity services; EDU = education; FIS = fishing; MS = mechanical services; MA = masonry; RE = retired; SS = security services; TOU = tourism; TR = trading; TRA = transportation services; UM = unemployed; VS = various services. In this figure, average ages according to occupation are shown (P = 0.0369).
Figure 3.
Figure 3.
(100%, N = 220). A decision tree graph that shows what predictor variables have the greatest influence on the response variable: presence (1) or absence (0) of diarrhea cases in the population. As shown in the upper box, the numbers placed on top of each charts refers to main generated nodes during the building of the tree. Each node is a cluster that is created by taking into account the included predictor variables in the model; in this case, those related with socioeconomic states, public services supply, and general household conditions, with their different categories or subclasses as have been described in the tables of this document. The alternatives that emerge from each node represent partitions of an initial cluster: from one side emerges a group in which the predictor variable of this node is present ("yes"), whereas from the other side, emerges a cluster in which it is absent ("no"). Thus, the two percentages located in the middle of the boxes represent the probabilities for response variable (e.g., diarrhea) according to every cluster features. Example: In node 1, of the 220 analyzed cases, 74 (34%) have not the response variable described in the node ("1"; presence of diarrhea case) and the remaining 146 (66%) do have it. The tree shows that predictor variables with the greatest influence on the response variable in this case were rainwater, household income, material of walls, and roof of the dwellings, and thereby, other variables including aqueduct service and the supply of garbage did not have enough influence to be in the generated tree. The subclasses of the predictors’ variables in each node have the same influence on response variable, for example, material of walls: bricks or concrete, have the same effect, as well as, the roof’s material: wood, zinc, or concrete. Particularly, in this node (5), variables such as having a roof made of these materials (wood, zinc, or concrete) was related with the absence of diarrhea cases, and this trend continues if incomes come from occupations such as tourism or trade; otherwise the disease occurs.
Figure 4.
Figure 4.
(100%, N = 220). Representation of variables related to the absence (0) or presence (1) of cases of fever in both communities. This tree, like the one shown in Figure 3, shows the main predictor variables that influence the response variable—in these cases, the presence or absence of fever cases. In the model variables related to socioeconomic states, public services supply and general household conditions were included. The subclasses of predictor variable that take the model into account have the same influence in the response variable. In this graphic, variables such as having roofs not made of materials like bricks, asbestos, or wood (see node 27) and other variables such as not having incomes from masonry, security services, or trade (see node 7), could favor the presence of fever cases.
Figure 5.
Figure 5.
(100%, N = 220). The figure shows the main variables related to the presence (1) or absence (0) of Aedes larvae in the included households. As in Figures 3 and 4, in this model also variables related to socioeconomic states, public services supply, and general household conditions were also included. In this tree, variables such as not using water taken from reservoirs (see node 2), wells (see node 4), or tanker ships (see node 8), have a high or medium education level (university education, technologist, technical, completed high school, did not complete high school) (see node 17), and incomes through fishing, masonry, or security services (see node 34), help to decrease the positive cases of Aedes larvae in the households.

References

    1. Mor SM, Griffiths JK, 2011. Water-related diseases in the developing world. Nriagu JO, ed. Encyclopedia of Environmental Health. Burlington, MA: Elsevier, 741–753.
    1. Griffiths JK, 2008. Waterborne diseases. Heggenhougen HK, ed. International Encyclopedia of Public Health. Oxford, United Kingdom: Academic Press, 551–563.
    1. Epstein PR, 2001. Climate change and emerging infectious diseases. Microbes Infect 3: 747–754. - PubMed
    1. World Health Organization , UNICEF , 2015. Progress on Sanitation and Drinking-Water: 2015 Update and MDG Assessment. Geneva, Switzerland: World Health Organization.
    1. Prüss-Üstün A, et al. 2014. Burden of disease from inadequate water, sanitation and hygiene in low- and middle-income settings: a retrospective analysis of data from 145 countries. Trop Med Int Health 19: 894–905. - PMC - PubMed

MeSH terms

Cite

AltStyle によって変換されたページ (->オリジナル) /