This site needs JavaScript to work properly. Please enable it to take advantage of the complete set of features!
Skip to main page content
U.S. flag

An official website of the United States government

Dot gov

The .gov means it’s official.
Federal government websites often end in .gov or .mil. Before sharing sensitive information, make sure you’re on a federal government site.

Https

The site is secure.
The https:// ensures that you are connecting to the official website and that any information you provide is encrypted and transmitted securely.

NIH NLM Logo
Log in
Access keys NCBI Homepage MyNCBI Homepage Main Content Main Navigation
. 2017 Sep 25;11(9):e0005924.
doi: 10.1371/journal.pntd.0005924. eCollection 2017 Sep.

New insights into experimental visceral leishmaniasis: Real-time in vivo imaging of Leishmania donovani virulence

Affiliations

New insights into experimental visceral leishmaniasis: Real-time in vivo imaging of Leishmania donovani virulence

Guilherme D Melo et al. PLoS Negl Trop Dis. .

Abstract

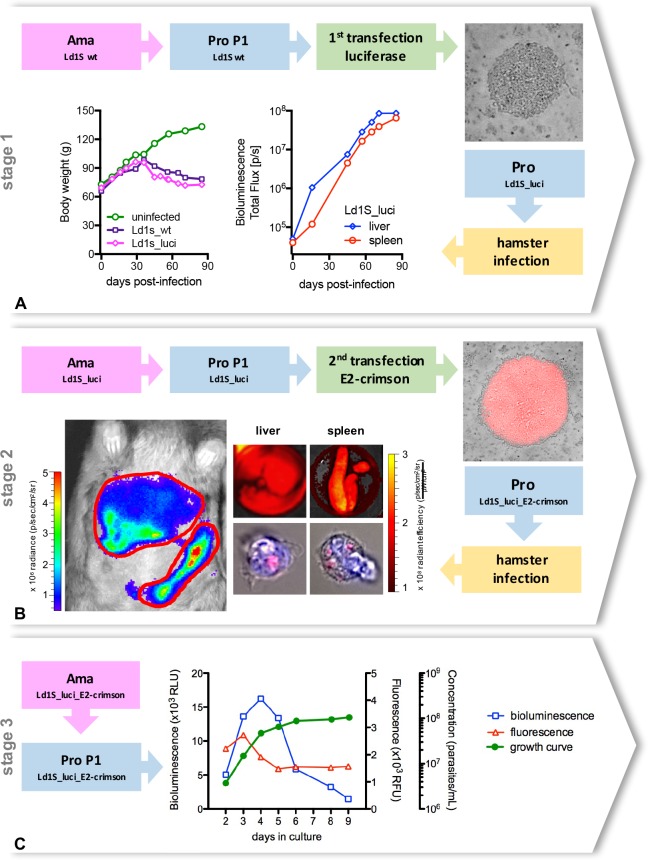
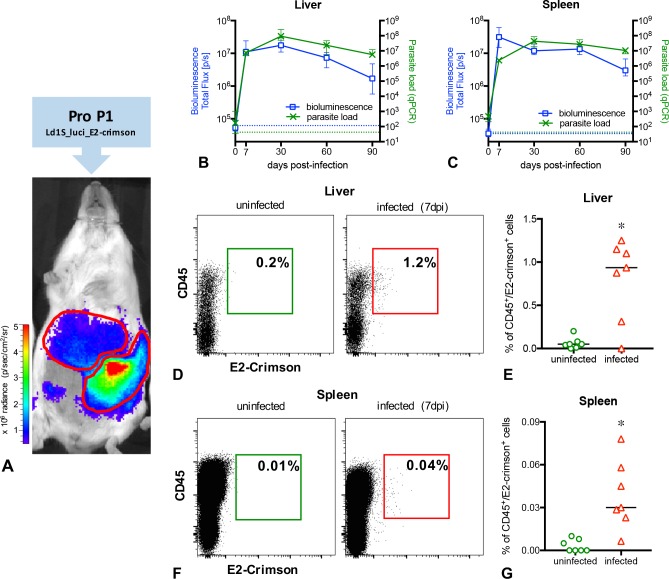
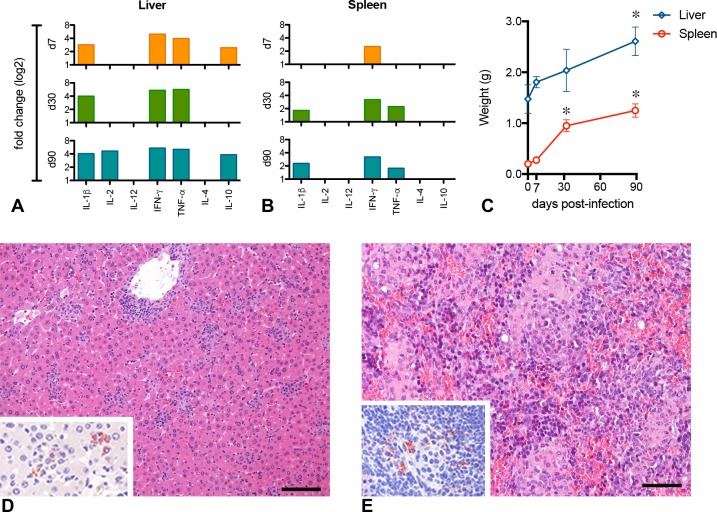
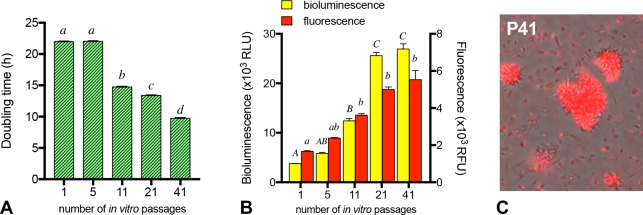
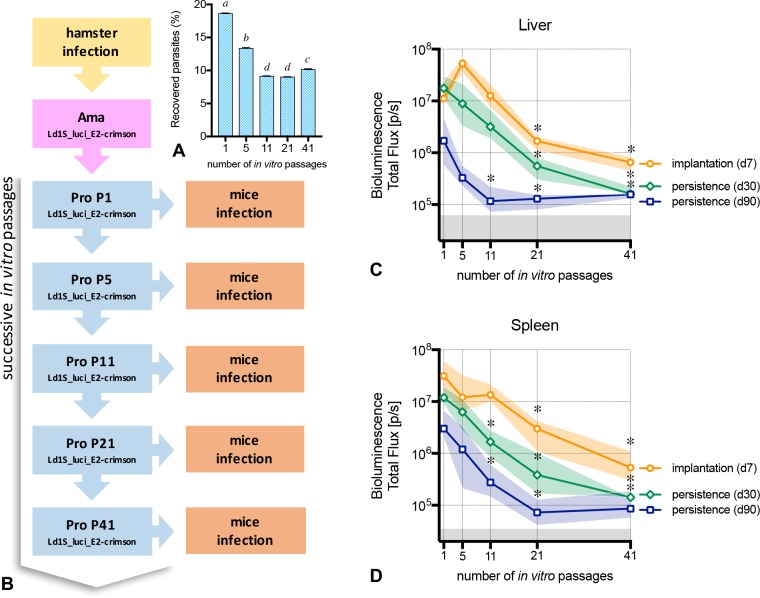
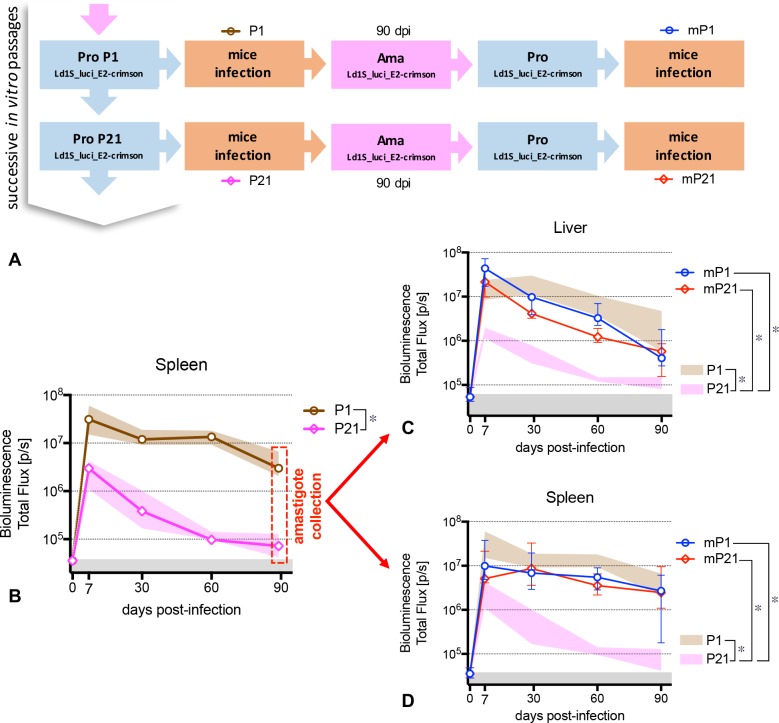
Visceral leishmaniasis is an insidious neglected disease with worldwide distribution. It is caused by parasites from the Leishmania donovani complex, which are able to be transmitted by different species of phlebotomine sand flies and to infect numerous mammal hosts. Despite the high number of people infected or at risk, and the remarkable quantity of studies focusing on this disease, a proper experimental model to efficiently decipher the infectious process of visceral leishmaniasis taking into account the nuances of parasite’s virulence and the duration of the infection is still lacking. Therefore, using golden Syrian hamsters and BALB/c mice, state-of-the-art genetic manipulation applied on a fully virulent L. donovani strain and in vivo imaging approaches, we describe herein three benefits for experimental visceral leishmaniasis: (i) the development of a double transfected bioluminescent (firefly luciferase) and fluorescent (E2-crimson) virulent strain of L. donovani (Ld1S_luci_E2-crimson), favoring a wide range of both in vivo and in vitro investigations, (ii) the establishment of a non-invasive mouse model to evaluate the infectious process during visceral leishmaniasis and the parasite’s virulence in real time, allowing longitudinal studies with the same animals, and (iii) the elaboration of a suitable method to reinstate (and verify anew) the virulence in a population of attenuated parasites, by recovering persistent parasites from chronic infected mice. Consequently, these results open up new perspectives on the study of visceral leishmaniasis, especially in the fields of therapeutics and vaccinology, since the model described herein renders now possible long-lasting follow up studies, with easy and accurate day-by-day verifications of the infection status along with a reduced number of laboratory animals.

Trial registration: ClinicalTrials.gov 2013-0047.


Conflict of interest statement

The authors have declared that no competing interests exist.

Figures

Fig 1
Fig 1. Generation of double transfected Leishmania donovani parasites.
(A) The first stage of the transfection aimed to generate bioluminescent parasites. Wild-type amastigotes from the Ld1S strain obtained from hamster spleen were transformed into promastigotes, then transfected with the luciferase gene and cloned in M199-agar dishes containing 150 μg/mL hygromycin. Positive colonies (top right corner) were selected, added to liquid M199 medium and promastigotes were cultivated until differentiation into metacyclic promastigotes in order to proceed with a hamster infection. Weight gain of the hamster infected with ‘Ld1S_luci’, in comparison with an uninfected hamster and with a hamster infected with wild-type amastigotes (Ld1s_wt) (bottom left). In vivo bioluminescence values in the liver and in the spleen of the hamster infected with ‘Ld1S_luci’ (bottom middle). (B) The second stage of the transfection aimed to generate fluorescent parasites. ‘Ld1S_luci’ amastigotes were obtained from the hamster spleen, transformed into promastigotes, transfected with the E2-crimson gene and cloned in M199-agar dishes containing 50 μg/mL of nourseothricin. Fluorescent colonies (top right corner) were selected, added to liquid M199 medium and promastigotes were cultivated until differentiation into metacyclic promastigotes in order to proceed with a hamster infection with ‘Ld1S_luci_E2-crimson’. Hamster in vivo bioluminescence imaging (bottom left, and S1 Fig) and simultaneous ex vivo analyses of fluorescence in the liver and in the spleen at day 90 post-infection (top middle panels). Red fluorescent parasites are also detectable in the cytoplasm of isolated hamster cells (nuclei counterstained with DAPI) (bottom middle panels). (C) ‘Ld1S_luci_E2-crimson’ amastigotes were obtained from the hamster spleen and transformed into promastigotes, considered then the first passage of promastigotes (P1). Bioluminescence (left y-axis) and fluorescence (first right y-axis) values, as well as the growth curve (second right y-axis) obtained from P1 ‘Ld1S_luci_E2-crimson’ promastigotes cultivated in vitro are shown in the graph.
Fig 2
Fig 2. In vivo and ex vivo determination of the parasite load in BALB/c mice infected with P1 ‘Ld1S_luci_E2-crimson’.
(A) In vivo imaging of a representative infected mouse exhibiting positive bioluminescent signals in the liver and in the spleen. (BC) Follow-up of the infection in the liver (B) and in the spleen (C) using in vivo bioluminescence (left y-axis) and RT-qPCR (right y-axis) at different time points post-infection. Representative data of 50 infected mice, from four independent infection groups. Data are expressed as the median and the interquartile range. The dotted blue lines correspond to background signals for bioluminescence, and the dotted green lines correspond to background values for RT-qPCR. (DG) Flow cytometry analysis of liver and spleen cells from mice, using the markers CD45 (leukocytes) and E2-crimson (Ld1S_luci_E2-crimson). Representative dot plots and variations of CD45+E2-crimson+ cells in the liver (DE) and in the spleen (FG) of uninfected and infected mice at day 7 p.i. (* indicates P<0.05).
Fig 3
Fig 3. Inflammatory response in BALB/c mice infected with P1 ‘Ld1S_luci_E2-crimson’.
Inflammatory response assessment in the liver (A) and spleen (B) of BALB/c mice infected with Leishmania donovani. The relative gene expression of cytokines in the liver and spleen is expressed as fold change (up-regulation) for each time point post-infection. Bars represent statistically significant changes (P<0.05). (C) Follow-up of liver and spleen weight at different time points post-infection. Data are expressed as the median and the interquartile range (* time points differ significantly in comparison to day 0; P<0.05). (DE) Histopathological analysis of liver and spleen at 90 days p.i. (D) Liver with granulomas and scattered intracellular parasites (inset; immunoperoxidase). (E) Spleen presenting remarkable alterations in its architecture, with an important amount of mononuclear cells infiltration and parasites (inset; immunoperoxidase). Hematoxylin and eosin. Scale bars = 100 μm.
Fig 4
Fig 4. Effect of serial in vitro passages on Leishmania donovani ‘Ld1S_luci_E2-crimson’ promastigotes performance.
(A) Doubling time at the exponential growth phase of in vitro cultures of different passage numbers: P1, P5, P11, P21 and P41 (abcd groups with no common superscript letter differ significantly; P<0.05). (B) Bioluminescence and fluorescence values of 1x10⁵ parasites taken from 2-days old in vitro cultures of different passage numbers: P1, P5, P11, P21 and P41. Columns represent the median values and the interquartile range (ABCabc groups with no common superscript capital letter differ significantly for bioluminescence, and groups with no common superscript small letter differ significantly for fluorescence; P<0.05). (C) Representative photomicrograph of P41 ‘Ld1S_luci_E2-crimson’ promastigotes to illustrate the constant expression of the red fluorescent protein.
Fig 5
Fig 5. ‘Ld1S_luci_E2-crimson’ infectivity after serial in vitro passages.
(A) Yield of enriched ‘metacyclic’ promastigotes recovered after the end of the stationary growing-phase, used to inoculate mice (abcd groups with no common superscript letter differ significantly; P<0.05). (B) Illustration of the sequential stages of the study. Following the collection of ‘Ld1S_luci_E2-crimson’ amastigotes from the hamster spleen, promastigotes were obtained and cultivated in vitro. The first in vitro passage of promastigotes (named P1) were used to infect mice and to start a sequence of successive in vitro passages of promastigotes, up to the 41st passage. At selected time points (P5, P11, P21 and P41), the promastigotes were allowed to expand until metacyclic promastigotes in order to infect mice. (CD) Five groups of mice were infected with enriched promastigotes obtained from five different in vitro passages and bioluminescence values in the liver (C) and in the spleen (D) were evaluated at day 7 p.i. in order to assess the parasite implantation, and at days 30 and 90 p.i. to verify the parasite persistence in the tissues. Lines represent the median and the colored shaded areas represent the interquartile range. The grey areas correspond to background signals (* time points differ significantly in comparison to passage 1; P<0.05).
Fig 6
Fig 6. Restoration of infectivity using in vivo mice passages.
(A) Scheme illustrating the sequential stages of the study. Following the collection of ‘Ld1S_luci_E2-crimson’ amastigotes from the hamster spleen, the successive in vitro passages of promastigotes and the infection of mice (see Fig 5B), amastigotes were recovered from the spleen of mice infected with P1 (named mP1) and from the spleen of mice infected with P21 (named mP21) at day 90 p.i., transformed in promastigotes and re-injected into naïve mice. (B) Parasite load kinetics in the spleen of mice infected with promastigotes P1 and P21. Lines represent the median and the colored shaded areas represent the interquartile range. The grey areas correspond to background signals (* AUCs from the infection kinetics differ significantly; P<0.05). At day 90 p.i., the mice were euthanized and the ‘persistent’ amastigotes were recovered from their respective spleens. (CD) Parasite load kinetics in the liver (C) and in the spleen (D) of mice infected with promastigotes mP1 and mP21, respectively. Lines represent the median and the interquartile range. The colored shaded areas represent the interquartile range of the original infection with P1 and P21 (see Fig 6B). The grey areas correspond to background signals (* AUCs from the infection kinetics differ significantly; P<0.05).

References

    1. WHO (2010) Control of the leishmaniasis: report of a meeting of the WHO Expert Committee on the Control of Leishmaniases, Geneva, 22–26 March 2010. WHO Technical Report No. 949.
    1. Alvar J, Vélez ID, Bern C, Herrero M, Desjeux P, et al. (2012) Leishmaniasis Worldwide and Global Estimates of Its Incidence. PLoS ONE 7: e35671 doi: 10.1371/journal.pone.0035671 - DOI - PMC - PubMed
    1. Baneth G, Koutinas AF, Solano-Gallego L, Bourdeau P, Ferrer L (2008) Canine leishmaniosis–new concepts and insights on an expanding zoonosis: part one. Trends in Parasitology 24: 324–330. doi: 10.1016/j.pt.200804001 - DOI - PubMed
    1. Fernández-Cotrina J, Iniesta V, Belinchón-Lorenzo S, Muñoz-Madrid R, Serrano F, et al. (2013) Experimental model for reproduction of canine visceral leishmaniosis by Leishmania infantum. Veterinary Parasitology 192: 118–128. doi: 10.1016/j.vetpar.201210002 - DOI - PubMed
    1. Melby PC, Chandrasekar B, Zhao W, Coe JE (2001) The Hamster as a Model of Human Visceral Leishmaniasis: Progressive Disease and Impaired Generation of Nitric Oxide in the Face of a Prominent Th1-Like Cytokine Response. The Journal of Immunology 166: 1912–1920. - PubMed

LinkOut - more resources

Cite

AltStyle によって変換されたページ (->オリジナル) /