This site needs JavaScript to work properly. Please enable it to take advantage of the complete set of features!
Skip to main page content
U.S. flag

An official website of the United States government

Dot gov

The .gov means it’s official.
Federal government websites often end in .gov or .mil. Before sharing sensitive information, make sure you’re on a federal government site.

Https

The site is secure.
The https:// ensures that you are connecting to the official website and that any information you provide is encrypted and transmitted securely.

NIH NLM Logo
Log in
Access keys NCBI Homepage MyNCBI Homepage Main Content Main Navigation
. 2017 Aug 29;7(1):9899.
doi: 10.1038/s41598-017-10292-3.

Quantitative proteome and phosphoproteome analyses highlight the adherent population during Trypanosoma cruzi metacyclogenesis

Affiliations

Quantitative proteome and phosphoproteome analyses highlight the adherent population during Trypanosoma cruzi metacyclogenesis

Juliana C Amorim et al. Sci Rep. .

Abstract

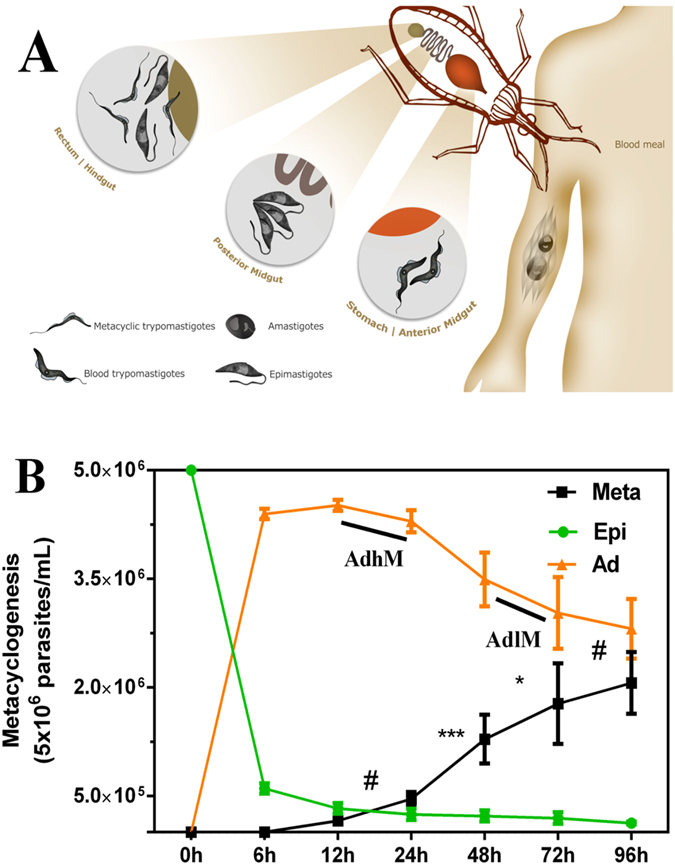
Trypanosoma cruzi metacyclogenesis is a natural process that occurs inside the triatomine vector and corresponds to the differentiation of non-infective epimastigotes into infective metacyclic trypomastigotes. The biochemical alterations necessary for the differentiation process have been widely studied with a focus on adhesion and nutritional stress. Here, using a mass spectrometry approach, a large-scale phospho(proteome) study was performed with the aim of understanding the metacyclogenesis processes in a quantitative manner. The results indicate that major modulations in the phospho(proteome) occur under nutritional stress and after 12 and 24 h of adhesion. Significant changes involve key cellular processes, such as translation, oxidative stress, and the metabolism of macromolecules, including proteins, lipids, and carbohydrates. Analysis of the signalling triggered by kinases and phosphatases from 7,336 identified phosphorylation sites demonstrates that 260 of these sites are modulated throughout the differentiation process, and some of these modulated proteins have previously been identified as drug targets in trypanosomiasis treatment. To the best of our knowledge, this study provides the first quantitative results highlighting the modulation of phosphorylation sites during metacyclogenesis and the greater coverage of the proteome to the parasite during this process. The data are available via ProteomeXchange with identifier number PXD006171.


Conflict of interest statement

The authors declare that they have no competing interests.

Figures

Figure 1
Figure 1
In vivo lifecycle highlighting the metacyclogenesis process and updated view of in vitro T. cruzi metacyclogenesis. (A) As contextualized in the Introduction, the parasite has two hosts. In its vertebrate host, the infective metacyclic trypomastigote form comes into contact with mammals through wounds or mucosal exposure, and the parasite then changes into its amastigote replicative form. After intense multiplication, it breaks the cells of the vertebrate host, and the blood trypomastigote form is exposed to the bloodstream. Subsequently, the mammal is bitten by the triatomine, and the trypomastigote blood form of the parasite undergoes differentiation into the epimastigote form in the posterior intestine of the invertebrate host. In the rectal surface of the triatomine the epimastigote form adheres and then differentiates in the metacyclic trypomastigote form. (B) For in vitro metacyclogenesis, after three exponential phase passages (3 ×ばつ 107 parasites/mL), the axenic epimastigotes were allowed to reach the end of the exponential phase (5 ×ばつ 107 parasites/mL). The epimastigotes were then subjected to nutritional stress in TAU medium (nutritional stress of 2 h) and later differentiated into the metacyclic trypomastigote form (6–96 h of metacyclogenesis). The number of adhered epimastigotes was estimated based on the total number of parasites subjected to metacyclogenesis (5 ×ばつ 106 parasites/mL) and their relation with the epimastigote and trypomastigote forms throughout the process. The AdhM form was the combination of Ad12 and Ad24h, and Ad48 and Ad72h were denoted AdlM. The data were statistically analysed by two-way analysis of variance (two-way ANOVA) and Tukey’s test for the comparison of averages (mean values ± S.D. from three independent experiments, each of which with technical duplicates). The symbols indicate the following: #not significant, *p < 0.05 and ***p < 0.001.
Figure 2
Figure 2
DEPs related to changes in biological processes and molecular functions during metacyclogenesis. (A) Surface proteins: disperse gene family 1 protein, DGF-1, p value = 2.3E−7 and 2.1E−3; and flagellar adherent glycoprotein, FAG, p value = 2.1E−4. (B) RNA-binding proteins: Pumilio 2, PUF2, p value = 3.8E−3; RNA helicase, DEAH box, p value = 3.2E−5; and zinc finger protein, ZFG, p value = 6.2E−4. (C) Oxidoreductase activity proteins: trypanothione reductase, TRYRED, p value = 1.9E−3; P450 reductase, P450 RED, p value = 2.7E−7; and thiol-dependent reductase-1, TDR-1, p value = 3.4E−5. (D) Glucose metabolism-related proteins; hexokinase, HK, p value = 9.4E−4; 6-phosphofructokinase, PFK, p value = 2.0E−3; and triosephosphate isomerase, TPI, p value = 1.1E−4. (E) Vesicle traffic-related proteins: dynamin, p value = 3.9E−5; mu-adaptin 4, p value = 1.5E−4; and syntaxin, p value = 1.5E−3. (F) Kinase and phosphatase proteins: regulatory protein kinase A-like, PKAr, p value = 1.6E−5; protein phosphatase 2C, PP2C, p value = 3.8E−5; and catalytic protein kinase A, PKAc, p value = 7.4E−5. The expression is presented as the log 10 value of the protein LFQ intensity. The data from two independent biological experiments, each with technical triplicates, were statistically analysed by a multiple-sample test (one-way ANOVA with Benjamini-Hochberg for FDR correction). Values of p < 0.01 and q < 0.01 obtained from one-way ANOVA and the FDR control, respectively, were considered to indicate significant differences.
Figure 3
Figure 3
DEPs and DESs related to cytoskeleton component and translation process during metacyclogenesis. (A) Cytoskeleton DEPs. (B) Translation DEPs. (C) Dyn. heavy S39 DES. (D) eEF1-α S488 and eEF2 S291 DESs. Heat map of DEPs and DESs during the metacyclogenesis process. The biological time points (columns) and protein groups or phosphosites (lines) were hierarchically clustered, demonstrating expression differences among the stress, adherent, and metacyclic phases. The coloured bar represents the log10 value of the protein or phosphosite intensity. The data from two independent biological experiments (the proteome data were obtained from technical triplicates and the phosphoproteome data were obtained from technical duplicates) were statistically analysed by a multiple-sample test (one-way ANOVA with Benjamini-Hochberg for FDR correction). Values of p < 0.01 from one-way ANOVA and values of q < 0.01 (for proteome data) and q < 0.025 (for phosphosite data) obtained from a FDR control were considered to indicate significant differences. 1 and 2 represent the first and second biological replicate for time points. Mya. heavy, myosin heavy chain; kin.like, kinesin-like; katanin p60, Katanin p60 ATPase-containing subunit A1; UP, uncharacterized protein.
Figure 4
Figure 4
DEPs and DESs related to peptidase activity and unfolded protein binding during metacyclogenesis. (A) DEPs with peptidase activity. (B) Unfolded protein-binding DEPs. (C) CAP5.5 S28 and S120 and UP S420 and S1688 DESs. (D) NAC S59, S61, T121 and T124 and DNJ S27 and S89 DESs. Heat map of DEPs and DESs during the metacyclogenesis process. The biological time points (columns) and protein groups or phosphosites (lines) were hierarchically clustered, demonstrating expression differences among the stress, adherent, and metacyclic phases. The coloured bar represents the log10 values of the protein or phosphosite intensity. The data from two independent biological experiments (the proteome data were obtained from technical triplicates, and phosphoproteome data were obtained from technical duplicates) were statistically analysed by a multiple-sample test (one-way ANOVA with Benjamini-Hochberg for FDR correction). Values of p < 0.01 from one-way ANOVA and values of q < 0.01 (for proteome data) and q < 0.025 (for phosphosite data) obtained from a FDR control were considered to indicate significant differences. 1 and 2 represent the first and second biological replicate for time points. UPB, unfolded protein binding; UP, uncharacterized protein; OligB-like, oligopeptidase B; Calpain, calpain cysteine peptidase; Aminopep., aminopeptidases; Pitrilysin-like, pitrilysin-like metalloprotease; Mit.prs.β, mitochondrial processing peptidase beta subunit; Met aminopep., methionine aminopeptidase; Dipeptidyl pep., dipeptidyl-peptidase; ATP-Clp pep., ATP-dependent Clp protease subunit; Carbxpep., carboxypeptidase; CAP5.5, cytoskeleton-associated protein CAP5.5; Prtas-α, proteasome alpha 7 subunit; Therm.carbol., thermostable carboxypeptidase 1; STG, small glutamine-rich tetratricopeptide repeat protein; STI, stress-induced protein 1; NAC, nascent polypeptide-associated complex subunit; Peptid.iso., peptidylprolyl isomerase.
Figure 5
Figure 5
DESs related to changes in biological processes and molecular functions during metacyclogenesis. (A) Regulatory protein kinase A-like, PKAr, p value = 2.1E−4. (B) Disperse gene family 1 protein, DGF-1, p value = 1.0E−4. (C) RNA-binding protein with RRM domain, p value = 1.1E−4. (D) Thiol-dependent reductase 1, TDR-1, p value = 8.4E−4. (E) ABC transporter protein, p value = 4.0E−4. (F) Clathrin coat assembly-related protein, CCA, p value = 1.1E−4. The expression levels are represented as log10 values of the intensity of the protein groups or phosphosites. The bottom parts of each figure represent the phosphosite-containing peptides. The data from two independent biological experiments (the proteome data were obtained from technical triplicates, and phosphoproteome data were obtained from technical duplicates) were statistically analysed by a multiple-sample test (one-way ANOVA with Benjamini-Hochberg for FDR correction). Values of p < 0.01 from one-way ANOVA and values of q < 0.01 (for proteome data) and q < 0.025 (for phosphosite data) obtained from a FDR control were considered to indicate significant differences.
Figure 6
Figure 6
Consensus motif enrichment analysis. Overrepresented phosphorylation motifs among all identified phosphorylation sites compared with all protein coding genes of T. cruzi. Categorization of GO terms of annotated phosphoproteins containing enriched motifs was determined through Fischer exact test (q < 0.05). The type represents GO enriched terms, P refers to the biological process, F indicates the molecular function, and C represents the cellular component.

References

    1. Chagas, C. Nova tripanozomiase humana. Estudos sobre a morfolojía e o ciclo evolutivo de Schizotrypanum cruzin. gen., n. sp., ajente etiolójico de nova entidade morbida do homen. Mem. Inst.Oswaldo Cruz 159–218 (1909).
    1. World Health Organization. Chagas Disease. Chagas Disease Available at: http://www.who.int/mediacentre/factsheets/fs340/en/ (Accessed: 2nd April 2017) (2017).
    1. Contreras VT, Salles JM, Thomas N, Morel CM, Goldenberg S. In vitro differentiation of Trypanosoma cruzi under chemically defined conditions. Mol. Biochem. Parasitol. 1985;16:315–327. doi: 10.1016/0166-6851(85)90073-8. - DOI - PubMed
    1. Contreras V, et al. Biological aspects of the DM28c clone of Trypanosoma cruzi after metacyclogenesis in chemically denined media. Mem. Inst.Oswaldo Cruz. 1988;83:123–133. doi: 10.1590/S0074-02761988000100016. - DOI - PubMed
    1. Bonaldo MC, Souto-Padron T, de Souza W, Goldenberg S. Cell-substrate adhesion during Trypanosoma cruzi differentiation. J. Cell Biol. 1988;106:1349–58. doi: 10.1083/jcb.106.4.1349. - DOI - PMC - PubMed

Publication types

LinkOut - more resources

Cite

AltStyle によって変換されたページ (->オリジナル) /