This site needs JavaScript to work properly. Please enable it to take advantage of the complete set of features!
Skip to main page content
U.S. flag

An official website of the United States government

Dot gov

The .gov means it’s official.
Federal government websites often end in .gov or .mil. Before sharing sensitive information, make sure you’re on a federal government site.

Https

The site is secure.
The https:// ensures that you are connecting to the official website and that any information you provide is encrypted and transmitted securely.

NIH NLM Logo
Log in
Access keys NCBI Homepage MyNCBI Homepage Main Content Main Navigation
. 2017 Jul 20;7(1):5967.
doi: 10.1038/s41598-017-05957-y.

An ecological and digital epidemiology analysis on the role of human behavior on the 2014 Chikungunya outbreak in Martinique

Affiliations

An ecological and digital epidemiology analysis on the role of human behavior on the 2014 Chikungunya outbreak in Martinique

Benjamin Roche et al. Sci Rep. .

Abstract

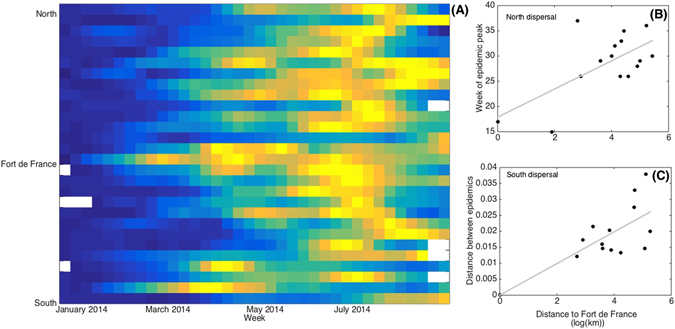
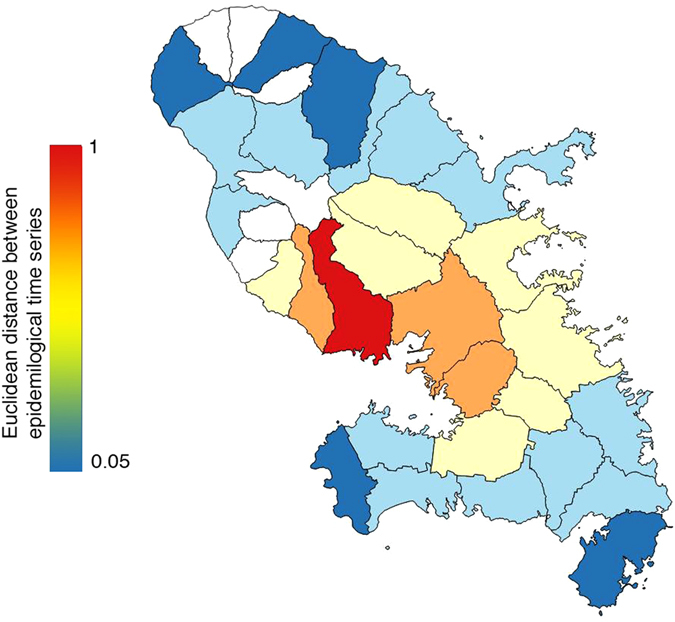
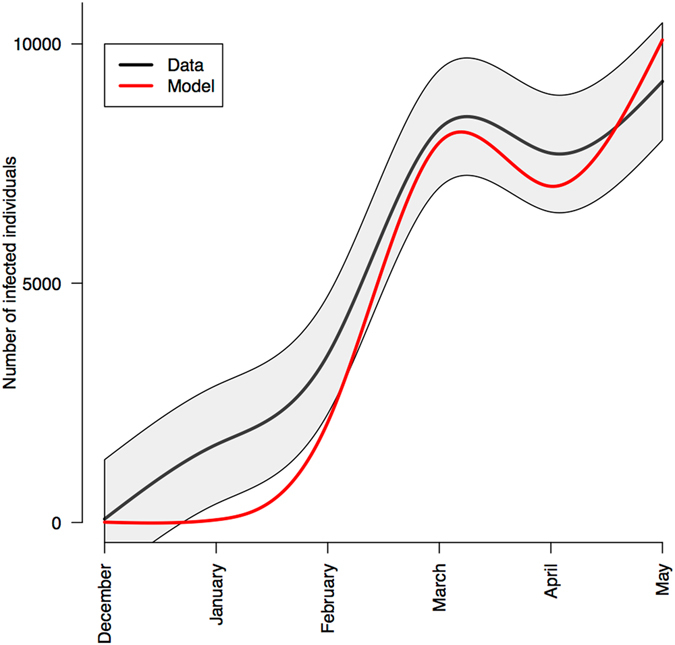
Understanding the spatio-temporal dynamics of endemic infections is of critical importance for a deeper understanding of pathogen transmission, and for the design of more efficient public health strategies. However, very few studies in this domain have focused on emerging infections, generating a gap of knowledge that hampers epidemiological response planning. Here, we analyze the case of a Chikungunya outbreak that occurred in Martinique in 2014. Using time series estimates from a network of sentinel practitioners covering the entire island, we first analyze the spatio-temporal dynamics and show that the largest city has served as the epicenter of this epidemic. We further show that the epidemic spread from there through two different propagation waves moving northwards and southwards, probably by individuals moving along the road network. We then develop a mathematical model to explore the drivers of the temporal dynamics of this mosquito-borne virus. Finally, we show that human behavior, inferred by a textual analysis of messages published on the social network Twitter, is required to explain the epidemiological dynamics over time. Overall, our results suggest that human behavior has been a key component of the outbreak propagation, and we argue that such results can lead to more efficient public health strategies specifically targeting the propagation process.


Conflict of interest statement

The authors declare that they have no competing interests.

Figures

Figure 1
Figure 1
Summary of the spatio-temporal dynamics of the 2014 Chikungunya outbreak in Martinique and its two spatial waves. (A) Colors represent the local scaled incidence rate (ranking from 0 in dark blue to 1 in hot yellow) for each locality (rows), ranked from the extreme south to the extreme north of the island according to its position from Fort-De-France, and each week (column). White color represent lack of data. Two waves appear from Fort-De-France, northwards and southwards. Geographic distance (log of km) between different localities through road (x-axis) and (B) the week of the epidemic peak (r = 0.6454, p-value = 0.0094) and (C) the Euclidean distance between the whole time series (r = 0.72, p-value = 0.0037).
Figure 2
Figure 2
Invasion sequence of the Chikungunya outbreak based on similarity of epidemiological dynamics between each locality and Fort-de-France (similarity has been quantified through Euclidean distance between time series, see main text for more details). Colors follow a gradient from red (considered as epicenter of the epidemics, Fort-de-France, with therefore a correlation of 1) to dark blue (last localities to have been affected, with a correlation close to 0), representing this similarity (localities in white have no epidemiological data). The map has been generated with R software.
Figure 3
Figure 3
Match between estimated monthly epidemiological data (black, shaded grey area shows the confidence interval based on a Gaussian distribution) and the most parsimonious mathematical model including mosquito abundance and expressed need for protection on Twitter (red line). Estimated transmission parameters are x0 = 3.76 10–4, x1 = 0.295, x2 = 0.644 and τ = −1. See Table 1 for model selection details.

References

    1. Grenfell BT, Bjornstad ON, Kappey J. Travelling waves and spatial hierarchies in measles epidemics. Nature. 2001;414:716–723. doi: 10.1038/414716a. - DOI - PubMed
    1. Choisy M, Rohani P. Changing spatial epidemiology of pertussis in continental USA. Proc. Biol. Sci. 2012;279:4574–81. doi: 10.1098/rspb.2012.1761. - DOI - PMC - PubMed
    1. Rohani P, Earn DJ, Grenfell BT. Opposite patterns of synchrony in sympatric disease metapopulations. Science (80-) 1999;286:968–971. doi: 10.1126/science.286.5441.968. - DOI - PubMed
    1. Grenfell BT, Bolker BM. Cities and villages: infection hierarchies in a measles metapopulation. Ecol Lett. 1998;1:63–70. doi: 10.1046/j.1461-0248.1998.00016.x. - DOI
    1. Agur Z, Cojocaru L, Mazor G, Anderson RM, Danon YL. Pulse mass measles vaccination across age cohorts. Proc. Natl. Acad. Sci. USA. 1993;90:11698–702. doi: 10.1073/pnas.90.24.11698. - DOI - PMC - PubMed

Publication types

Cite

AltStyle によって変換されたページ (->オリジナル) /