Identifying optimal threshold statistics for elimination of hookworm using a stochastic simulation model
- PMID: 28666452
- PMCID: PMC5493114
- DOI: 10.1186/s13071-017-2256-8
Identifying optimal threshold statistics for elimination of hookworm using a stochastic simulation model
Abstract
Background: There is an increased focus on whether mass drug administration (MDA) programmes alone can interrupt the transmission of soil-transmitted helminths (STH). Mathematical models can be used to model these interventions and are increasingly being implemented to inform investigators about expected trial outcome and the choice of optimum study design. One key factor is the choice of threshold for detecting elimination. However, there are currently no thresholds defined for STH regarding breaking transmission.
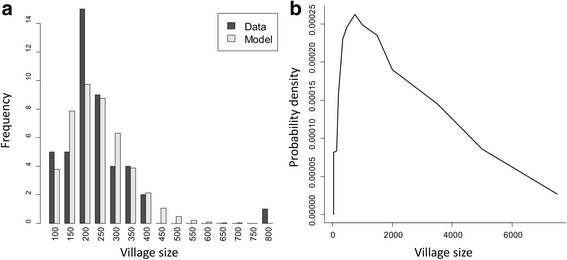
Methods: We develop a simulation of an elimination study, based on the DeWorm3 project, using an individual-based stochastic disease transmission model in conjunction with models of MDA, sampling, diagnostics and the construction of study clusters. The simulation is then used to analyse the relationship between the study end-point elimination threshold and whether elimination is achieved in the long term within the model. We analyse the quality of a range of statistics in terms of the positive predictive values (PPV) and how they depend on a range of covariates, including threshold values, baseline prevalence, measurement time point and how clusters are constructed.
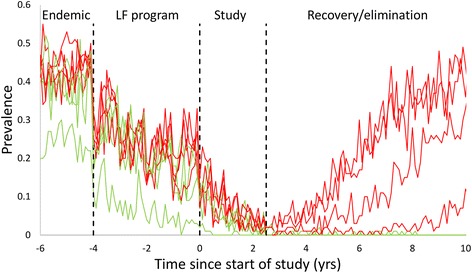
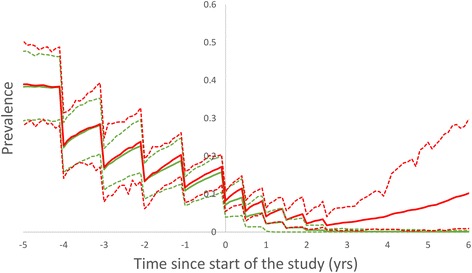
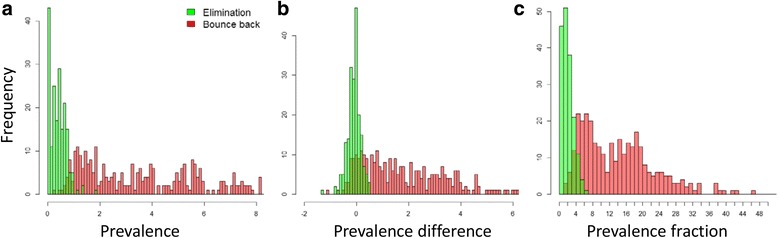
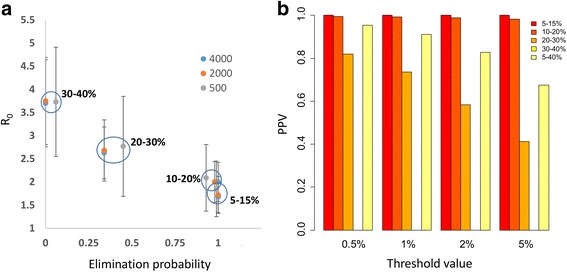
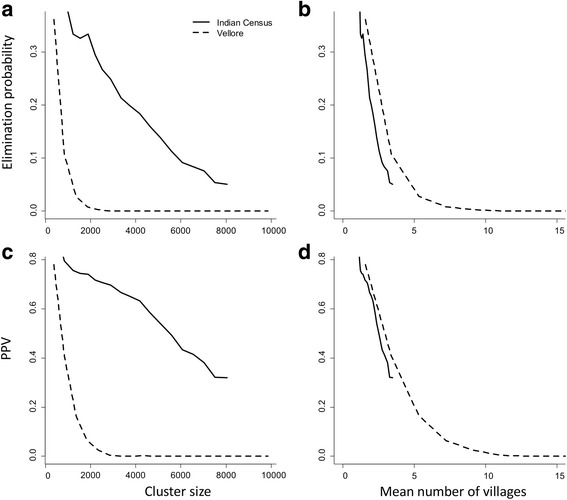
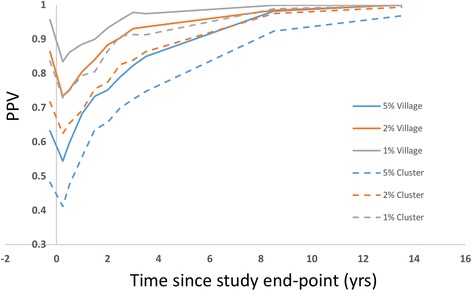
Results: End-point infection prevalence performs well in discriminating between villages that achieve interruption of transmission and those that do not, although the quality of the threshold is sensitive to baseline prevalence and threshold value. Optimal post-treatment prevalence threshold value for determining elimination is in the range 2% or less when the baseline prevalence range is broad. For multiple clusters of communities, both the probability of elimination and the ability of thresholds to detect it are strongly dependent on the size of the cluster and the size distribution of the constituent communities. Number of communities in a cluster is a key indicator of probability of elimination and PPV. Extending the time, post-study endpoint, at which the threshold statistic is measured improves PPV value in discriminating between eliminating clusters and those that bounce back.
Conclusions: The probability of elimination and PPV are very sensitive to baseline prevalence for individual communities. However, most studies and programmes are constructed on the basis of clusters. Since elimination occurs within smaller population sub-units, the construction of clusters introduces new sensitivities for elimination threshold values to cluster size and the underlying population structure. Study simulation offers an opportunity to investigate key sources of sensitivity for elimination studies and programme designs in advance and to tailor interventions to prevailing local or national conditions.
Keywords: Cluster randomized trials; Elimination of transmission; Mass drug administration; Positive/Negative predictive value; Soil-transmitted helminths; Stochastic models.
Figures
References
-
- WHO . Report of the third global meeting of the partners for parasite control: Deworming for Health and Development. Geneva: WHO; 2005.
-
- WHO. Eliminating soil-transmitted helminthiases as a public health problem in children: progress report 2001–2010 and strategic plan 2011–2020. Geneva: WHO. p. 2012.
-
- WHO. Helminth control in school age children: a guide for managers of control programmes. A. Montresor ed. 2011. p. 75. ISBN: 978 92 4 150 312 9.
-
- Truscott JE, Turner HC, Anderson RM. What impact will the achievement of the current World Health Organisation targets for anthelmintic treatment coverage in children have on the intensity of soil transmitted helminth infections? Parasit Vectors. 2015;8:551. doi: 10.1186/s13071-015-1135-4. - DOI - PMC - PubMed
MeSH terms
Substances
Grants and funding
LinkOut - more resources
Full Text Sources
Other Literature Sources