This site needs JavaScript to work properly. Please enable it to take advantage of the complete set of features!
Skip to main page content
U.S. flag

An official website of the United States government

Dot gov

The .gov means it’s official.
Federal government websites often end in .gov or .mil. Before sharing sensitive information, make sure you’re on a federal government site.

Https

The site is secure.
The https:// ensures that you are connecting to the official website and that any information you provide is encrypted and transmitted securely.

NIH NLM Logo
Log in
Access keys NCBI Homepage MyNCBI Homepage Main Content Main Navigation
. 2017 Jun 22;546(7659):524-527.
doi: 10.1038/nature22971. Epub 2017 Jun 12.

Improved maize reference genome with single-molecule technologies

Affiliations

Improved maize reference genome with single-molecule technologies

Yinping Jiao et al. Nature. .

Abstract

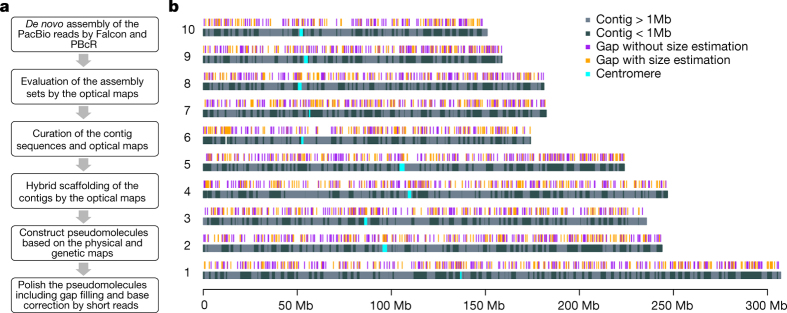
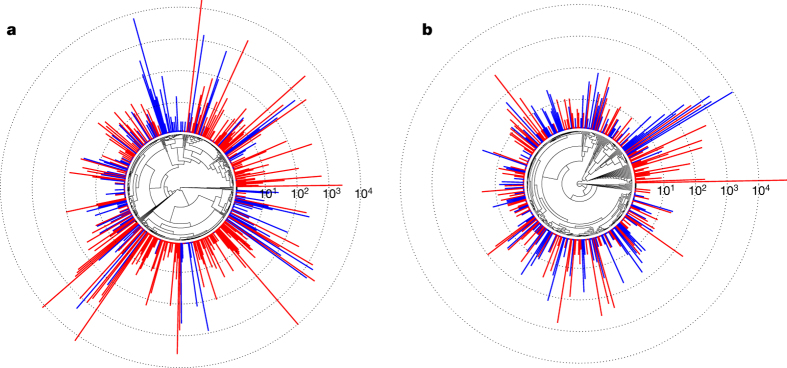
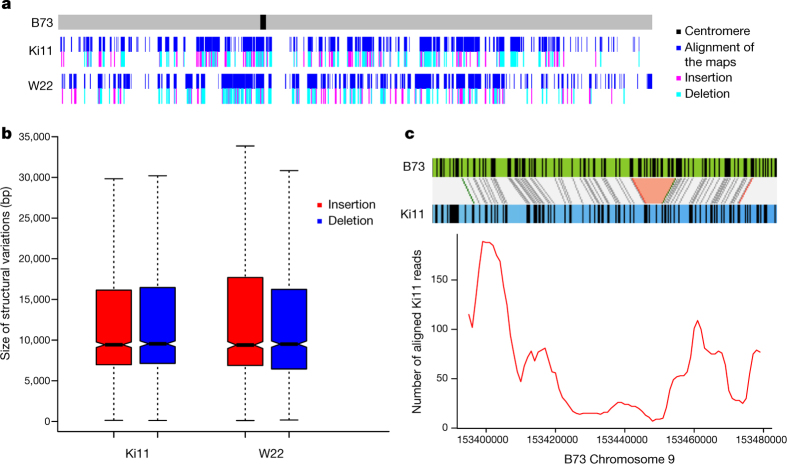
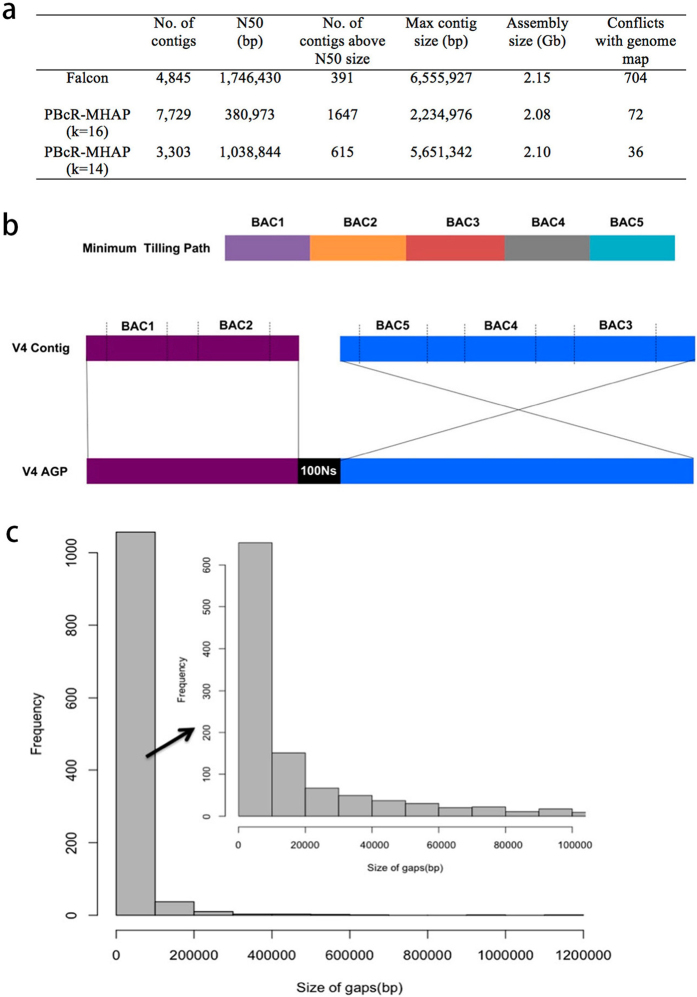
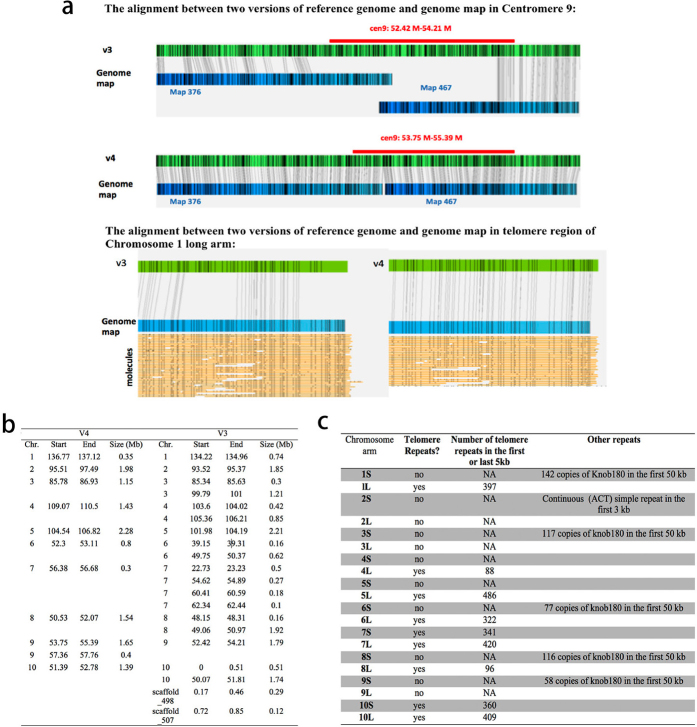
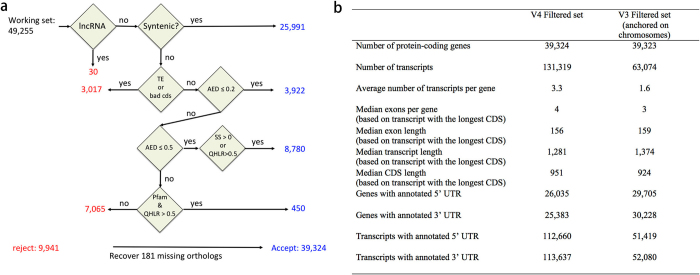
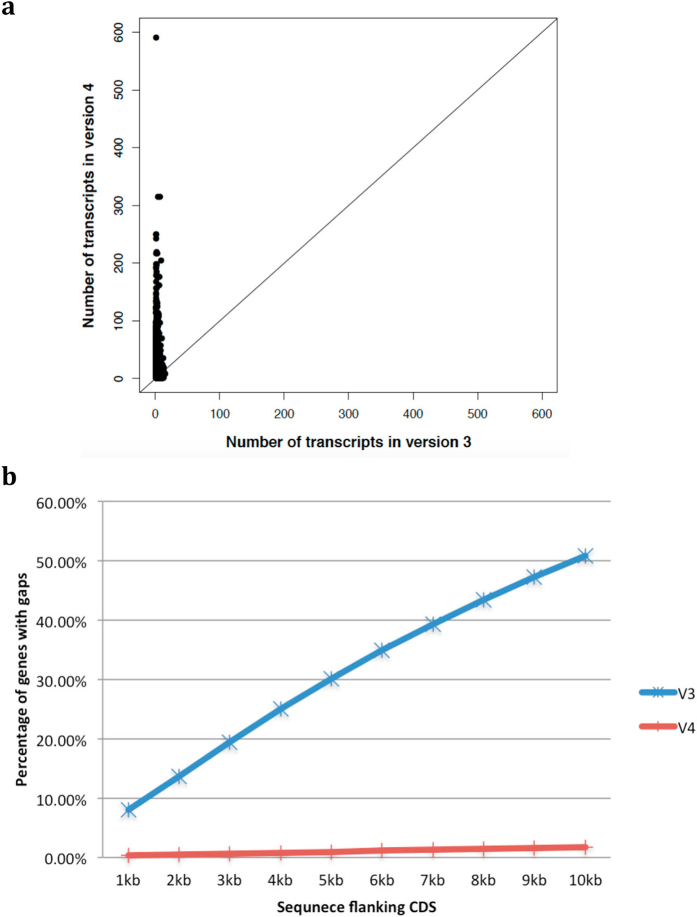
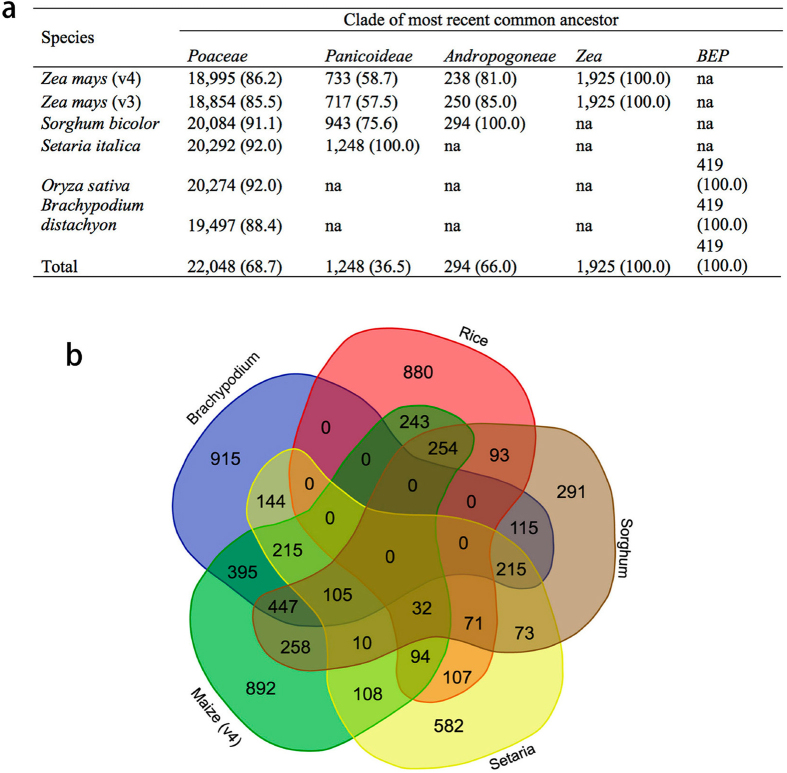
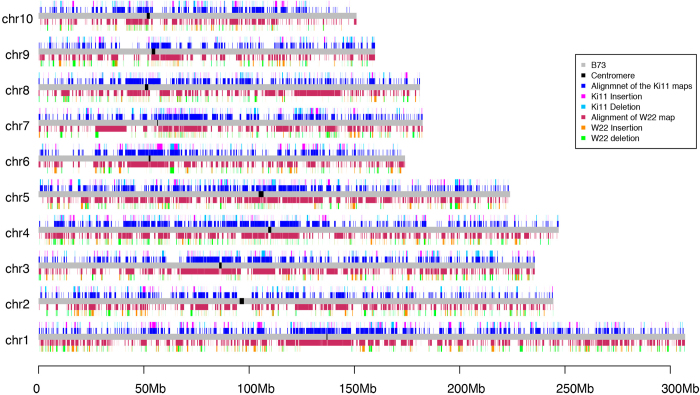
Complete and accurate reference genomes and annotations provide fundamental tools for characterization of genetic and functional variation. These resources facilitate the determination of biological processes and support translation of research findings into improved and sustainable agricultural technologies. Many reference genomes for crop plants have been generated over the past decade, but these genomes are often fragmented and missing complex repeat regions. Here we report the assembly and annotation of a reference genome of maize, a genetic and agricultural model species, using single-molecule real-time sequencing and high-resolution optical mapping. Relative to the previous reference genome, our assembly features a 52-fold increase in contig length and notable improvements in the assembly of intergenic spaces and centromeres. Characterization of the repetitive portion of the genome revealed more than 130,000 intact transposable elements, allowing us to identify transposable element lineage expansions that are unique to maize. Gene annotations were updated using 111,000 full-length transcripts obtained by single-molecule real-time sequencing. In addition, comparative optical mapping of two other inbred maize lines revealed a prevalence of deletions in regions of low gene density and maize lineage-specific genes.


Conflict of interest statement

P.P., C.-S.C. and D.R.R. are full-time employees of Pacific Biosciences. J.S., T.L. and A.H. are employees of BioNano Genomics, Inc., and own company stock options. W.R.M. has participated in Illumina sponsored meetings over the past four years and received travel reimbursement and an honorarium for presenting at these events. Illumina had no role in decisions relating to the study/work to be published, data collection and analysis of data, or the decision to publish. W.R.M. has participated in Pacific Biosciences sponsored meetings over the past three years and received travel reimbursement for presenting at these events. W.R.M. is a founder and shared holder of Orion Genomics, which focuses on plant genomics and cancer genetics. W.R.M. is an SAB member for RainDance Technologies, Inc. All other authors declare no competing financial interests.

Figures

Figure 1
Figure 1. Genome assembly layout.
a, Workflow for genome construction. b, Ideograms of maize B73 version 4 reference pseudomolecules. The top track shows positions of 2,522 gaps in the pseudomolecules, including 1,115 gaps in which the lengths were estimated using optical genome maps (orange), whereas the remainder (purple) have undetermined lengths. More than half of the assembly is constituted of contigs longer than 1 Mb, which are shown as light grey bars in the bottom track. PowerPoint slide Source data
Figure 2
Figure 2. Phylogeny of maize and sorghum LTR retrotransposon families.
a, b, Both Ty3/Gypsy (a) and Ty1/Copia (b) superfamilies are present at higher copy number in maize (red) than in sorghum (blue). Bars (log10-scaled) depict family copy numbers. PowerPoint slide Source data
Figure 3
Figure 3. Structural variation from Ki11 and W22.
a, Alignment and structural variation called from Ki11 and W22 optical maps on chromosome 10. b, Size distribution of the insertion and deletions in Ki11 and W22. c, Example of using short-read alignment to verify a missing region mapped in Ki11. PowerPoint slide Source data
Extended Data Figure 1
Extended Data Figure 1. Summary of data generated for genome construction.
a, Size distribution of single molecules for the optical maps. A total of 150 Gb (~60-fold coverage) of single-molecule raw data from BioNano chips was collected for map construction. The N50 of the single molecules was ~261 kb, and the label density was 11.6 per 100 kb. After assembly, the total size of the map reached 2.12 Gb with an N50 of 2.47 Mb. b, Length distribution of SMRT sequencing reads. Sequencing of 212 P6-C4 SMRT cells on the PacBio platform generated ~65-fold depth-of-coverage of the nuclear genome. Read lengths averaged 11.7 kb, with reads above 10 kb providing 53-fold depth-of-coverage. c, The accuracy of SMRT sequencing from a representative run. The sequencing error rate was estimated at 10% from the alignment with the maize B73 RefGen_v3 by BLASR. d, Plot of the fraction of alignable data per run (alignable bases/total bases per chip) versus total raw bases (per chip) for each B73 sequencing run. As the plot shows, the trend in the data suggests that as the overall per run raw base yield increases, the fraction of alignable bases decreases. This is owing to the fact that in all runs, a subset of the zero-mode waveguide (ZMWs) will initially have more than one active sequencing enzyme in the observation field at the start of the sequencing run. A ZMW with more than one active polymerase will create unalignable bases while the two polymerases are simultaneously synthesizing DNA and yield a ‘merged sequencing signal from two independent polymerases’. As the loading of a chips increases (yield of bases), the probability of having two or more polymerases in a single ZMW increases.
Extended Data Figure 2
Extended Data Figure 2. Construction of pseudomolecules.
a, Summary of the three assembly sets. b, How the scaffolds were ordered according to the order of the BACs. c, Size distribution of gaps in the pseudomolecules estimated using the optical map.
Extended Data Figure 3
Extended Data Figure 3. Quality assessment and comparison of the assembly in centromere and telomere regions in maize B73 RefGen_v3 and v4.
a, Quality assessment of centromere and telomere using optical genome map. b, Locations of centromeres on pseudomolecules defined by ChIP–seq in the B73 RefGen_v3 and v4. c, Telomere repeats found in the B73 RefGen_v4 pseudomolecules.
Extended Data Figure 4
Extended Data Figure 4. Details of the gene annotation of maize B73 RefGen_v4.
a, The pipeline used to characterize high confidence gene models. b, Summary of B73 RefGen_v4 protein-coding gene annotation, and comparison with RefGen_v3 annotation.
Extended Data Figure 5
Extended Data Figure 5. Improvement of the annotation of alternative splicing and completeness of regulatory regions of maize RefGen_v4 genes.
a, Number of transcripts of each gene in v3 and v4 annotation. b, Percentages of genes with gaps in flanking regions in the v3 and v4 annotations.
Extended Data Figure 6
Extended Data Figure 6. Comparative analysis of the maize B73 RefGen_v4 genes with other grasses.
a, Species-membership in orthologue sets, giving counts and percentage of orthologue sets of which each species is a member. Numbers in parentheses give the percentage of orthologue sets with membership of all species and versions within the clade. na, not applicable. b, Venn diagram showing overlap of 6,539 orthologue sets rooted in the Poaceae (true grasses) that are deficient in gene membership among five species.
Extended Data Figure 7
Extended Data Figure 7. Structural variation characterized from the Ki11 and W22 optical maps.

References

    1. Edwards D, Batley J, Snowdon RJ. Accessing complex crop genomes with next-generation sequencing. Theor. Appl. Genet. 2013;126:1–11. - PubMed
    1. Morrell PL, Buckler ES, Ross-Ibarra J. Crop genomics: advances and applications. Nat. Rev. Genet. 2011;13:85–96. - PubMed
    1. Schnable PS, et al. The B73 maize genome: complexity, diversity, and dynamics. Science. 2009;326:1112–1115. - PubMed
    1. Wang B, et al. Unveiling the complexity of the maize transcriptome by single-molecule long-read sequencing. Nat. Commun. 2016;7:11708. - PMC - PubMed
    1. Hake, S. & Ross-Ibarra, J. Genetic, evolutionary and plant breeding insights from the domestication of maize. eLife4, (2015) - PMC - PubMed

Publication types

Cite

AltStyle によって変換されたページ (->オリジナル) /