This site needs JavaScript to work properly. Please enable it to take advantage of the complete set of features!
Skip to main page content
U.S. flag

An official website of the United States government

Dot gov

The .gov means it’s official.
Federal government websites often end in .gov or .mil. Before sharing sensitive information, make sure you’re on a federal government site.

Https

The site is secure.
The https:// ensures that you are connecting to the official website and that any information you provide is encrypted and transmitted securely.

NIH NLM Logo
Log in
Access keys NCBI Homepage MyNCBI Homepage Main Content Main Navigation
. 2017 May 4;169(4):610-620.e14.
doi: 10.1016/j.cell.201704008. Epub 2017 Apr 27.

Zika Virus Persistence in the Central Nervous System and Lymph Nodes of Rhesus Monkeys

Affiliations

Zika Virus Persistence in the Central Nervous System and Lymph Nodes of Rhesus Monkeys

Malika Aid et al. Cell. .

Abstract

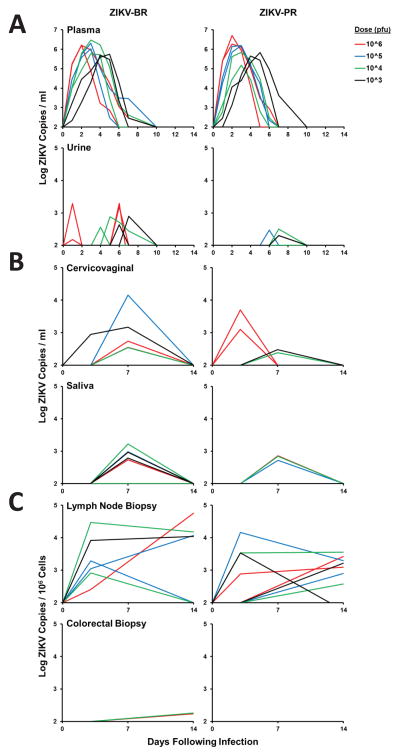
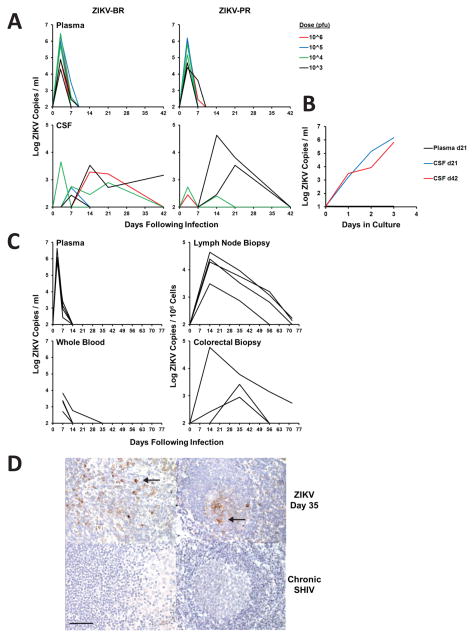
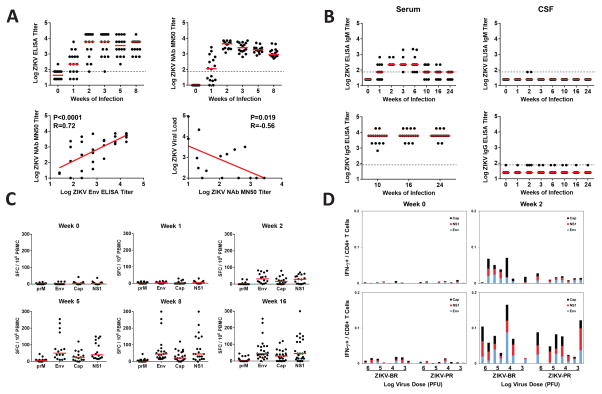
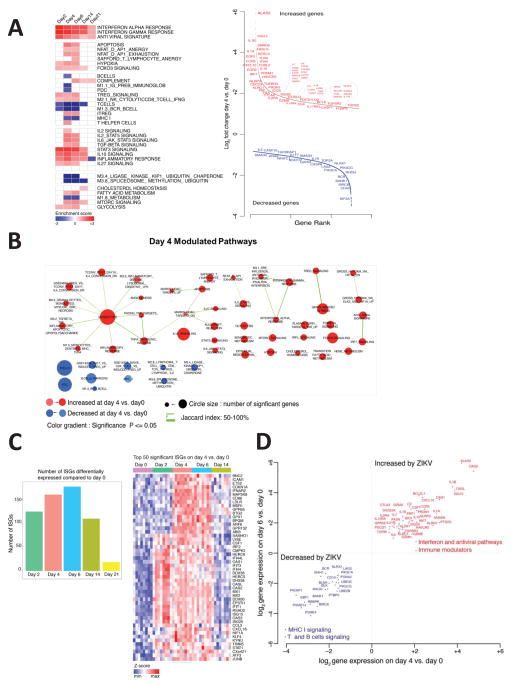
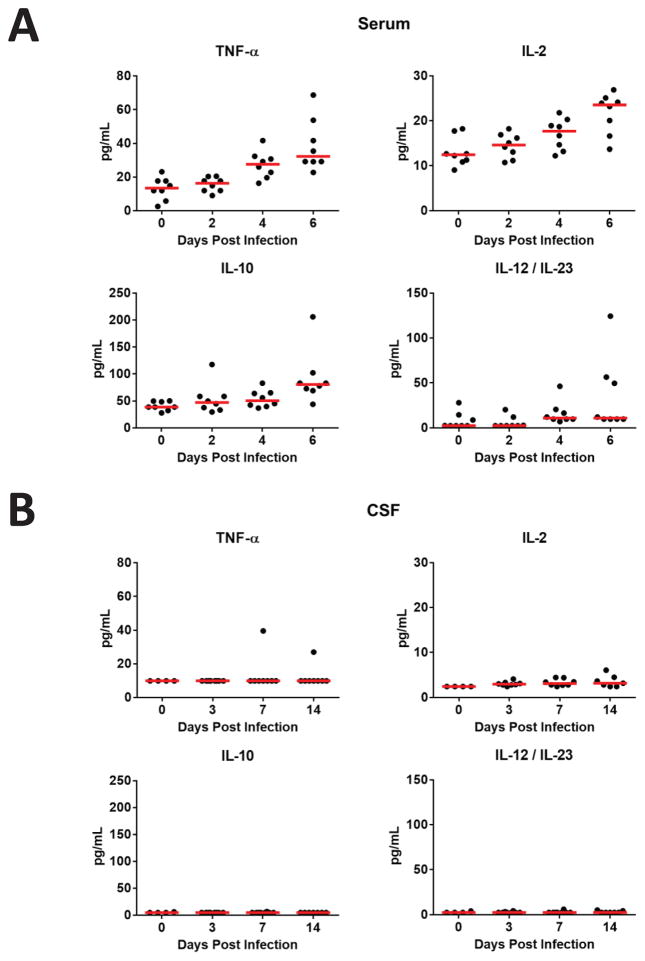
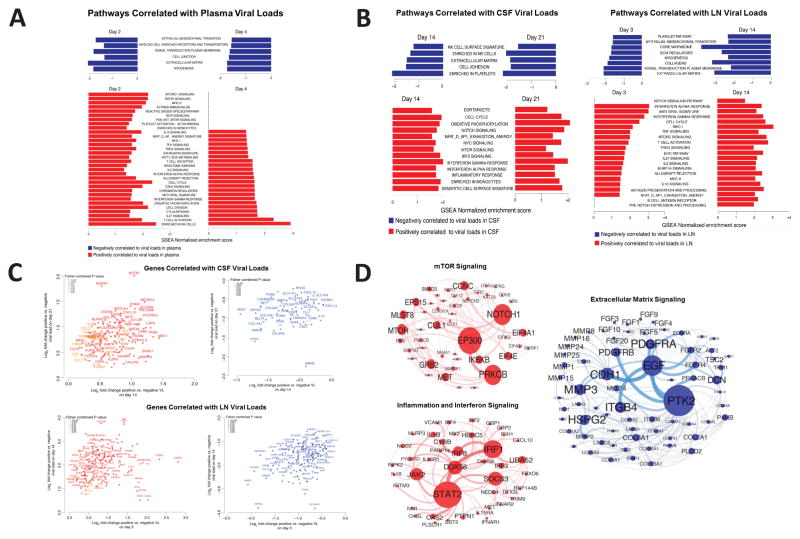
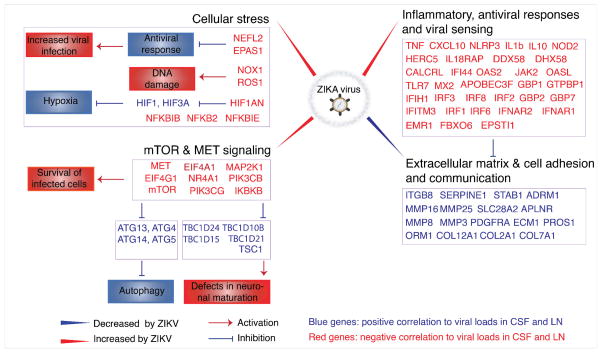
Zika virus (ZIKV) is associated with severe neuropathology in neonates as well as Guillain-Barré syndrome and other neurologic disorders in adults. Prolonged viral shedding has been reported in semen, suggesting the presence of anatomic viral reservoirs. Here we show that ZIKV can persist in cerebrospinal fluid (CSF) and lymph nodes (LN) of infected rhesus monkeys for weeks after virus has been cleared from peripheral blood, urine, and mucosal secretions. ZIKV-specific neutralizing antibodies correlated with rapid clearance of virus in peripheral blood but remained undetectable in CSF for the duration of the study. Viral persistence in both CSF and LN correlated with upregulation of mechanistic target of rapamycin (mTOR), proinflammatory, and anti-apoptotic signaling pathways, as well as downregulation of extracellular matrix signaling pathways. These data raise the possibility that persistent or occult neurologic and lymphoid disease may occur following clearance of peripheral virus in ZIKV-infected individuals.

Keywords: CSF; Zika; infection; lymph node; mTOR; persistence; rhesus; sanctuaries; transcriptomics; viral dynamics.


Conflict of interest statement

The authors declare no competing financial interests.

Figures

Figure 1
Figure 1. Viral shedding following ZIKV infection
Rhesus monkeys (N=16) were infected by the s.c route with 106–103 pfu (109–106 vp) ZIKV-BR or ZIKV-PR (N=2/group). Viral loads (log10 ZIKV RNA copies/ml or copies/106 cells) are shown in (A) plasma and urine, (B) cervicovaginal secretions and saliva, and (C) lymph node and colorectal biopsies. Viral loads were determined on days 0, 1, 2, 3, 4, 5, 6, 7, 10, and 14 for plasma and urine samples and on days 0, 3, 7, and 14 for the other samples. Data is shown for all 8 animals in each panel, except for only 7 females in each panel for cervicovaginal secretions. Assay sensitivity is >100 ZIKV copies/ml and >100 ZIKV copies/106 cells.
Figure 2
Figure 2. ZIKV persistence in CSF and LN
(A) Viral loads (log10 ZIKV RNA copies/ml) in plasma and CSF in the study described in Figure 1. (B) ZIKV outgrowth assay from plasma and CSF from days 21 and 42 from the animal with the most prolonged CSF viral loads. (C) Viral loads (log10 ZIKV RNA copies/ml or copies/106 cells) in plasma, whole blood, lymph nodes, and colorectal biopsies in 4 additional rhesus monkeys infected by the s.c. route with 103 pfu (106 vp) ZIKV-BR. (D) Immunohistochemistry for ZIKV Env in a representative rhesus monkey lymph node on day 35 following ZIKV infection. Arrows show cytoplasmic staining for ZIKV Env in infected cells in the paracortex (top left) and germinal center (top right). No staining was evident in lymph nodes from a control SHIV-infected rhesus monkey (lower left) or from a ZIKV-infected rhesus monkey stained with an irrelevant control mouse IgG (lower right). Representative images are shown. 600x magnification; scale bar 25 μm. See also Supplementary Figure S1.
Figure 3
Figure 3. Humoral and cellular immune responses following ZIKV infection
(A) Serum log10 Env-specific ELISA titers (top left) and ZIKV-specific microneutralization (MN50) titers (top right) following ZIKV infection. Correlation of ELISA and MN50 titers at weeks 1–2 (bottom left) and correlation of MN50 titers with viral loads on day 6 (bottom right) are also shown. P values reflect Spearman rank-correlation tests. (B) Serum and CSF log10 Env-specific IgM and IgG ELISA titers through week 24. Dotted line indicates limit of assay positivity. Cellular immune responses were assessed by (C) interferon-γ ELISPOT assays to prM, Env, Cap, and NS1 and (D) multiparameter ICS assays to Env, Cap, and NS1. See also Supplementary Figure S2.
Figure 4
Figure 4. Longitudinal transcriptomic analysis of acute ZIKV infection
(A) Heatmaps representing gene set enrichment (GSEA) normalized enrichment scores (NES) for the top enriched pathways on days 2, 4, 6, 14, and 21 following ZIKV infection as compared with baseline day 0 (left). Color gradient depicts NES range varying from dark red (increased) to dark blue (decreased). Scatter plots of the top differentially expressed genes on day 4 compared with day 0 (right). X-axis and Y-axis represent, respectively, gene rank and log2 fold change of gene expression sorted from highest to lowest. Red and blue represent, respectively, upregulated and downregulated pathways. (B) Enrichment map representing significant pathways (FDR 5%) that are increased (red) or decreased (blue) on day 4 as compared with day 0. (C) Number of differentially expressed interferon-stimulated genes (ISGs) (P<0.05) on days 2, 4, 6, 14, and 21 following ZIKV infection as compared with day 0 (left). Heatmap of the normalized expression of the top 50 ISGs induced on day 4 as compared with day 0 (right). (D) Scatter plot showing upregulation of interferon, antiviral, and immunomodulatory pathways and downregulation of T cell and B cell signaling pathways on days 4 and 6 as compared with day 0. Axes reflect log2 fold changes in expression of leading genes on days 4 and 6 as compared with day 0. See also Supplementary Figures S3–S4.
Figure 5
Figure 5. Cytokine levels following ZIKV infection
Cytokine levels are shown in (A) serum and (B) CSF on days 0, 2, 4, and 6 following ZIKV infection of rhesus monkeys as measured by Luminex assays. Red bars reflect medians.
Figure 6
Figure 6. Bar charts representing the top enriched pathways correlated with plasma, CSF, and LN viral loads
(A) Normalized enrichment scores of the top pathways correlated positively (red) or negatively (blue) with plasma viral loads on day 2 and 4 following ZIKV infection. (B) Normalized enrichment scores of the top pathways correlated positively (red) or negatively (blue) to CSF viral loads on day 14 and 21 (left) and to LN viral loads on day 3 and 14 (right). (C) Scatter plots of genes consistently correlated positively (red) or negatively (blue) to persistent viral load in CSF (top) and LN (bottom). Color gradient ranging from dark to light (red for positively correlated genes, blue for negatively correlated genes) represent the Fisher combined P value for each gene. Axes represent log2 fold change in gene expression between animals with positive and negative viral loads. (D) Gene interaction networks for mTOR, inflammation and interferon, and extracellular matrix pathways that were correlated positively or negatively to CSF and LN viral loads. Red and blue nodes are genes correlated positively and negatively to viral loads. Node size is proportional to the number of interacting neighbors. Edge width depicts the strength of the interaction between each pair of genes. Networks inference was performed using Cytoscape. See also Supplementary Figures S5–S7.
Figure 7
Figure 7. Model of ZIKV persistence in CSF and LN
Schematic representation of the most relevant pathways and genes that were modulated by ZIKV and that correlated with persistent CSF and LN viral loads, highlighting increased inflammation, antiviral, cellular stress, and mTOR signaling pathways and decreased extracellular matrix and cell adhesion pathways. Interactions between genes and pathways were inferred from published literature. Red indicates activation; blue indicates inhibition.

References

    1. Abbink P, Larocca RA, De La Barrera RA, Bricault CA, Moseley ET, Boyd M, Kirilova M, Li Z, Ng’ang’a D, Nanayakkara O, et al. Protective efficacy of multiple vaccine platforms against Zika virus challenge in rhesus monkeys. Science. 2016;353:1129–1132. - PMC - PubMed
    1. Adams Waldorf KM, Stencel-Baerenwald JE, Kapur RP, Studholme C, Boldenow E, Vornhagen J, Baldessari A, Dighe MK, Thiel J, Merillat S, et al. Fetal brain lesions after subcutaneous inoculation of Zika virus in a pregnant nonhuman primate. Nat Med. 2016;22:1256–1259. - PMC - PubMed
    1. Afroz S, Giddaluru J, Abbas MM, Khan N. Transcriptome meta-analysis reveals a dysregulation in extra cellular matrix and cell junction associated gene signatures during Dengue virus infection. Scientific reports. 2016;6:33752. - PMC - PubMed
    1. Barba-Spaeth G, Dejnirattisai W, Rouvinski A, Vaney MC, Medits I, Sharma A, Simon-Loriere E, Sakuntabhai A, Cao-Lormeau VM, Haouz A, et al. Structural basis of potent Zika-dengue virus antibody cross-neutralization. Nature. 2016;536:48–53. - PubMed
    1. Barouch DH, Ghneim K, Bosche WJ, Li Y, Berkemeier B, Hull M, Bhattacharyya S, Cameron M, Liu J, Smith K, et al. Rapid Inflammasome Activation following Mucosal SIV Infection of Rhesus Monkeys. Cell. 2016;165:656–667. - PMC - PubMed

MeSH terms

Substances

Cite

AltStyle によって変換されたページ (->オリジナル) /