This site needs JavaScript to work properly. Please enable it to take advantage of the complete set of features!
Skip to main page content
U.S. flag

An official website of the United States government

Dot gov

The .gov means it’s official.
Federal government websites often end in .gov or .mil. Before sharing sensitive information, make sure you’re on a federal government site.

Https

The site is secure.
The https:// ensures that you are connecting to the official website and that any information you provide is encrypted and transmitted securely.

NIH NLM Logo
Log in
Access keys NCBI Homepage MyNCBI Homepage Main Content Main Navigation
. 2017 Mar 3;13(3):e1006245.
doi: 10.1371/journal.ppat.1006245. eCollection 2017 Mar.

Exosome secretion affects social motility in Trypanosoma brucei

Affiliations

Exosome secretion affects social motility in Trypanosoma brucei

Dror Eliaz et al. PLoS Pathog. .

Abstract

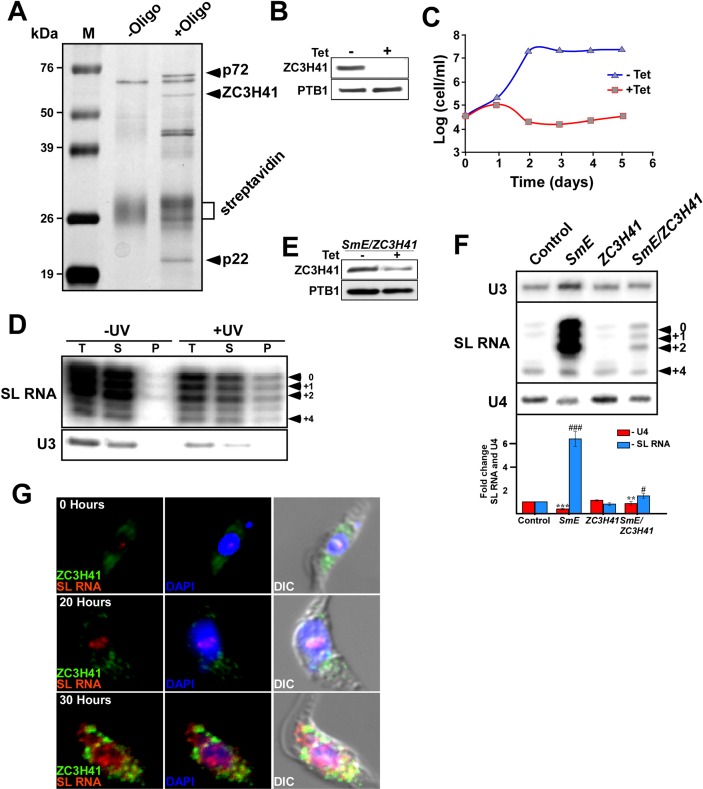
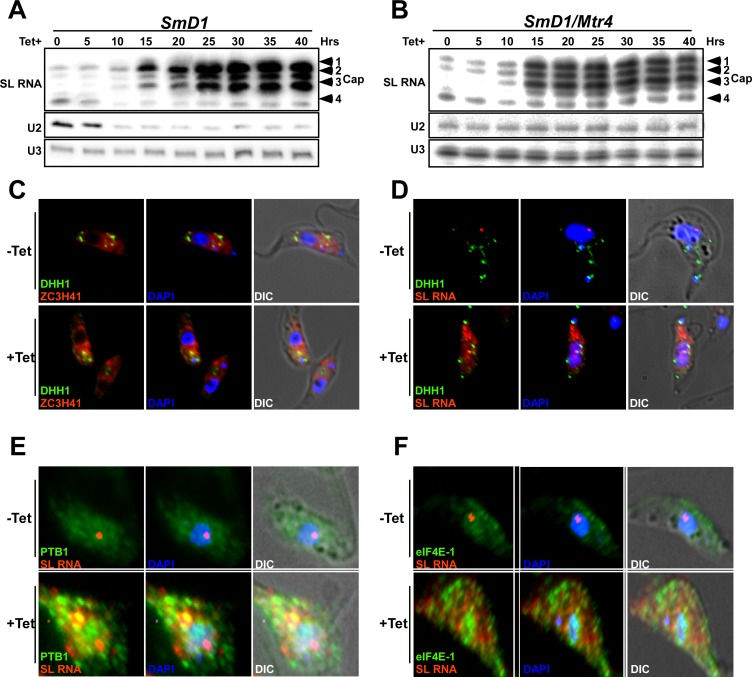
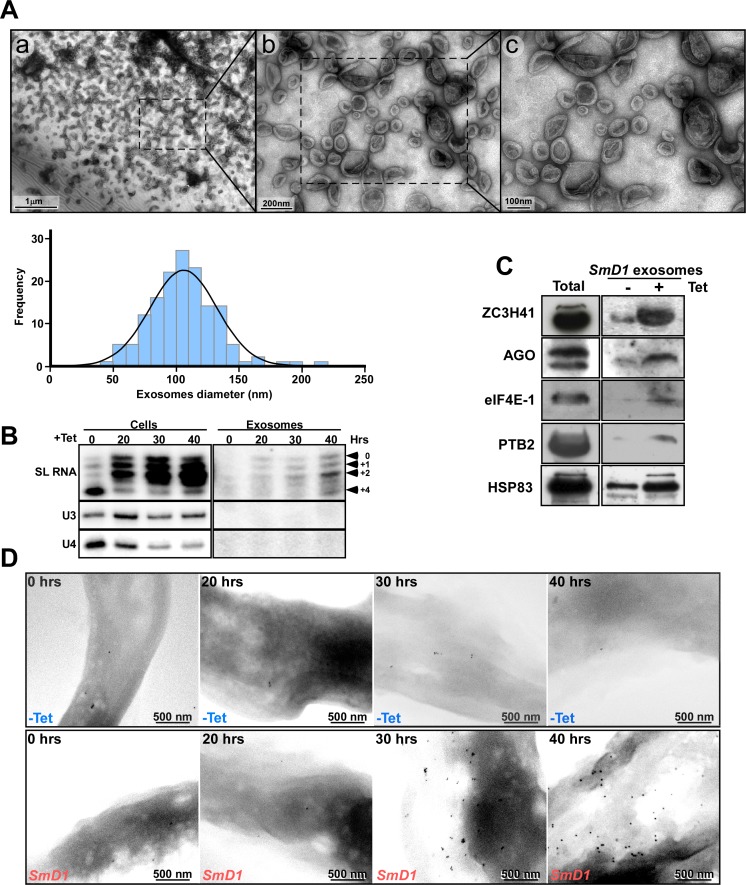
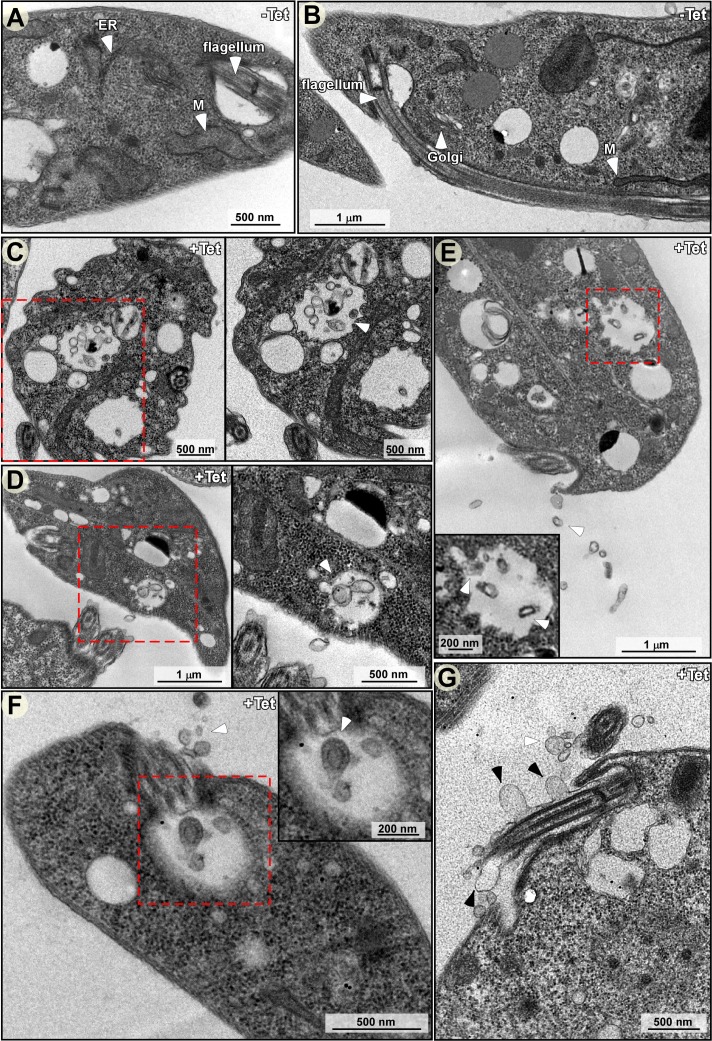
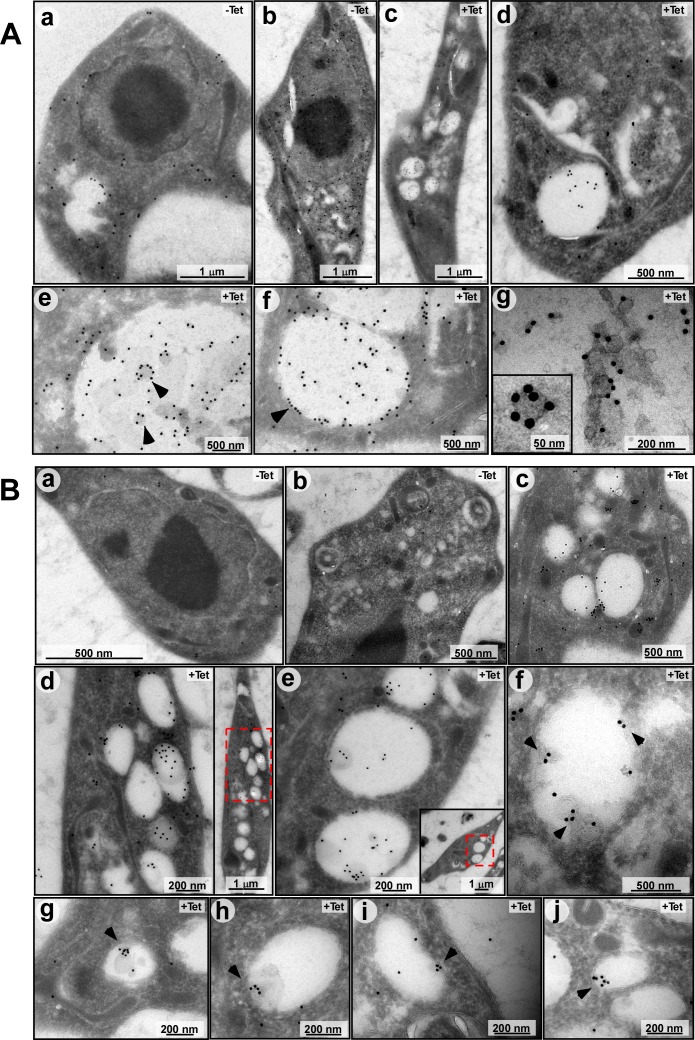
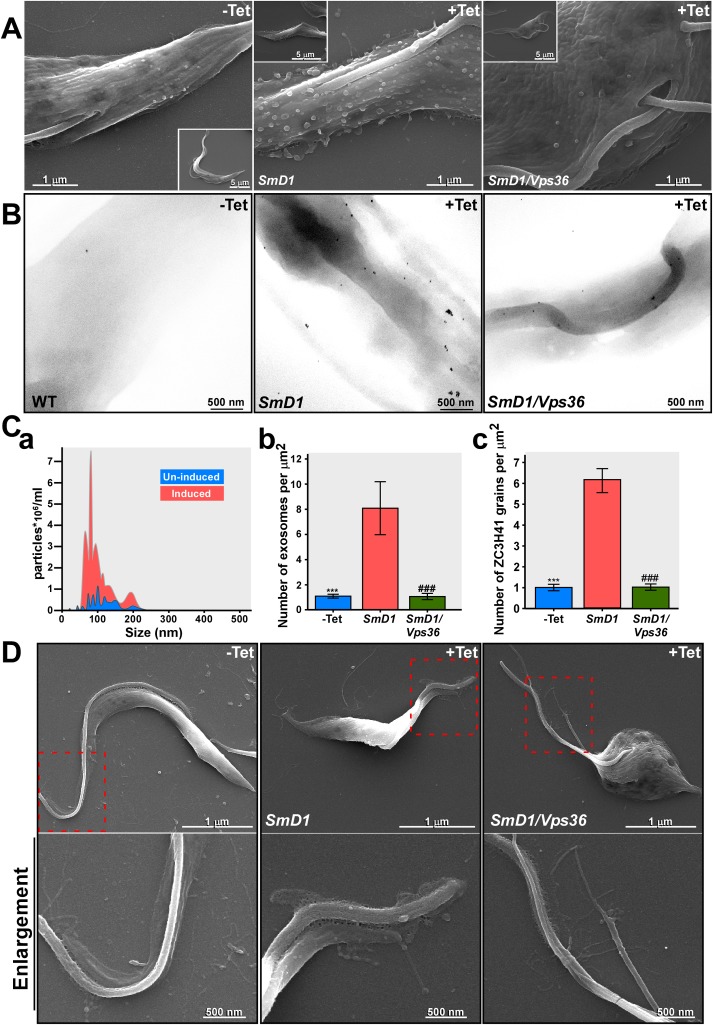
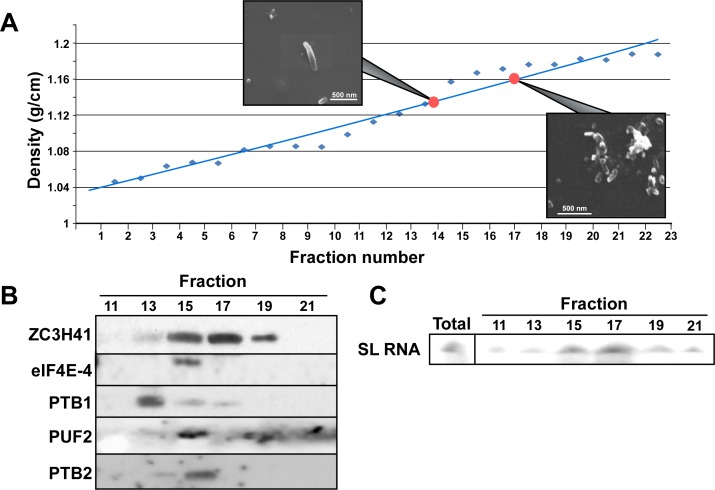
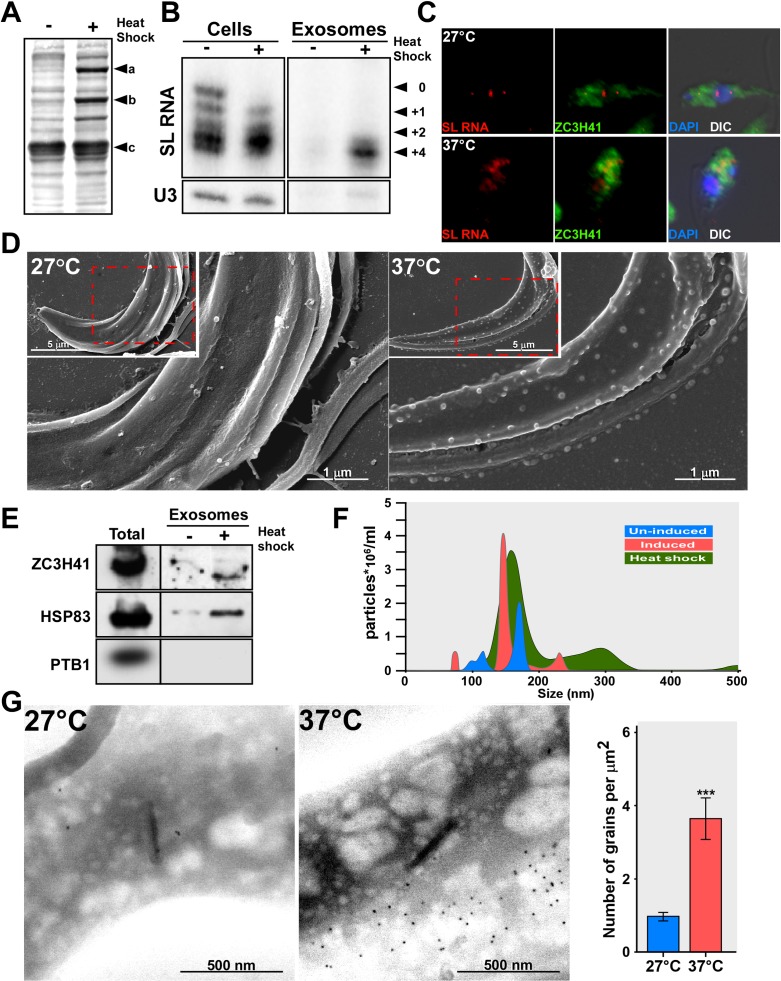
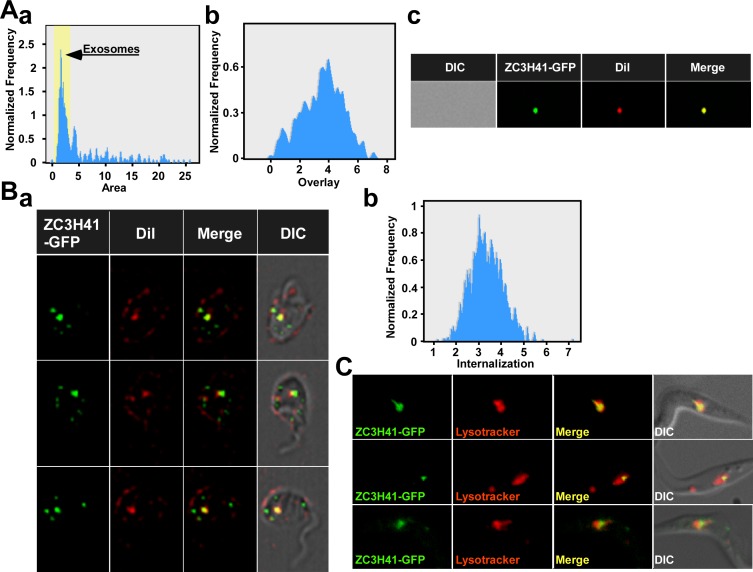
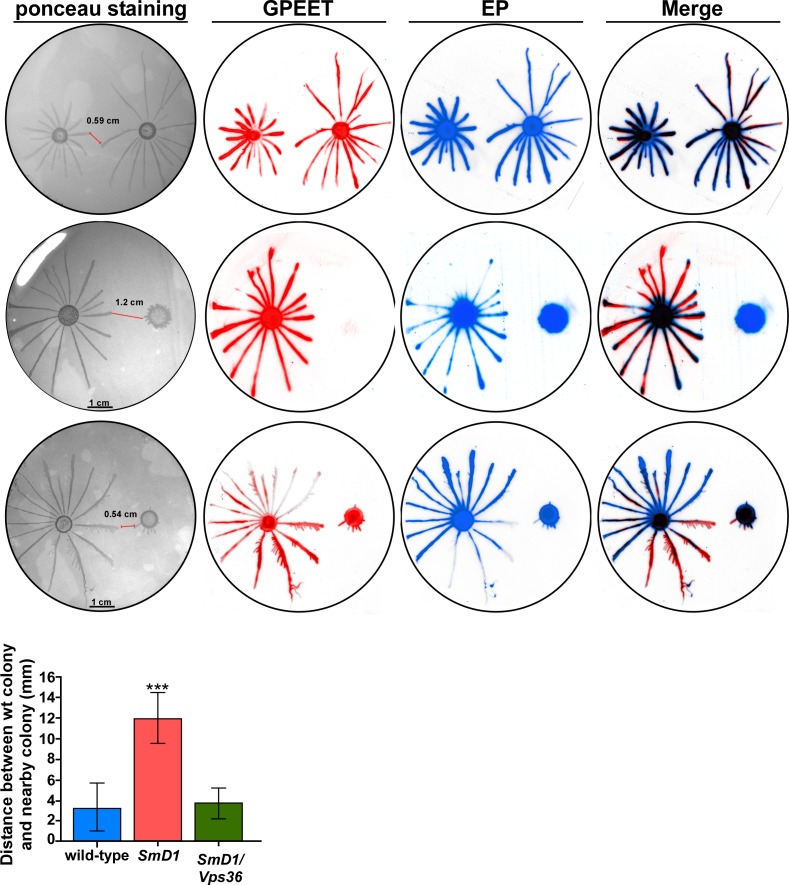
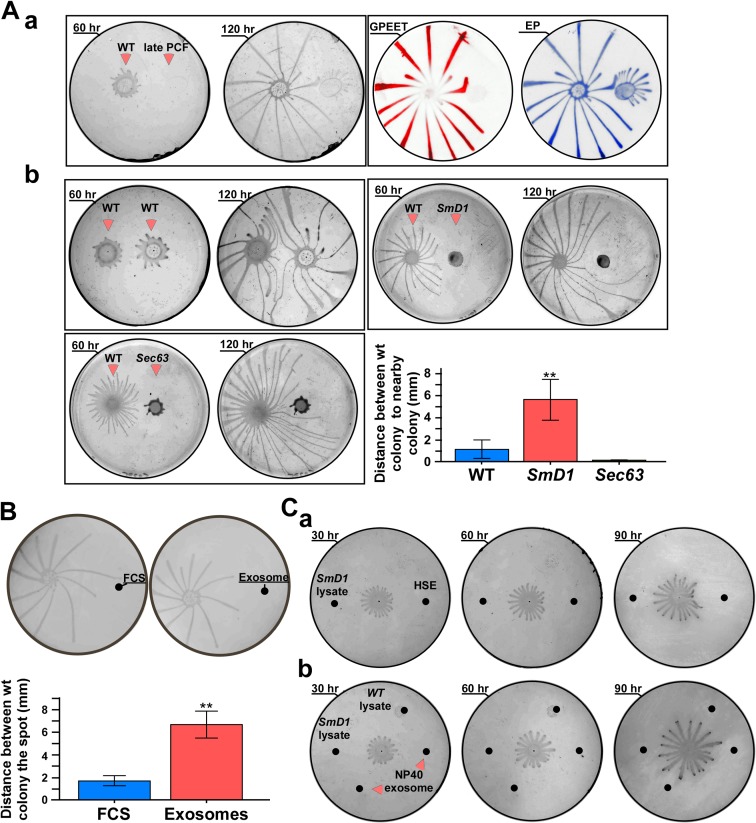
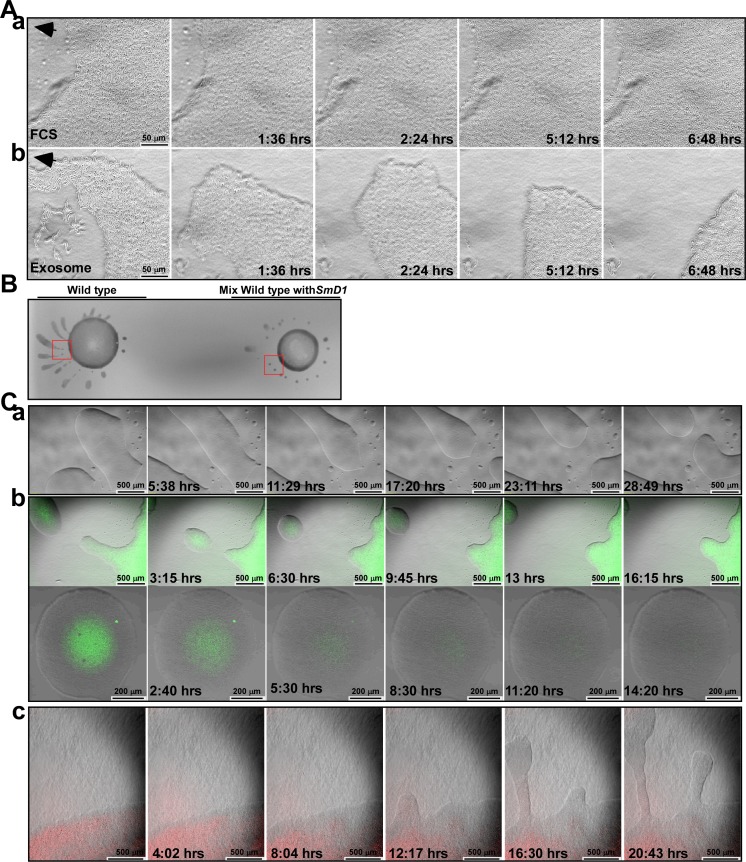
Extracellular vesicles (EV) secreted by pathogens function in a variety of biological processes. Here, we demonstrate that in the protozoan parasite Trypanosoma brucei, exosome secretion is induced by stress that affects trans-splicing. Following perturbations in biogenesis of spliced leader RNA, which donates its spliced leader (SL) exon to all mRNAs, or after heat-shock, the SL RNA is exported to the cytoplasm and forms distinct granules, which are then secreted by exosomes. The exosomes are formed in multivesicular bodies (MVB) utilizing the endosomal sorting complexes required for transport (ESCRT), through a mechanism similar to microRNA secretion in mammalian cells. Silencing of the ESCRT factor, Vps36, compromised exosome secretion but not the secretion of vesicles derived from nanotubes. The exosomes enter recipient trypanosome cells. Time-lapse microscopy demonstrated that cells secreting exosomes or purified intact exosomes affect social motility (SoMo). This study demonstrates that exosomes are delivered to trypanosome cells and can change their migration. Exosomes are used to transmit stress signals for communication between parasites.


Conflict of interest statement

The authors have declared that no competing interests exist.

Figures

Fig 1
Fig 1. Identification of SL RNA associated proteins.
(A) Identification of proteins purified by affinity-selection. Cells containing the SmD1 silencing construct were induced for 48h, as previously described [9]. An extract was prepared from ×ばつ109 cells. The extract was separated on a Superdex 200 column, and SL RNA containing fractions were subjected to affinity selection as described in Materials and Methods. Proteins obtained from the control experiment lacking the selecting oligonucleotide (-Oligo) and proteins from the affinity selected particles (+Oligo) were extracted from the streptavidin beads, separated on a 12% acrylamide SDS gel, and stained with silver. (B) ZC3H41silencing. Cell lines expressing the ZC3H41 stem-loop silencing construct were induced for 48 hrs. Cells (~106 cells/ lane) were subjected to western analysis using ZC3H41 and PTB1 antibodies. (C) ZC3H41 is an essential gene for trypanosome survival. Cells were either induced (+Tet) or un-induced (-Tet), and growth was monitored. The arrow indicates the time of tetracycline addition. The number of un-induced cells is designated by triangles, and of induced cells by squares. (D) ZC3H41 binds loosely to SL RNA. Cells expressing TAP-Myc-His- ZC3H41 fusion protein and the SmD1-silencing construct were silenced for 48 hrs. Cells (×ばつ109) were UV irradiated, as described in Materials and Methods. Extracts prepared from control (-UV) cells, and cells following UV irradiation were affinity selected on IgG beads. The RNA was extracted from the beads and analyzed by primer extension with SL and U3 RNAs specific primers. T, Total extract (5%); S, supernatant after removing the IgG beads (5%); P, the entire RNA sample bound to beads. The position of the cap-4 modification is indicated. (E) Depletion of ZC3H41 in SmE/ ZC3H41 silenced cells. Western analysis was performed, as described in panel B. (F) Levels of SL RNA under SmE and SmE/ ZC3H41 silencing. 10 μg of total RNA was subjected to primer extension with primers specific to SL RNA, U4, and U3 snoRNAs (S1 Table). The extension products were separated on a 6% denaturing gel. The identity of the cell line and the position of the modified cap nts are indicated. The statistical analysis represents the mean ± s.e.m of quantification from three independent experiments. **P <0.01, and ***P <0.005 compared to–Tet, using Student's t-test. (G) Changes in localization of ZC3H41 and SL RNA during SmD1 silencing. Cells carrying the SmD1 silencing construct were induced for the time indicated and subjected to in situ hybridization with SL RNA (red) and IFA with ZC3H41 antibodies (green). The nucleus was stained with DAPI. The merge was performed on DAPI staining and SL RNA hybridization and the time points of silencing are indicated.
Fig 2
Fig 2. MTR4 regulates the level of U snRNA, but does not affect SL RNA, under SmD1 silencing.
(A) Primer extension of SL, U2 and U3 RNAs during SmD1 silencing. Total RNA (10 μg) was extracted from cells silenced for the indicated times, and subjected to primer extension. The extension products were separated on a 6% denaturing gel. (B) The same experiment as in (A) but using RNA extracted from SmD1/Mtr4 silenced cells. (C) SL RNA granules are not P bodies. ZC3H41 localization with respect to P-bodies labeled with DHH1. Cells carrying the SmD1 silencing construct, and the YFP-DHH1 construct were silenced for 40 hrs. and stained for IFA using ZC3H41 and YFP antibodies (red and green respectively). The nucleus was stained with DAPI. (D) In situ hybridization with SL RNA. Cells carrying the SmD1 silencing construct and expressing YFP-DHH1 were induced for 40 hrs. and subjected to in situ hybridization with SL RNA (red) and immunofluorescence using YFP antibody for YFP-DHH1 (green). The nucleus was stained with DAPI. (E) SL RNA granules are not stress granules. Cells were silenced for 40 hrs. and stained by IFA using PTB1 antibodies (green stain) and were subjected to in situ hybridization with SL RNA (red). The nucleus was stained with DAPI. (F) as in (E) but using antibodies to eIF4E-1. The merge was performed between DAPI staining, IFA and in situ hybridization.
Fig 3
Fig 3. Exosomes secreted from SmD1 silenced cells.
(A) TEM analysis of the exosome-enriched fraction from SmD1 silenced cells. Exosomes were purified, from 109 cells after 40 hrs of silencing, and were subjected to TEM. (a) The entire field of exosomes; (b) and (c) show enlargement of a section indicated by a square on panel (a). Exosome size distribution. For the analysis, the size of 150 exosomes was determined from ten different images using ‘NIS-elements’ imaging Software (Nikon, USA). The data were analyzed by the one-sample Kolmogorov-Smirnov test (SPSS IBM, USA). The average size of each exosome was 106.1 ± 26.6 nm (p value for normal distribution, 0.69). (B) RNA is secreted via exosomes. Cells containing the SmD1 silencing construct were silenced for the indicated times (hours). RNA was prepared from the cells and from exosomes as described in Materials and Methods. The RNA was subjected to primer extension. The products were separated on a 6% acrylamide denaturing gel. The cap-4 nts are indicated. (C) Proteins are secreted with the exosomes. Proteins were extracted from exosomes prepared from 109 cells and were subjected to western analysis with the indicated antibodies. Total cell extract (20 μg) was used to monitor the specificity of the antibodies. (D) Immunogold-SEM detecting ZC3H41 protein on the surface of the parasite. Un-induced cells containing the SmD1 silencing construct (-Tet) and SmD1 silenced cells at the indicated time points were subjected to immunogold staining with specific anti-ZC3H41 antibodies. Backscatter images are presented; scale bars are indicated.
Fig 4
Fig 4. TEM analysis of SmD1 silenced cells.
Cells before and after silencing of SmD1 (40 hrs) were fixed, and ultra-thin sections were prepared and examined by TEM. The different ultra-structures are indicated. MVB, multivesicular bodies; ILV, intraluminal vesicles; M, mitochondrion; ER, Enodoplasmic reticulum; scale bar, 500 nm. (A and B) Un-induced cells (-Tet). (C-G) induced cells. Section showing MVB containing ILVs. (C-D) MVB located near the plasma membrane, and secreted exosome present on the cell surface. (E-F) EVs secreted from the cell membrane and flagella pocket. (G) Larger vesicles emerging from the flagellar membrane. The white arrow-heads indicate the ILVs and black arrow-heads the EVs.
Fig 5
Fig 5
(A) Immunogold TEM analysis demonstrating the location ZC3H41 in ILVs within MVBs. Cells carrying the SmD1 silencing construct, and the YFP-VPS36 construct were used. (a, b) un-induced (-Tet) or (c-g) silenced for 40 hrs. (+Tet) were used to prepare Cryo-EM sections, and were subjected to immunogold analysis. Imaging was performed using antibody to ZC3H41. (B) as in (A), but using anti-GFP antibody to detect the VPS36. The scale bars are indicated.
Fig 6
Fig 6. Exosome detection by SEM of SmD1 and SmD1/Vps36 silenced cells.
(A) Cells carrying the SmD1 silencing construct before (-Tet), and after 40 hrs of silencing (+Tet) were fixed and visualized under EM. The scale bars and the cells identity are indicated. (B) SEM immunogold. SmD1 and SmD1/Vps36 silenced cells as describe in A were subjected to immunogold analysis with ZC3H41 antibodies. The scale bars and the cells identity are indicated. (C) Quantitative analysis of secreted exosomes (a) NanoSight analysis. To quantitate the number of exosomes, exosomes were prepared from un-induced cells (109) or after 40 hrs. of induction. The exosomes were analyzed by NanoSight. Un-induced (blue); SmD1 silenced cells (red). (b) Quantitation of exosomes from EM images. The number of exosomes was determined by counting exosomes present in a given surface area. 12 independent images for each of the panels were analyzed. The number of exosomes per μm2 is given. Statistical analysis was performed using one-way ANOVA, post hoc–Bonferroni-test implemented in SPSS (IBM, USA) ***/### P <0.005 compared to +Tet. (c) Quantitation of immunogold analysis with ZC3H41 antibodies. Twenty different images were analyzed. The size of each cell was calculated and the number of grains per μm2 is given. Statistical analysis was performed as described in panel (Cb). (D) High resolution SEM demonstrating nanotubes near the flagellar pocket. Cells (as indicated on the top of each frame) before silencing (-Tet), and after 40 hrs of silencing were visualized by SEM. Higher magnification of the sections is indicated. The scale bars and the cells identity are indicated.
Fig 7
Fig 7. The SL RNA exosomes are distinct from stress granules and nanotubes.
Exosomes were prepared from SmD1-silenced cells grown in medium containing FCS free of bovine exosomes, after 2 days of silencing. The exosomes were fractionated on a 15–50% sucrose gradient at 39,900 rpm in a SW41 rotor for 20 hr. Fractions (500 μl) were subjected to SEM and western analyses as well as to primer extension to monitor SL RNA. (A) Fractionation of vesicles on the sucrose gradient. The density of the fractions are given and SEM images derived from fractions 13–14 and fractions 17–18 are presented. (B) Western analysis. Fractions 10–21 were subjected to western analysis using the indicated antibodies. (C) The location of SL RNA. RNA was extracted from the different fractions and subjected to primer extension.
Fig 8
Fig 8. SL RNA accumulates during heat-shock and is secreted by exosomes.
(A) Induction of heat-shock proteins. Cells (107), were incubated at either 27°C or 37°C (heat-shock) for 40 minutes in Methionine-free medium; 35S-Methionine (100 μCi) was added for 10 min followed by a 5 min chase. The cells were collected, and the proteins were separated on a 10%-SDS gel and subjected to autoradiography.a-HSP83 b-HSP70 c-tubulin. (B) SL RNA accumulates under heat-shock. Cells (108 in 10 ml) were incubated at 27°C or 37°C, for 1h. RNA was prepared from semi-purified exosomes and analyzed by primer extension. The SL RNA cap-4 modifications are indicated. (C) SL RNA and ZC3H41 are transported from the nucleus to the cytoplasm under heat-shock. Cells were incubated for 1hr at the temperature indicated and subjected to in situ hybridization. Nuclei were stained with DAPI. The merge was performed between IFA, in situ hybridization and DAPI staining. (D) SEM analysis of un-induced cells, and cells exposed to heat-shock. Cells were either incubated at 27°C or 37°C (heat-shock) for 1 hour. After incubation, the cells were fixed and visualized under EM; the scale bars and the treatment of the cells are indicated. (E) Exosomes are secreted under heat-shock. Cells (108) were incubated at either 27°C or 37°C (heat-shock) for 40 min, and exosomes were prepared as described in Materials and Methods, and subjected to western analysis with the indicated antibodies. (F) Quantitation of the exosomes secreted under heat-shock. Exosomes from wild-type, SmD1 silenced cells and heat-shocked cells were analyzed by NanoSight. Exosomes from un-induced cells (blue), SmD1 silenced cells (red), and heat-shock (green). (G) SEM-Immunogold to detect ZC3H41 secretion under heat-shock. Wild-type cells were incubated for 1h at the indicated temperature. Cells were subjected to immunogold staining. The backscatter images are presented; scale bars are indicated. The statistical analysis represents the mean ± S.E.M **P <0.01, and ***P <0.005 compared to–Tet, using Student's t-test.
Fig 9
Fig 9. Entry of exosomes to target cells.
(A) Fluorescence of exosomes stained with DiL and containing the ZC3H41-GFP. Exosomes (20μl, representing 1/10 of the exosome preparation from 109 cells) were incubated at room-temperature with 1:1000 dilution of the DiL and were analyzed by ImageStream. (a) The number of particles versus their area is presented. The peak corresponding to exosomes is indicated. (b) The overlap between the two fluorescent dyes. (c) Single exosome fluorescence. The fluorescence of GFP and DiL was recorded in addition to the overlay. DIC, and the different fluorophores are indicated. (B) Exosomes enter wild-type trypanosome cells. (a) The exosomes described in (A) (40 μl) were incubated with 100μl containing 106 cells. ImageStream analysis was performed after 10 minutes, and single-cell fluorescence of ZC3H41–GFP and DiL was monitored. (b) The level of internalization of the two fluorophores. (C) Live imaging of cells incubated with ZC3H41-GFP exosomes and lysotracker. Exosomes were prepared from 109 cells, and 1/10 of the preparation (20 μl) was incubated with 100μl containing 106 cells for 1 hr and then lysotracker was added, and cells were visualized.
Fig 10
Fig 10. Exosome secretion repels the migration of wild-type cells.
Cells (~107) were plated on semi solid agar containing tetracycline at a distance of 2.5 cm from each other. The SmD1 and SmD1/Vps36 silenced cells were plated on plates containing tetracycline. Pattern formation was analyzed 2 days after plating. The parasites from the plates were blotted, and the blot was stained with Ponceau and then reacted with anti-GPEET and anti-EP. The distance between the wild-type colony and the adjacent colony is presented. The statistical analysis represents the mean ± s.e.m **P< 0.01 comparing the distance between wild-type to wild-type, wild-type to SmD1and wild-type to SmD1/Vps36 silenced cells based on three independent experiments.
Fig 11
Fig 11
(A) Effect on wild-type migration by different cell type. (a) Late PCF cells do not express GPEET. Cells were plated on semi solid agar at a distance of 2.5 cm from each other. The plates were subjected to western analysis with GPEET and EP antibodies. The identity of the cells and incubation time are indicated. (b) Migration of cells following longer incubation on plates. Cells were plated on semi solid agar containing tetracycline at a distance of 2.5 cm from each other. For longer time points, ×ばつ105 cells (in 5 μl) were used. Wild-type, SmD1 and SEC63 were silenced on plates for the time indicated. Statistical analysis represents the mean ± S.E.M **P< 0.01 comparing the distance between wild-type cells and the silenced cells (based on three biological replicates). (B) Free exosomes but not FCS divert the migration of parasites. Cells (~107) were plated on semi solid agar containing tetracycline at a distance of 2.5 cm from each other. The plates were seeded with either a solution of FCS (5 μg/μl) or with semi-purified exosomes (5 μg/μl). The drops (5 μl) of FCS and of exosomes (5 μl of extract from 109 in 200μl) were added at the same spot every 12 hrs. for 3 days; scale bar, 5 mm. Statistical analysis represents the mean ± S.E.M **P< 0.01 comparing the distance between wild-type cells and exosomes versus wild-type cells and FCS (based on three biological replicates). (C) Damaged exosomes or protein lysates do not affect the migration of cells. (a) Migration of wild-type cells was monitored on plates that were seeded with exosomes prepared from cells subjected to heat-shock (HSE) (5 μl, exosomes prepared from 109 cells i.e. 25 μg), and 25 μg of lysate prepared from SmD1 silenced cells; (b) the same as in (a), but the plate was seeded with 25 μg of lysate prepared from SmD1 silenced cells, lysate from wild-type cells, and exosomes which were pre-treated with NP40. The exosomes (1/10 purified from 109 cells) from SmD1 silenced cells (25 μg) were mixed with NP40 to 0.05% and were incubated over night before seeding on the plates. The plates were incubated for the indicated times. The position to which the substances were seeded are marked with black spots. The experiment was repeated three times.
Fig 12
Fig 12. Wild-type cells crawl over FCS but "escape" from exosomes.
(A) Wild-type cells were plated on semi-solid agar and incubated 3 days while projections fully developed. The cells at the edge of the projections were analyzed by time-lapse microscopy. (a) FCS (10μg) was placed at the edge of one projection (S3 Video); (b) exosomes (10 μg) were placed at another projection, and cell movement was monitored (S4 Video). The images taken from S3 Video (a) and S4 Video (b) are presented at the indicated time points following spotting of FCS or exosomes. Scale bar and time points of recording are indicated. (B) Colony morphology of wild-type cells and a mixture of wild-type and SmD1-silenced cells. Wild-type cells or a mixture of wild-type and SmD1 silenced cells (silenced for 2 days prior to plating) were plated, and the morphology of the colony was recorded after plating. (C) Time lapse microscopy: (a) The social motility of wild-type cells. Wild-type cells were monitored) S10 Video. The images taken from this video are presented at the indicated time points. (b) Effect of cells secreting exosomes on the social motility of wild-type cells. Wild-type and SmD1 silenced cells (silenced for 2 days prior to plating) expressing ZC3H41- GFP (green) were plated as described in Materials and Methods. S11 Video illustrates the effect of SmD1-silenced cells on the development of projections. The upper panel shows images that were taken from this video at the indicated time points. Scale bar and time points of recording are indicated. The lower panel (4X magnification) is at higher magnification showing the "balls" formed by these cultures. Images derived from (S12 Video) at the indicated time point are presented. Scale bar and time points of recording are indicated. (c) Wild-type cells were mixed with SmD1/Vps36 silenced cells (2 days prior to plating) expressing HIS2-RFP. The cells were monitored for 20 hr (S13 Video). The images taken from this video are presented at the indicated time points. Scale bar and time points of recording are indicated.

References

    1. Van Den Abbeele J, Claes Y, van Bockstaele D, Le Ray D, Coosemans M. Trypanosoma brucei spp. development in the tsetse fly: characterization of the post-mesocyclic stages in the foregut and proboscis. Parasitology. 1999;118:469–78. Epub 1999年06月11日. - PubMed
    1. Sharma R, Gluenz E, Peacock L, Gibson W, Gull K, Carrington M. The heart of darkness: growth and form of Trypanosoma brucei in the tsetse fly. Trends Parasitol. 2009;25(11):517–24. Epub 2009年09月15日. PubMed Central PMCID: PMC3770903. 10.1016/j.pt.200908001 - DOI - PMC - PubMed
    1. Oberle M, Balmer O, Brun R, Roditi I. Bottlenecks and the maintenance of minor genotypes during the life cycle of Trypanosoma brucei. PLoS Pathog. 2010;6(7):e1001023 Epub 2010年08月06日. PubMed Central PMCID: PMC2912391. 10.1371/journal.ppat.1001023 - DOI - PMC - PubMed
    1. Gunzl A. The pre-mRNA splicing machinery of trypanosomes: complex or simplified? Eukaryot Cell. 2010;9(8):1159–70. Epub 2010年06月29日. PubMed Central PMCID: PMC2918933. 10.1128/EC.00113-10 - DOI - PMC - PubMed
    1. Michaeli S. Trans-splicing in trypanosomes: machinery and its impact on the parasite transcriptome. Future Microbiol. 2011;6(4):459–74. Epub 2011年04月30日. 10.2217/fmb.11.20 - DOI - PubMed

Publication types

LinkOut - more resources

Cite

AltStyle によって変換されたページ (->オリジナル) /