This site needs JavaScript to work properly. Please enable it to take advantage of the complete set of features!
Skip to main page content
U.S. flag

An official website of the United States government

Dot gov

The .gov means it’s official.
Federal government websites often end in .gov or .mil. Before sharing sensitive information, make sure you’re on a federal government site.

Https

The site is secure.
The https:// ensures that you are connecting to the official website and that any information you provide is encrypted and transmitted securely.

NIH NLM Logo
Log in
Access keys NCBI Homepage MyNCBI Homepage Main Content Main Navigation
. 2016 Nov 9;11(11):e0165362.
doi: 10.1371/journal.pone.0165362. eCollection 2016.

Predators, Prey and Habitat Structure: Can Key Conservation Areas and Early Signs of Population Collapse Be Detected in Neotropical Forests?

Affiliations

Predators, Prey and Habitat Structure: Can Key Conservation Areas and Early Signs of Population Collapse Be Detected in Neotropical Forests?

Benoit de Thoisy et al. PLoS One. .

Abstract

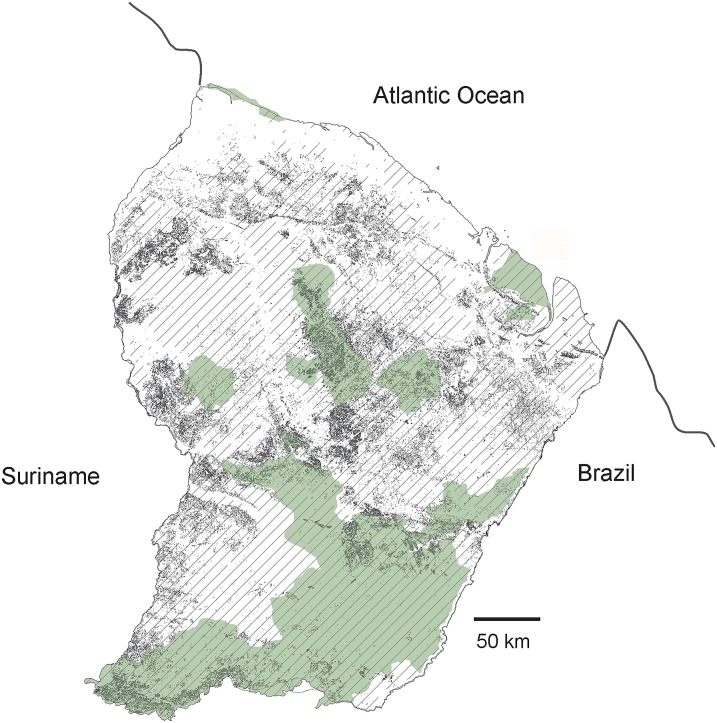
Tropical forests with a low human population and absence of large-scale deforestation provide unique opportunities to study successful conservation strategies, which should be based on adequate monitoring tools. This study explored the conservation status of a large predator, the jaguar, considered an indicator of the maintenance of how well ecological processes are maintained. We implemented an original integrative approach, exploring successive ecosystem status proxies, from habitats and responses to threats of predators and their prey, to canopy structure and forest biomass. Niche modeling allowed identification of more suitable habitats, significantly related to canopy height and forest biomass. Capture/recapture methods showed that jaguar density was higher in habitats identified as more suitable by the niche model. Surveys of ungulates, large rodents and birds also showed higher density where jaguars were more abundant. Although jaguar density does not allow early detection of overall vertebrate community collapse, a decrease in the abundance of large terrestrial birds was noted as good first evidence of disturbance. The most promising tool comes from easily acquired LiDAR data and radar images: a decrease in canopy roughness was closely associated with the disturbance of forests and associated decreasing vertebrate biomass. This mixed approach, focusing on an apex predator, ecological modeling and remote-sensing information, not only helps detect early population declines in large mammals, but is also useful to discuss the relevance of large predators as indicators and the efficiency of conservation measures. It can also be easily extrapolated and adapted in a timely manner, since important open-source data are increasingly available and relevant for large-scale and real-time monitoring of biodiversity.


Conflict of interest statement

The authors have declared that no competing interests exist.

Figures

Fig 1
Fig 1. French Guiana study sites, with the protected areas.
Protected areas: nature reserves and national parks, in green. Locations of the sites where camera-trap surveys were implemented (1, Montagne de Fer; 2, Counami; 3, Montagne de Kaw; 4, Nouragues) in light brown; locations of the areas where line-transects were implemented in dark brown; and jaguar habitats from less favorable (light grey) to more favorable (dark grey).
Fig 2
Fig 2. Biomass Index (kg-1 ×ばつ km of transect) of a selected set of terrestrial birds and mammals, according to the Human Footprint Index, and associated correlation curves.
The four study sites for jaguar density assessment are given on the index scale, according to their mean value. The two pictures show sites with a 5–10 Index value (left) and a 15–20 Index value (right).
Fig 3
Fig 3. Field surveys required to assess abundance of ungulates and two frugivorous birds, based on 40 surveys (up), and the number of jaguars based on four study areas (down).
Top: the r coefficient correlation shows the correlation between the stabilized abundance (sampling effort> 100 km) and abundance assessed with a lesser sampling effort. The correlation is derived from 40 surveys.
Fig 4
Fig 4. Fauna communities on the four study sites with implementation of both camera-trapping and linear transects: jaguar density, biomass index of mammal prey, biomass index of terrestrial bird prey.
Fig 5
Fig 5. French Guiana more favorable habitats of prey.
Protected areas: nature reserves and national parks, in green. Hatchings: area with Human Footprint Index < 15 (thresold value allowing maintenance of the abundance of most of prey species). Dark grey: forest areas with canopy roughness> 12, favoring higher biomass of prey.

References

    1. Butchart SHM, Walpole M, Collen B, van Strien A, Scharlemann JPW, Rea A, et al. Global Biodiversity: Indicators of Recent Declines. Science 2010; 328: 1164–1168 10.1126/science.1187512 - DOI - PubMed
    1. Tittensor DP, Walpole M, Hill SLL, Boyce DG, Britten GL, Burgess ND, et al. 2014. A mid-term analysis of progress toward international biodiversity targets. Science 2014; 346: 241–244. 10.1126/science.1257484 - DOI - PubMed
    1. Hansen MC, Potapov PV, Moore R, Hancher M, Turubanova SA, Tyukavina A, et al. High-Resolution Global Maps of 21st-Century forest cover change. Science 2013; 342: 850–853. 10.1126/science.1244693 - DOI - PubMed
    1. Wilkie DS, Bennett EL, Peres CA, Cunningham AA. The empty forest revisited. Annals New York Academy of Sciences 2011; 1223: 120–128. - PubMed
    1. Jorge MLSP, Galetti M, Ribeiro MC, Ferraz KMPMB. Mammal defaunation as surrogate of trophic cascades in a biodiversity hotspot. Biological Conservation 2013; 163: 4–57.

LinkOut - more resources

Cite

AltStyle によって変換されたページ (->オリジナル) /