This site needs JavaScript to work properly. Please enable it to take advantage of the complete set of features!
Skip to main page content
U.S. flag

An official website of the United States government

Dot gov

The .gov means it’s official.
Federal government websites often end in .gov or .mil. Before sharing sensitive information, make sure you’re on a federal government site.

Https

The site is secure.
The https:// ensures that you are connecting to the official website and that any information you provide is encrypted and transmitted securely.

NIH NLM Logo
Log in
Access keys NCBI Homepage MyNCBI Homepage Main Content Main Navigation
. 2016 Dec 20;113(51):14601-14608.
doi: 10.1073/pnas.1604985113. Epub 2016 Oct 24.

Climatic and evolutionary drivers of phase shifts in the plague epidemics of colonial India

Affiliations

Climatic and evolutionary drivers of phase shifts in the plague epidemics of colonial India

Joseph A Lewnard et al. Proc Natl Acad Sci U S A. .

Abstract

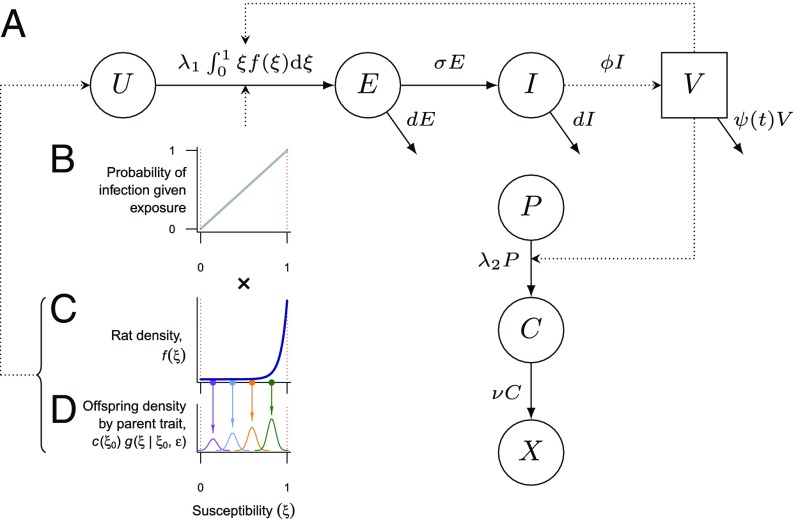
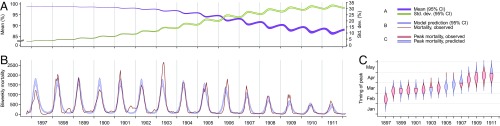
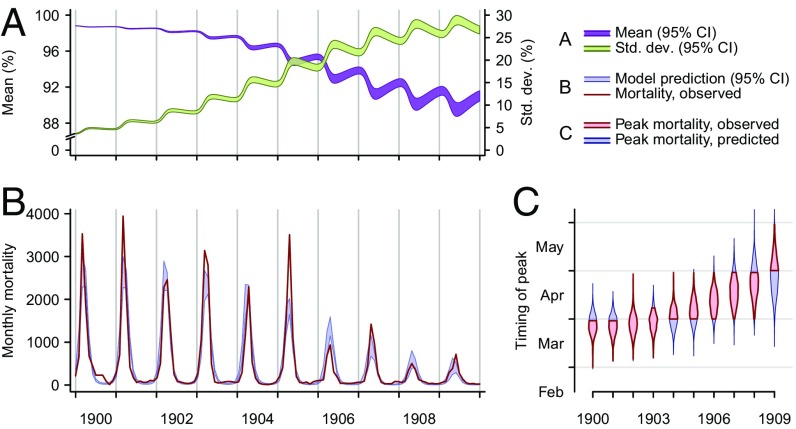
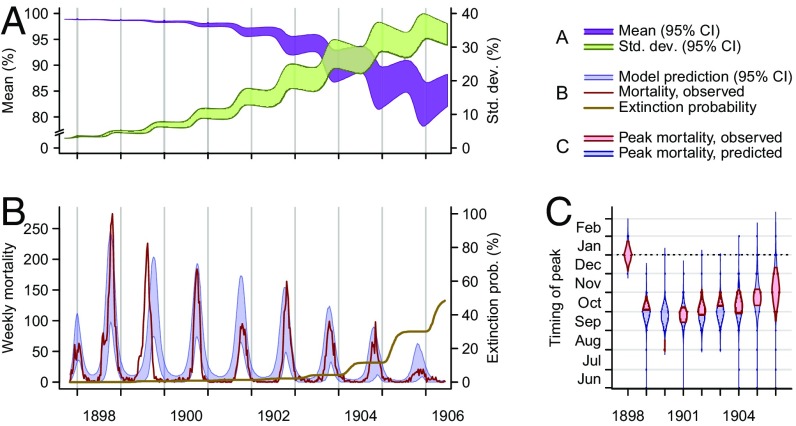
Immune heterogeneity in wild host populations indicates that disease-mediated selection is common in nature. However, the underlying dynamic feedbacks involving the ecology of disease transmission, evolutionary processes, and their interaction with environmental drivers have proven challenging to characterize. Plague presents an optimal system for interrogating such couplings: Yersinia pestis transmission exerts intense selective pressure driving the local persistence of disease resistance among its wildlife hosts in endemic areas. Investigations undertaken in colonial India after the introduction of plague in 1896 suggest that, only a decade after plague arrived, a heritable, plague-resistant phenotype had become prevalent among commensal rats of cities undergoing severe plague epidemics. To understand the possible evolutionary basis of these observations, we developed a mathematical model coupling environmentally forced plague dynamics with evolutionary selection of rats, capitalizing on extensive archival data from Indian Plague Commission investigations. Incorporating increased plague resistance among rats as a consequence of intense natural selection permits the model to reproduce observed changes in seasonal epidemic patterns in several cities and capture experimentally observed associations between climate and flea population dynamics in India. Our model results substantiate Victorian era claims of host evolution based on experimental observations of plague resistance and reveal the buffering effect of such evolution against environmental drivers of transmission. Our analysis shows that historical datasets can yield powerful insights into the transmission dynamics of reemerging disease agents with which we have limited contemporary experience to guide quantitative modeling and inference.

Keywords: immunoecology; infectious disease; modeling; vector-borne disease; zoonosis.


Conflict of interest statement

The authors declare no conflict of interest.

Figures

Fig. 1.
Fig. 1.
Schematic of compartmental transmission and susceptibility trait model structure. (A) Compartmental model for plague transmission among R. rattus. Uninfected rats (U) acquire infection at a rate determined by the applicable force of infection (λ1) and their susceptibility (ξ; B and C) and progress through exposed incubating (E) and infectious (I) states, shedding infected fleas (V) in the latter state. From a total susceptible human population (P), individuals progress to an incubation and disease stage (C) before death (X). Arrows indicate changes in epidemiological status over time. (B) The probability of infection given exposure is directly determined by the susceptibility trait ξ. (C) The density of rats with susceptibility ξ (here, an example distribution is plotted) is multiplied by the susceptibility at each point to determine the transition rate to exposed incubating (E) and (D) subjected to Gaussian parent–offspring dispersion, so that each parent rat with susceptibility ξ0 contributes to new generations, with offspring susceptibility drawn from normal distributions with mean ξ0 and variance ε2 to yield a new density of rats with susceptibility ξ. In the evolutionary model, the total density of offspring per member of the parent generation is scaled by the parent reproductive fitness value c(ξ0).
Fig. 2.
Fig. 2.
Epidemic dynamics in Mumbai. (A) Model-predicted mean susceptibility in the population [purple band, 95% credible interval (CI)] undergoes seasonal decreases along the course of the epidemic, and the SD of susceptibility in the population (green band, 95% CI) increases as the density of rats with susceptibility lower than one increases. (B) Model-predicted (blue band, 95% CI) and observed (red line) plague mortality cycles seasonally, decreasing as the mean susceptibility in the population decreases. (C) Model-predicted posterior probability density (blue violin plot) and observed (red interval) timing of peak mortality. As a consequence of the evolution of resistance, the timing of annual maxima in plague mortality shifts. Bands and violin plots are part of the range across 2,000 stochastic simulations.
Fig. 3.
Fig. 3.
Epidemic dynamics in Kolkata. (A) Model-predicted mean susceptibility in the population [purple band, 95% credible interval (CI)] undergoes seasonal decreases along the course of the epidemic, and the SD of susceptibility in the population (green band, 95% CI) increases as the density of rats with susceptibility lower than one increases. (B) Model-predicted (blue band, 95% CI) and observed (red line) plague mortality cycles seasonally, decreasing as the mean susceptibility in the population decreases. (C) Model-predicted posterior probability density (blue violin plot) and observed (red interval) timing of peak mortality. As a consequence of the evolution of resistance, the timing of annual maxima in plague mortality shifts. Bands and violin plots are part of the range across 2,000 stochastic simulations.
Fig. 4.
Fig. 4.
Epidemic dynamics in Belagavi. (A) Model-predicted mean susceptibility in the population [purple band, 95% credible interval (CI)] undergoes seasonal decreases along the course of the epidemic, and the SD of susceptibility in the population (green band, 95% CI) increases as the density of rats with susceptibility lower than one increases. (B) Model-predicted (blue band, 95% CI) and observed (red line) plague mortality cycles seasonally, decreasing as the mean susceptibility in the population decreases. The model-generated cumulative probability for plague extinction (brown line) increases near the end of the epidemic. The last season of epidemic disease in Belagavi was the 1905–1906 season. (C) Model-predicted posterior probability density (blue violin plot) and observed (red interval) timing of peak mortality. The epidemic in Belagavi began out of phase and rapidly adjusted to the season, a pattern the model recapitulates. Bands and violin plots represent central tendencies of the range across 2,000 stochastic simulations, discarding 968 simulations in which extinction occurred.
Fig. 5.
Fig. 5.
Model output regarding environmental forcing. Ninety-five percent credible intervals (CI) for the model-fitted lifespans of fleas across the seasons are plotted against ranges of temperatures reported in (A) Mumbai, (B) Kolkata, and (C) Belagavi. Plotted slopes from cities are adjusted for observed baseline differences in flea survival in the wild and under experimental conditions, which lead to distinct intercepts in regression models for (D) model-fitted relations between flea death rates and temperature, plotted against experimental data (points) showing flea survival at temperatures of 15 °C, 21 °C, and 38 °C. Points are jittered along the x axis from the original temperatures to avoid superimposition.
Fig. S1.
Fig. S1.
Epidemic dynamic predictions of the model without evolution by city. Epidemic trajectories [95% credible intervals (CI)] are plotted from 1,000 simulations sampling from the posterior distribution of model parameters.
Fig. S2.
Fig. S2.
Environmental forcing of flea survival in the model without evolution. Ninety-five percent credible intervals (CI) for the model-fitted relations between flea death rates and temperature are plotted, adjusting for differences among intercepts (baseline) in flea survival across cities and in the experiment to account for shorter observed flea survival under experimental conditions. Points represent experimental data and are jittered along the x axis from the original temperatures (16 °C, 21 °C, and 38 °C) to avoid overplotting. The model fitted without accounting for evolution provides poorer fit to experimental data compared with the model fitted with direct evolutionary mechanisms (Tables S6 and S7).

References

    1. Wolinska J, King KC. Environment can alter selection in host-parasite interactions. Trends Parasitol. 2009;25(5):236–244. - PubMed
    1. Sheldon BC, Verhulst S. Ecological immunology: Costly parasite defences and trade-offs in evolutionary ecology. Trends Ecol Evol. 1996;11(8):317–321. - PubMed
    1. Lochmiller RL, Deerenberg C. Trade-offs in evolutionary immunology: Just what is the cost of immunity? Oikos. 2000;88(1):87–98.
    1. Altizer S, Harvell D, Friedle E. Rapid evolutionary dynamics and disease threats to biodiversity. Trends Ecol Evol. 2003;18(11):589–596.
    1. Altizer S, Ostfeld RS, Johnson PTJ, Kutz S, Harvell CD. Climate change and infectious diseases: From evidence to a predictive framework. Science. 2013;341(6145):514–519. - PubMed

Publication types

MeSH terms

Cite

AltStyle によって変換されたページ (->オリジナル) /