This site needs JavaScript to work properly. Please enable it to take advantage of the complete set of features!
Skip to main page content
U.S. flag

An official website of the United States government

Dot gov

The .gov means it’s official.
Federal government websites often end in .gov or .mil. Before sharing sensitive information, make sure you’re on a federal government site.

Https

The site is secure.
The https:// ensures that you are connecting to the official website and that any information you provide is encrypted and transmitted securely.

NIH NLM Logo
Log in
Access keys NCBI Homepage MyNCBI Homepage Main Content Main Navigation
. 2016 Jun 9;12(6):e1005643.
doi: 10.1371/journal.ppat.1005643. eCollection 2016 Jun.

GLT-1-Dependent Disruption of CNS Glutamate Homeostasis and Neuronal Function by the Protozoan Parasite Toxoplasma gondii

Affiliations

GLT-1-Dependent Disruption of CNS Glutamate Homeostasis and Neuronal Function by the Protozoan Parasite Toxoplasma gondii

Clément N David et al. PLoS Pathog. .

Abstract

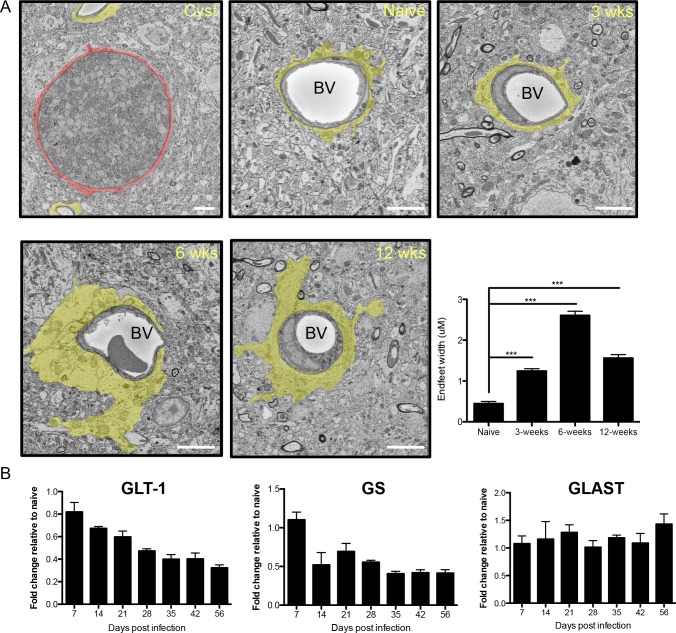
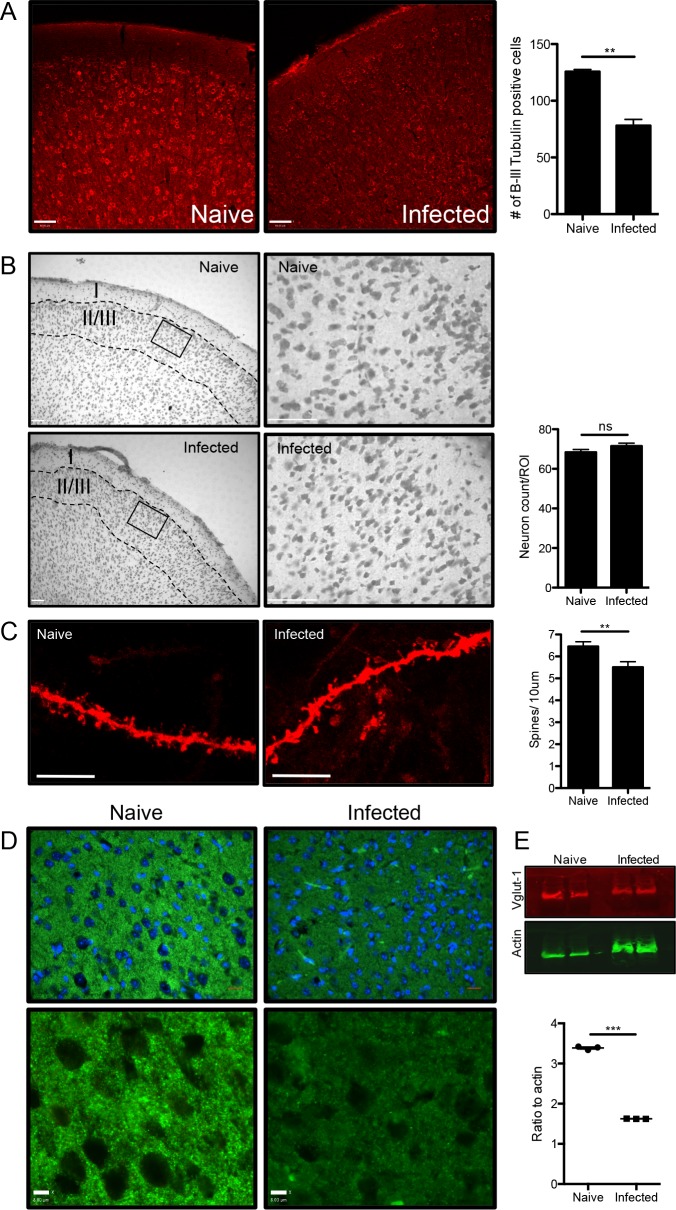
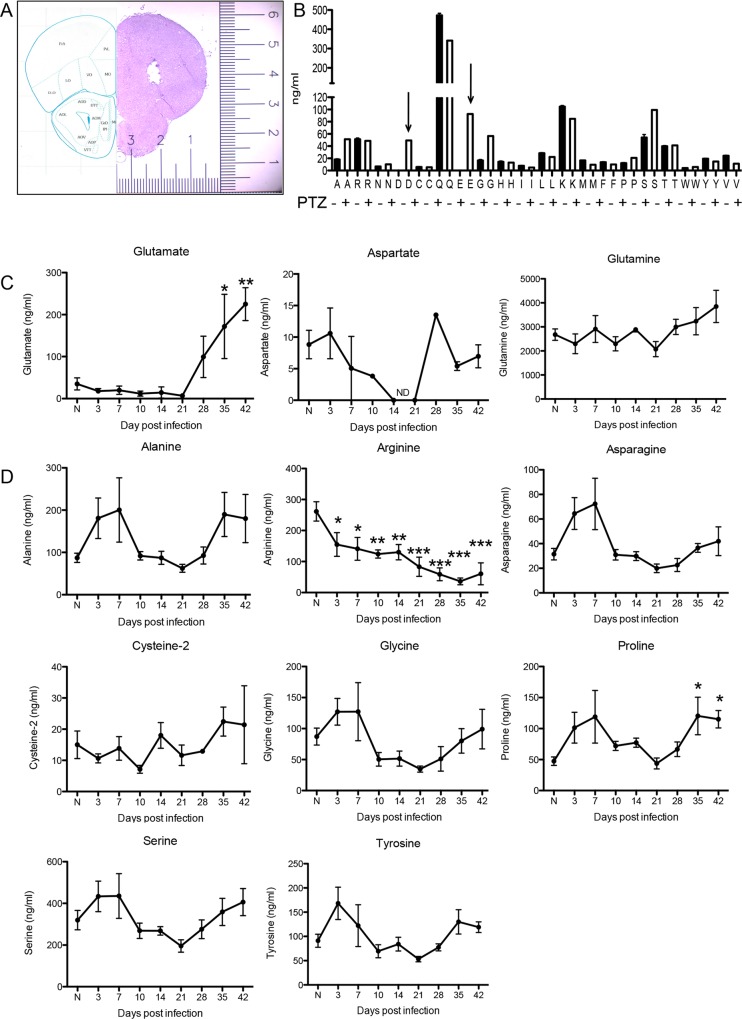
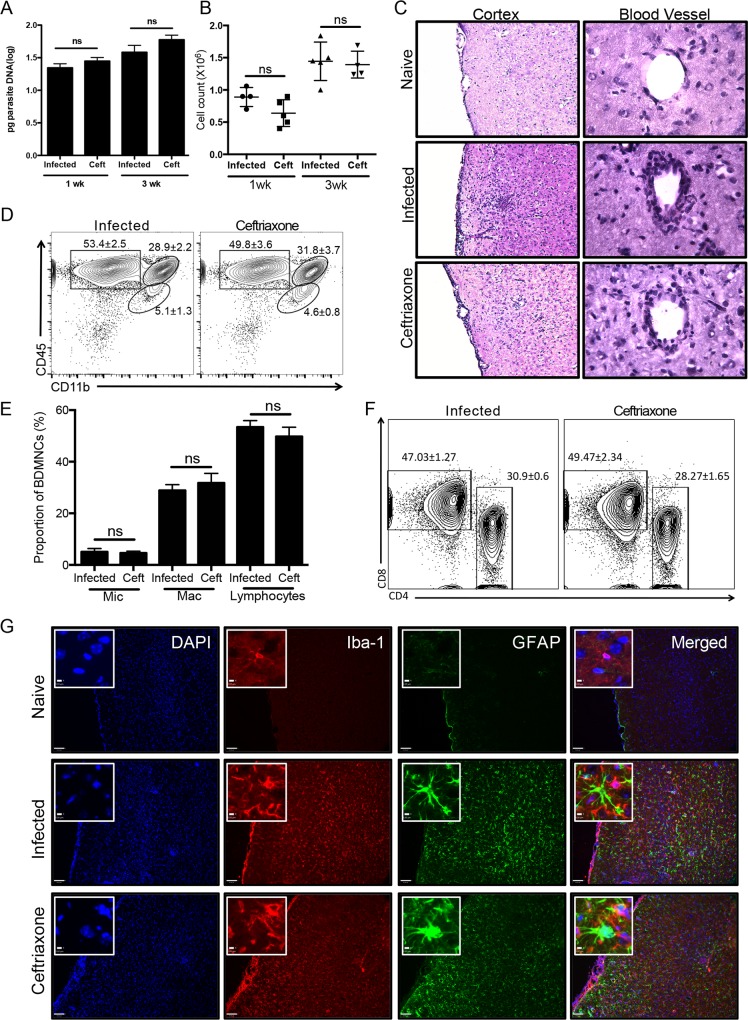
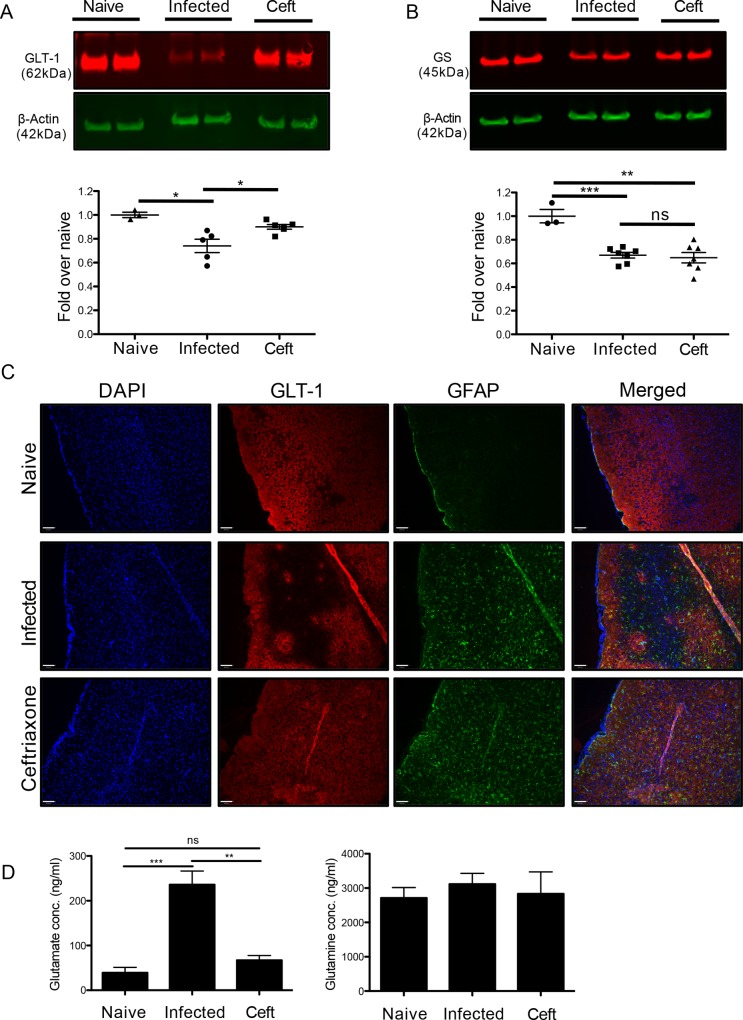
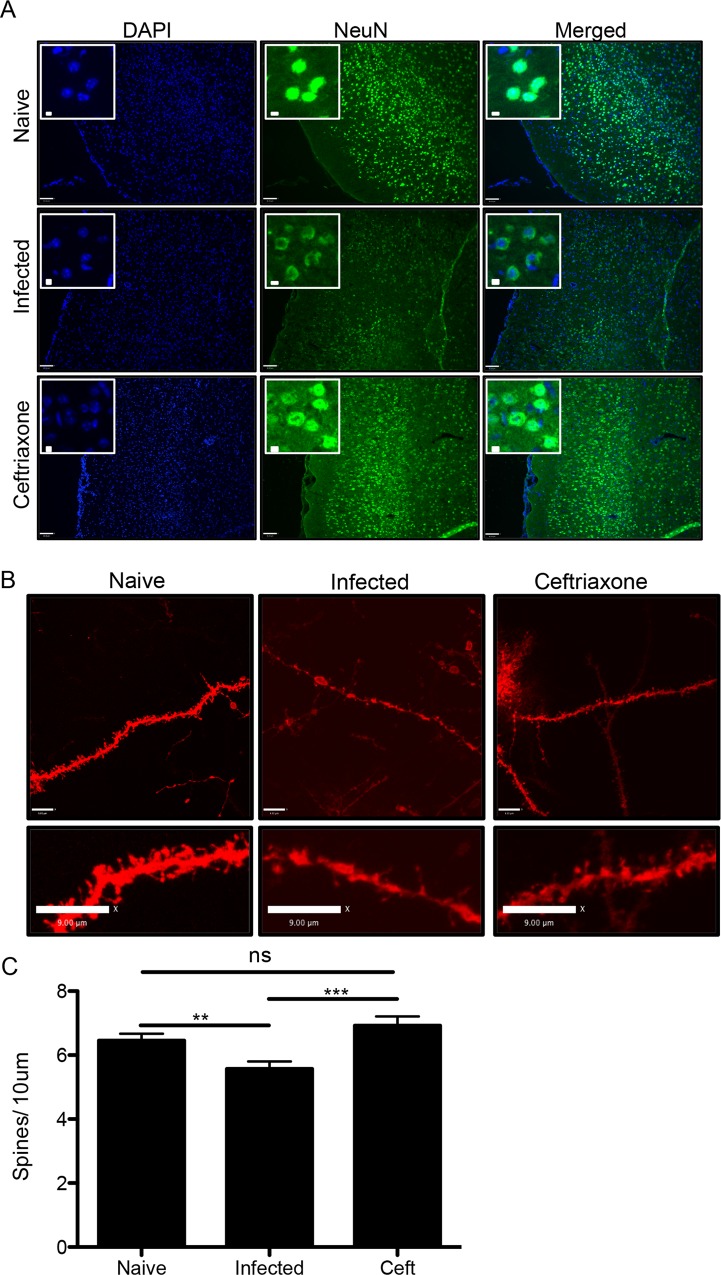
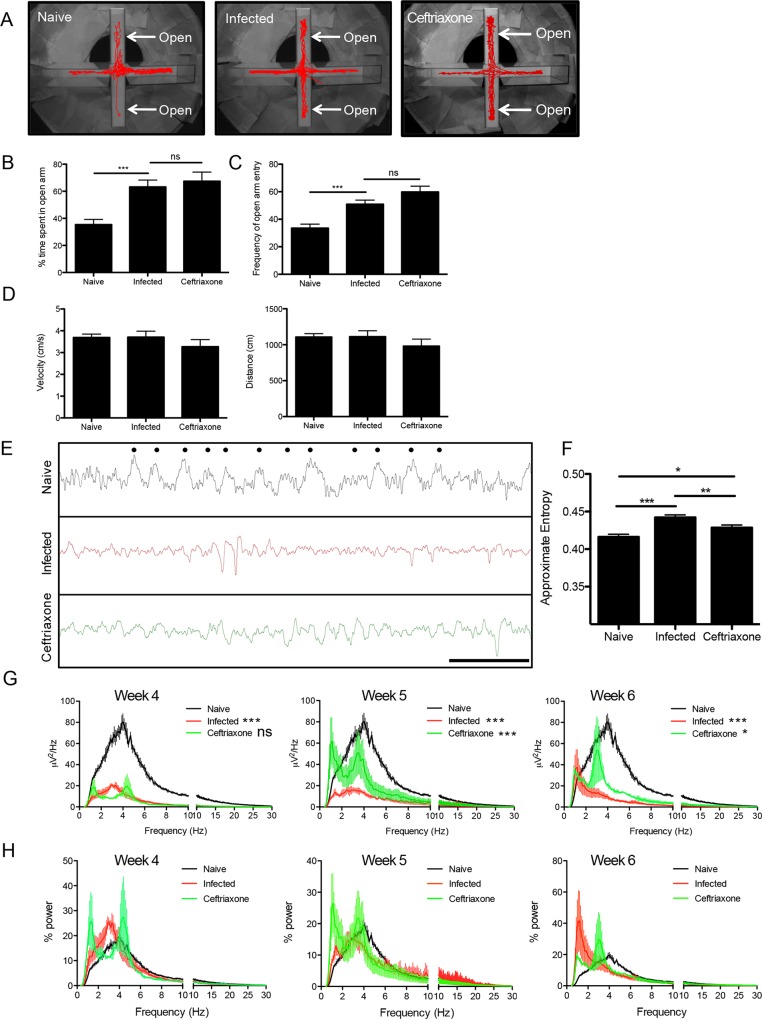
The immune privileged nature of the CNS can make it vulnerable to chronic and latent infections. Little is known about the effects of lifelong brain infections, and thus inflammation, on the neurological health of the host. Toxoplasma gondii is a parasite that can infect any mammalian nucleated cell with average worldwide seroprevalence rates of 30%. Infection by Toxoplasma is characterized by the lifelong presence of parasitic cysts within neurons in the brain, requiring a competent immune system to prevent parasite reactivation and encephalitis. In the immunocompetent individual, Toxoplasma infection is largely asymptomatic, however many recent studies suggest a strong correlation with certain neurodegenerative and psychiatric disorders. Here, we demonstrate a significant reduction in the primary astrocytic glutamate transporter, GLT-1, following infection with Toxoplasma. Using microdialysis of the murine frontal cortex over the course of infection, a significant increase in extracellular concentrations of glutamate is observed. Consistent with glutamate dysregulation, analysis of neurons reveal changes in morphology including a reduction in dendritic spines, VGlut1 and NeuN immunoreactivity. Furthermore, behavioral testing and EEG recordings point to significant changes in neuronal output. Finally, these changes in neuronal connectivity are dependent on infection-induced downregulation of GLT-1 as treatment with the ß-lactam antibiotic ceftriaxone, rescues extracellular glutamate concentrations, neuronal pathology and function. Altogether, these data demonstrate that following an infection with T. gondii, the delicate regulation of glutamate by astrocytes is disrupted and accounts for a range of deficits observed in chronic infection.


Conflict of interest statement

The authors have declared that no competing interests exist.

Figures

Fig 1
Fig 1. Infection induces chronic astrocytic morphological and molecular changes.
C57Bl/6 mice were infected with Toxoplasma and brains harvested. A) Scanning serial electron microscopy images analyzed for astrocytic endfeet width (highlighted in yellow). Quantification of endfoot width performed over the course of infection (scale bar: 5μm, BV: blood vessel). 6–10 Z stacks containing blood vessels (naïve n = 20; 3 weeks n = 75; 6 weeks n = 134; 12 weeks n = 82) 5–6μm wide were selected and average astrocyte endfoot width was quantified by measuring perivascular astrocyte area and dividing by the blood vessel circumference. Significance compared to naïve *** = p<0.001. The first panel depicts a Toxoplasma cyst inside a neuron (red) within the frontal cortex (unshaded micrographs provided in S1) B) RT-qPCR was performed on whole forebrain RNA with primers for GLT-1, glutamine synthetase (GS) and GLAST over the course of infection and is presented as fold increase over naïve.
Fig 2
Fig 2. Infection with Toxoplasma causes neuronal pathology.
Brain sections from naïve (n = 3) and 6 week infected (n = 3) mice were immunohistochemically stained for neuronal morphological markers A) 12-micron sections stained for ß-III Tubulin and quantified (p = 0.0012, scale bar: 90μm). B) Nissl staining of 40μm sections. Cortical layers labeled with roman numerals and representative ROI shown (square) and quantified (naïve: 34 ROIs, 1982 neurons; infected: 35 ROIs, 2073 neurons; p = 0.132) (scale bar 70μm and 18μm for ROI). C) Dendritic spines in the pre-frontal cortex were stained using the lipophilic dye DiI, and quantified (p = 0.0046) (scale bar: 7μm). D) VGlut-1 on 12μm sections of the frontal cortex (Scale bar: 15μm; insert scale bar: 8μm). E) Western blot and quantification of VGlut-1 from whole brain lysates (n = 3). All quantification was conducted blindly using Volocity software and significance tested using Student’s t-test ns = not significant; *** = p<0.001; ** = p<0.01.
Fig 3
Fig 3. Glutamate extracellular concentrations increase during infection.
Microdialysis was performed over the course of Toxoplasma infection taking measurements prior to (N) and after infection as indicated (n = 13 biological replicates (3 prior to infection; 2 for each time point thereafter)). A) Hematoxylin and eosin staining of microdialysis probe placement in the frontal cortex. B) Intraperitoneal injections of pentylenetetrazol (PTZ) to determine sensitivity of amino acid (A-V; arrows) detection. C, D) LC-MS analysis on microdialysis samples over the course of infection. One-way ANOVA: Glutamate (p = 0.0003), Arginine (p<0.0001), Proline (p = 0.0168), Serine (p = 0.04), and Tyrosine (p = 0.0149). A Dunnett’s post-test was performed for all timepoints against naïve concentrations and significance shown as asterisks. ‘ND’ indicates samples were below the limits of detection. Amino acids not listed did not change significantly. Essential amino acids are displayed in S2 Fig.
Fig 4
Fig 4. Ceftriaxone does not alter the immune response to Toxoplasma infection.
Treatment of infected mice with ceftriaxone was conducted for one or three weeks starting at 5 weeks post-infection and compared to naïve and untreated infected mice. A) Parasite burden was quantified by RT-PCR of forebrain DNA extracted at one week post treatment (6 weeks post infection) from infected (n = 4) and ceftriaxone (n = 5) treated animals (Student’s t-test: infected vs. ceftriaxone p = 0.2730) and at three weeks post treatment (8 weeks post infection)(Student’s t-test: infected (n = 5) vs. ceftriaxone (n = 4) p = 0.2902). B) Brain mononuclear cells (BMNC) were extracted following one week of treatment from infected (n = 4) and ceftriaxone (n = 5) treated brains and counted (Student’s t-test: infected vs. ceftriaxone p = 0.0826) and after 3 weeks of ceftriaxone treatment (Student’s t-test: infected (n = 5) vs. ceftriaxone (n = 4) p = 0.7794). C) Hematoxylin and eosin staining was performed on 3 week treated mice and images of the frontal cortex (10X) and blood vessels (25X) within the frontal cortex were taken. D) Flow cytometry of BMNC reveals the lymphocyte (CD45+CD11b-), macrophage (CD45+CD11bhi) and microglial (CD45intCD11bint) populations following 3 weeks of treatment with ceftriaxone. E) Quantification of the proportions of BMNC between infected (n = 5) and ceftriaxone (n = 4) treated mice for microglia (p = 0.7804), macrophages (p = 0.5013) and lymphocytes (p = 0.4164). F) Flow cytometry of BMNC for CD4 and CD8 (Student’s t-test: CD4 infected vs. ceftriaxone p = 0.2075; CD8 infected vs. ceftriaxone p = 0.4122). G) Immunohistochemistry for the microglial marker Iba-1 and the astrocytic marker GFAP was performed on 12μm frozen sections from the frontal cortex (scale bar: 80μm); inserts, high magnification images of cell morphology (scale bar: 5μm).
Fig 5
Fig 5. Ceftriaxone specifically rescues the glutamate transporter GLT-1.
Treatment of infected mice with ceftriaxone was conducted for one week starting at 5 weeks post-infection and compared to naïve and untreated infected mice. Western blot of whole forebrain lysates for A) GLT-1 and B) GS on naïve (n = 3), infected (n = 5) and ceftriaxone treated (GLT-1 n = 5; GS n = 7) animals (Student’s t-test: GLT-1 naive vs. infected: p = 0.0144; GLT-1 infected vs. ceftriaxone: p = 0.0172; GS naïve vs. infected: p = 0.0002; GS infected vs. ceftriaxone: ns). C) Immunohistochemistry for GLT-1 and GFAP on 12μm thick frontal cortex sections (scale bar: 80μm). D) Glutamate and glutamine concentrations in the extracellular space of naïve (n = 4), infected (n = 6) and ceftriaxone (n = 3) treated mice as measured by microdialysis and LCMS (Student’s t-test: naive vs. infected: p = 0.0003; infected vs. ceftriaxone: p = 0.0072).
Fig 6
Fig 6. Ceftriaxone is neuroprotective during infection with Toxoplasma.
Treatment of infected mice with ceftriaxone was conducted for one week starting at 5 weeks post-infection and compared to naïve and untreated infected mice. A minimum of 3 mice were used in each group and the experiments were repeated at least once. A) Immunohistochemistry for NeuN on 12μm thick frontal cortex frozen slices (scale bar: 80μm). Inserts: high magnification of NeuN immunohistochemistry (scale bar: 5μm) B) and C) DiI labeling of dendritic spines quantified in naïve, infected and ceftriaxone treated animals (Student’s t-test; infected vs ceftriaxone: p = 0.0004) (scale bars: 9μm).
Fig 7
Fig 7. Infection with Toxoplasma disrupts neuronal networks and changes behavior.
A)-D) Naïve (n = 13), 6 week infected (n = 11) and ceftriaxone treated (n = 11) mice were placed in the center of an elevated plus maze and recorded for 5 minutes. B) percentage, C) frequency of time spent in the open arm of the maze and D) velocity and total distance traveled was measured between naive and infected animals. E) EEG raw traces for naïve, 6 week infected and ceftriaxone treated animals (scale bar: 1sec; dots illustrate the peak of one full rhythmic cycle). F) Approximate entropies, Student’s t-test (naïve vs infected, p<0.0001; infected vs ceftriaxone, p = 0.0057; naïve vs ceftriaxone, p = 0.0138) G) EEG power density spectrum for naïve, 4, 5 and 6-week infected and ceftriaxone treated animals. A minimum of 3 animals were used for each group and the experiments repeated twice. Asterisks represented are Bonferonni’s multiple comparison test (infected vs naive) and (ceftriaxone vs infected) H) EEG percent power calculated from power density spectral analysis in G.

References

    1. Lafferty KD, Shaw JC. Comparing mechanisms of host manipulation across host and parasite taxa. J Exp Biol. 2013;216(Pt 1):56–66. Epub 2012年12月12日. 10.1242/jeb.073668 - DOI - PubMed
    1. Fagard R, Tan HV, Creuzet C, Pelloux H. References: Differential Development of Toxoplasma gondii in Neural Cells. Parasitology. 1999;15. - PubMed
    1. Honjo K, van Reekum R, Verhoeff NP. Alzheimer's disease and infection: do infectious agents contribute to progression of Alzheimer's disease? Alzheimers Dement. 2009;5(4):348–60. Epub 2009年06月30日. 10.1016/j.jalz.200812001 - DOI - PubMed
    1. Giraudon P, Bernard A. Chronic viral infections of the central nervous system: Aspects specific to multiple sclerosis. Rev Neurol (Paris). 2009;165(10):789–95. Epub 2009年08月07日. - PMC - PubMed
    1. Gazzinelli R, Xu Y, Hieny S, Cheever a, Sher a. Simultaneous depletion of CD4+ and CD8+ T lymphocytes is required to reactivate chronic infection with Toxoplasma gondii. Journal of immunology (Baltimore, Md: 1950). 1992;149:175–80. - PubMed

Publication types

MeSH terms

Substances

Cite

AltStyle によって変換されたページ (->オリジナル) /