This site needs JavaScript to work properly. Please enable it to take advantage of the complete set of features!
Skip to main page content
U.S. flag

An official website of the United States government

Dot gov

The .gov means it’s official.
Federal government websites often end in .gov or .mil. Before sharing sensitive information, make sure you’re on a federal government site.

Https

The site is secure.
The https:// ensures that you are connecting to the official website and that any information you provide is encrypted and transmitted securely.

NIH NLM Logo
Log in
Access keys NCBI Homepage MyNCBI Homepage Main Content Main Navigation
. 2016 May 2;213(5):809-25.
doi: 10.1084/jem.20151248. Epub 2016 Apr 25.

Immune activation of the host cell induces drug tolerance in Mycobacterium tuberculosis both in vitro and in vivo

Affiliations

Immune activation of the host cell induces drug tolerance in Mycobacterium tuberculosis both in vitro and in vivo

Yancheng Liu et al. J Exp Med. .

Abstract

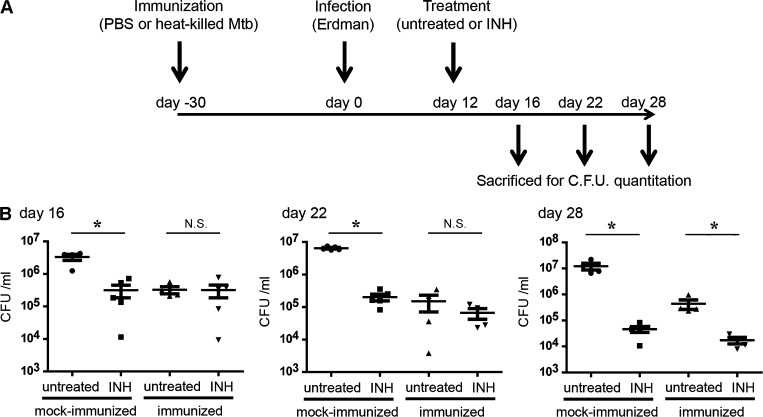
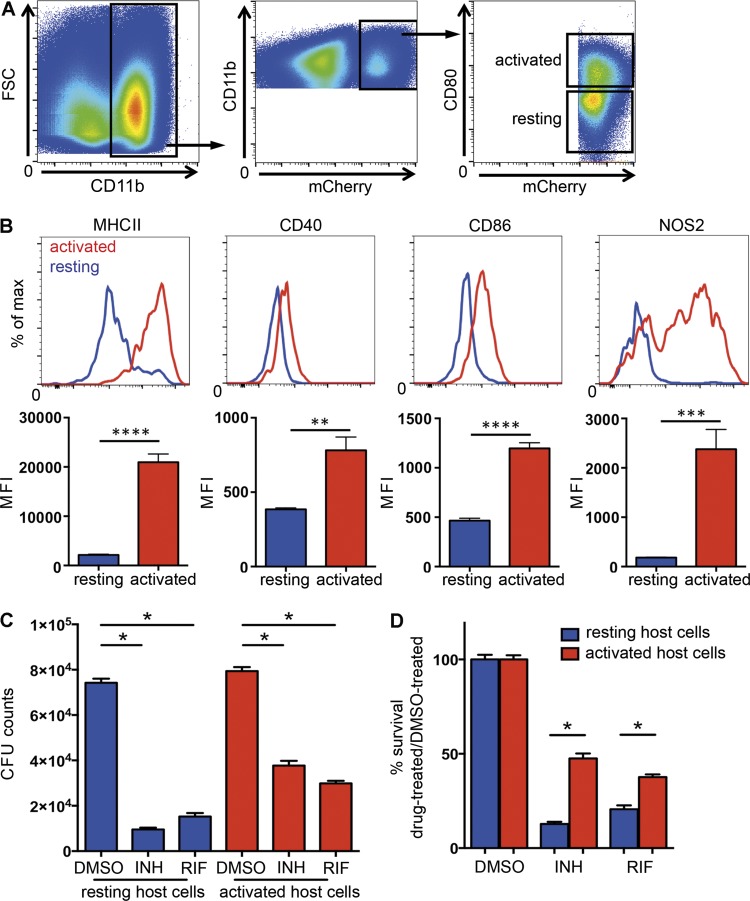
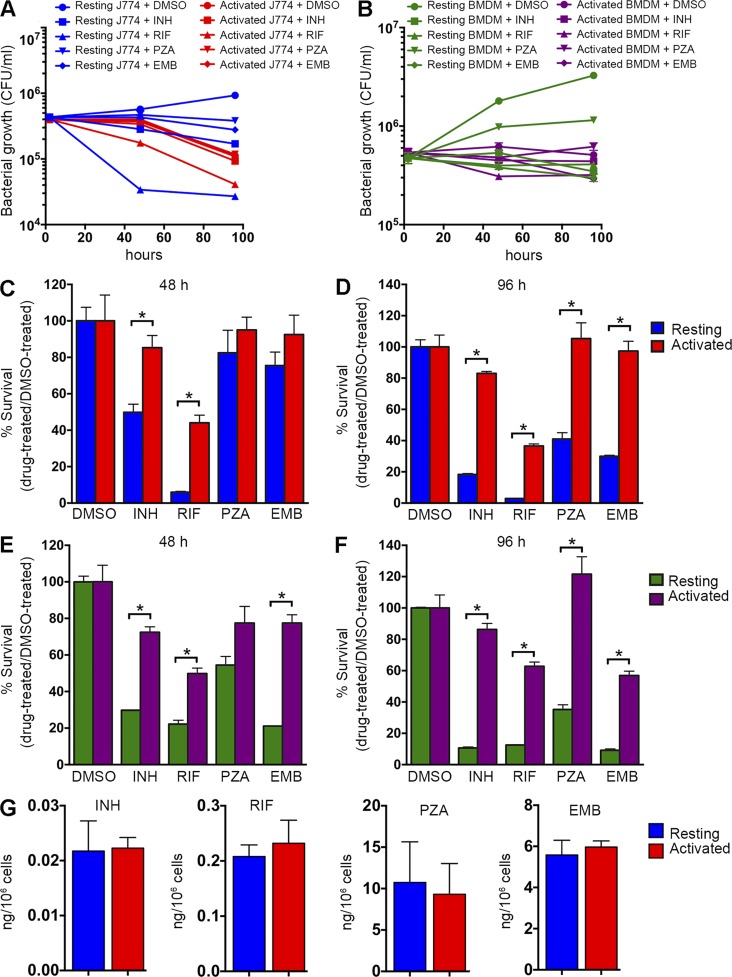
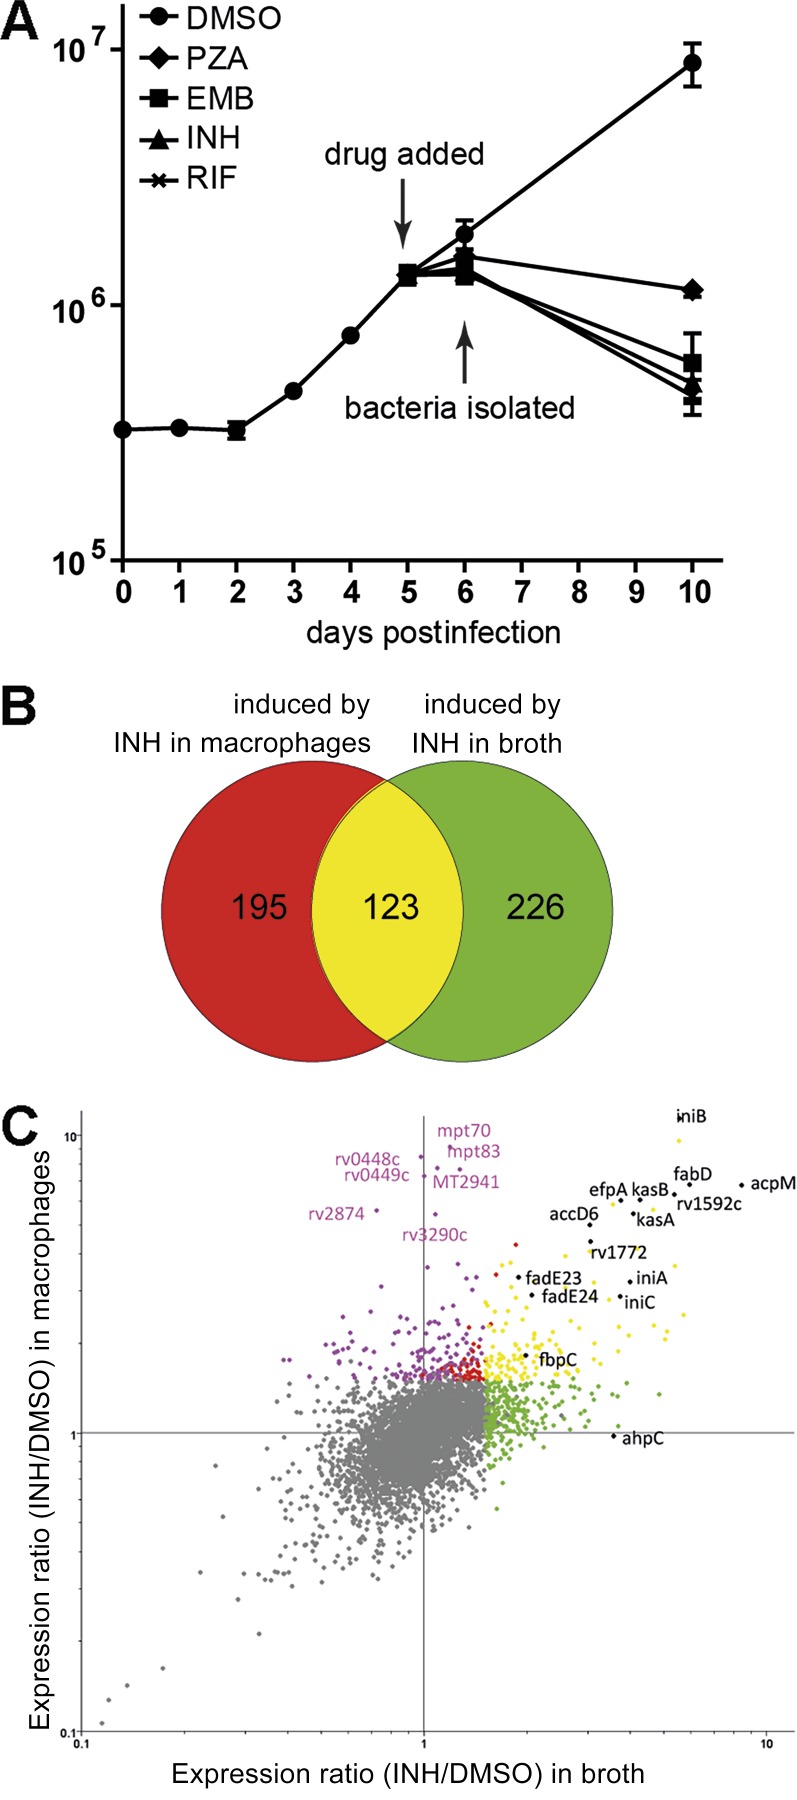
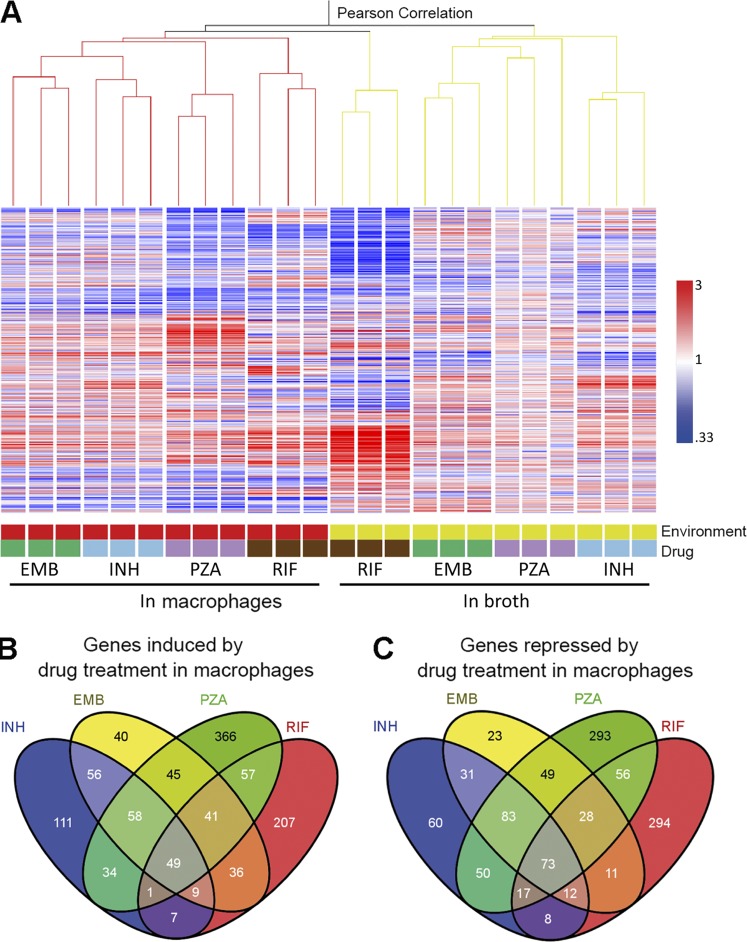
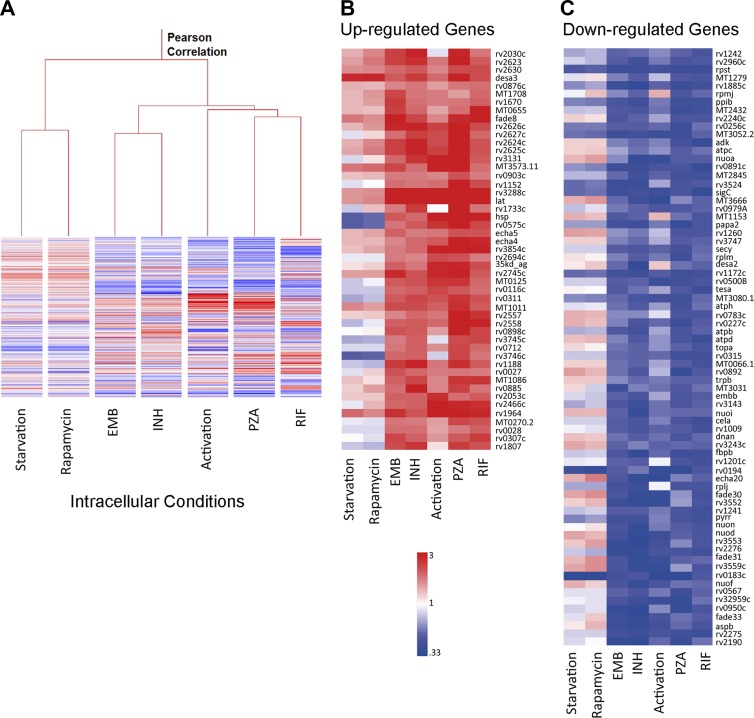
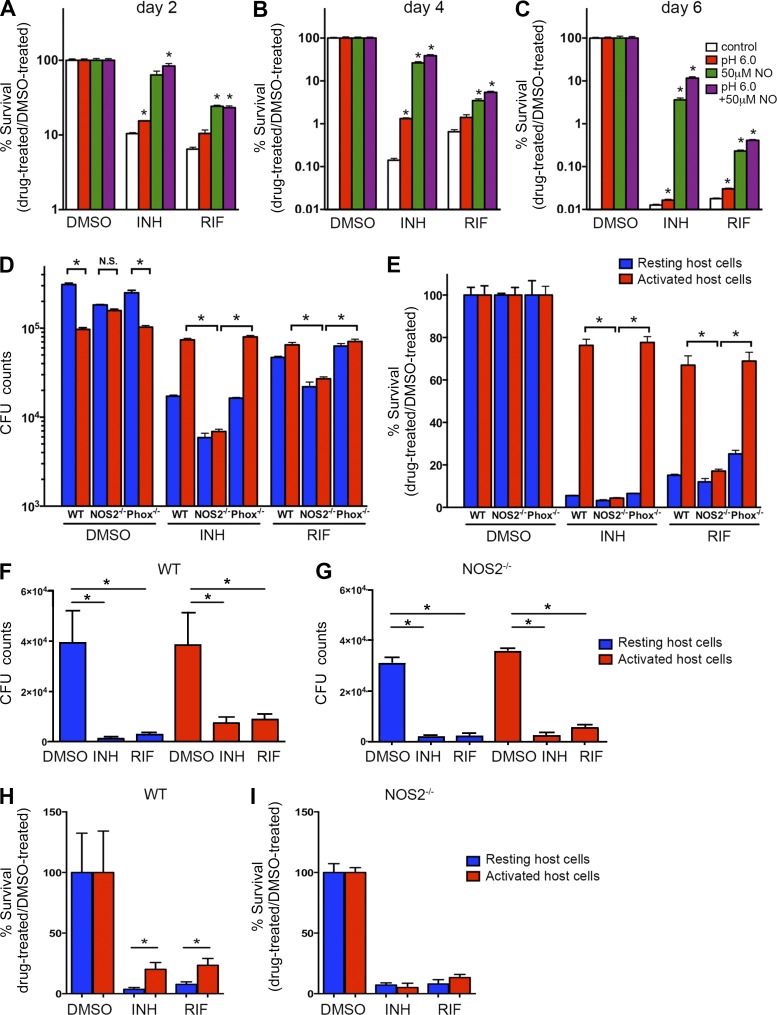
Successful chemotherapy against Mycobacterium tuberculosis (Mtb) must eradicate the bacterium within the context of its host cell. However, our understanding of the impact of this environment on antimycobacterial drug action remains incomplete. Intriguingly, we find that Mtb in myeloid cells isolated from the lungs of experimentally infected mice exhibit tolerance to both isoniazid and rifampin to a degree proportional to the activation status of the host cells. These data are confirmed by in vitro infections of resting versus activated macrophages where cytokine-mediated activation renders Mtb tolerant to four frontline drugs. Transcriptional analysis of intracellular Mtb exposed to drugs identified a set of genes common to all four drugs. The data imply a causal linkage between a loss of fitness caused by drug action and Mtb's sensitivity to host-derived stresses. Interestingly, the environmental context exerts a more dominant impact on Mtb gene expression than the pressure on the drugs' primary targets. Mtb's stress responses to drugs resemble those mobilized after cytokine activation of the host cell. Although host-derived stresses are antimicrobial in nature, they negatively affect drug efficacy. Together, our findings demonstrate that the macrophage environment dominates Mtb's response to drug pressure and suggest novel routes for future drug discovery programs.


Figures

Figure 1.
Figure 1.
In vivo mouse infection demonstrates that drug sensitivity of Mtb correlates inversely with the immune status of the host. (A) Immunization decreased bacterial burden but also reduced Mtb sensitivity to INH. C57BL/6J mice were injected with heat-killed Mtb (immunized) or PBS (mock immunized) and challenged by infection with Erdman Mtb. INH treatment was initiated 12 d p.i. and continued until 28 d. (B) At 16, 22, and 28 d p.i., mice were sacrificed and bacterial burden in the lungs was determined by CFU enumeration. *, P < 0.05 by the Mann-Whitney test. Each group contained five mice, and this experiment was repeated three times. Error bars represent SD, and horizontal lines represent the mean.
Figure 2.
Figure 2.
Flow sorting of activated and resting Mtb-infected host cells demonstrates that the drug sensitivity of Mtb recovered from in vivo infection correlates inversely with the immune status of the host phagocyte. Mtb recovered from activated host cells in vivo were more tolerant to both INH and RIF than those recovered from resting host cells. C57BL/6J mice were infected with mCherry-expressing Erdman Mtb for 21 d, and Mtb-containing myeloid cells with different immune activation status were isolated from lung tissue using flow cytometry. (A) CD11b+ mCherry+ CD80high cells (activated population) and CD11b+ mCherry+ CD80low cells (resting population) were sorted according to the depicted gating strategies. FSC, forward scatter. (B) Flow cytometry analysis of the expression levels of MHCII, CD40, CD86, and iNOS revealed the increased expression of classical activation markers in the CD11b+ mCherry+ CD80high cells (activated population) in comparison with the CD11b+ mCherry+ CD80low cells (resting population). (C and D) Isolated cells were established in culture and subjected to treatment with 1 μg/ml INH or RIF or an equivalent volume of DMSO. After 24 h of drug treatment, bacterial survival was determined by CFU enumeration (C), and the percentage of Mtb surviving drug treatment was quantified by normalizing the bacterial load in drug-treated samples against that in DMSO-treated samples (D). Data represent the mean ± SD of duplicates from an individual experiment representative of two independent experiments. MFI, mean fluorescence intensity. *, P < 0.05; **, P < 0.01; ***, P < 0.001; ****, P < 0.0001, by two-tailed Student’s t test.
Figure 3.
Figure 3.
The drug sensitivity of Mtb in macrophages is enhanced markedly upon the activation of the host cells in vitro. Mtb in host cells activated in vitro exhibited markedly higher levels of drug tolerance than in resting host cells. (A) Resting or activated J774A.1 macrophages were infected with Mtb at an MOI of 4. 2 h later, cells were washed to remove extracellular bacteria and then treated with 0.4 μg/ml INH, 0.4 μg/ml RIF, 200 μg/ml PZA, 12 μg/ml EMB, or an equal amount of DMSO. After 48 or 96 h of treatment, macrophages were lysed and the bacterial load was determined by CFU enumeration. (B) Resting or activated primary mouse BMDMs were infected with Mtb at an MOI of 4 and treated with identical drug regimens as in A. (C–F) The bacterial survival rates in J774A.1 macrophages (C and D) and BMDMs (E and F) after 48 or 96 h of drug treatment were quantified by normalizing bacterial load in drug-treated samples against that in DMSO-treated samples. Data represent the mean ± SD of triplicates from an individual experiment and are representative of three independent experiments. *, P < 0.05 by two-tailed Student’s t test. (G) Bar graph illustrating the relative drug concentration in resting and activated J774A.1 cells treated comparably to those cells detailed in A, C, and D. The data represent the mean ± SD of triplicates from an individual experiment representative of two independent experiments. There was no statistically significant difference in the drug concentrations found in resting or activated cells in each case.
Figure 4.
Figure 4.
The exposure of intracellular Mtb to INH induces an environment-specific transcriptional signature. (A) Growth curve of intracellular Mtb in the presence or absence of frontline antimycobacterial drugs. 0.2 μg/ml INH, 0.4 μg/ml RIF, 200 μg/ml PZA, 12 μg/ml EMB, or an equal volume of DMSO was used for the treatment. Error bars indicate SD from the mean. (B and C) Mtb exhibited an environment-specific transcriptional response to INH. (B) Venn diagram comparing Mtb genes up-regulated upon INH exposure in broth or during macrophage infection. Data represent the mean of eight biological replicates (treatment in macrophage) or six biological replicates (treatment in broth). Genes were identified as INH induced if they were up-regulated >1.5-fold relative to DMSO-treated samples (P < 0.05 by Student’s t test). (C) Scatter plot comparison of transcriptional profiles of Mtb treated with INH in broth (x axis) or in macrophages (y axis). Genes are colored according to the Venn diagram. Purple dots indicate genes whose induction is macrophage specific. Macrophage-specific genes were defined as genes that were only induced by INH treatment in macrophages by Venn diagram analysis with the induction ratio in macrophage versus in broth being significantly different (one-way ANOVA; Benjamini and Hochberg false discovery rate; P < 0.01). Three biological replicates were included for each treatment condition. Data points are from an individual experiment conducted in triplicate and are representative of three independent experiments. Black dots indicate INH-induced genes that have been reported previously (Wilson et al., 1999).
Figure 5.
Figure 5.
The exposure of intracellular Mtb to a panel of four frontline drugs induces a common transcriptional response. (A) Dominant role of the environment on Mtb’s transcriptional response to drug treatment. Condition tree analysis of Mtb transcriptional profiles in response to INH, RIF, PZA, or EMB treatment (concentrations as indicated for Fig. 4) during log phase growth in 7H9 broth or during infection of macrophages relative to DMSO-treated extracellular or intracellular Mtb. Three biological replicates were included for each treatment condition. Expression profiles were clustered using the Pearson correlation. (B and C) Shared transcriptional response across drug treatment conditions by intracellular Mtb. The four-way Venn diagrams compare genes induced or repressed by four drugs. Genes with a ≥1.5-fold change in regulation with a Student’s t test (P < 0.05) from a mean of at least three biological replicates were included for analysis.
Figure 6.
Figure 6.
Activation of the host phagocyte by cytokines induces a transcriptional stress response comparable to the response induced by exposure of intracellular Mtb to four frontline drugs. (A) Condition tree analysis of intracellular Mtb expression profiles in response to different drug exposure, macrophage activation, or autophagy induced by starvation or rapamycin. Host cell activation led to an intracellular Mtb transcriptional response similar to that observed on drug exposure during macrophage infection. Data represent the mean of at least two biological replicates for each macrophage condition or at least three biological replicates for drug-treated samples. (B and C) Heat maps showing the similarity between the expression profiles of genes commonly induced (B) or repressed (C) by exposure of Mtb to the four drugs versus during infection of macrophages activated by exposure to IFN-γ + LPS before infection.
Figure 7.
Figure 7.
NO is a major contributor to the induction of antibiotic tolerance in both in vitro and in vivo infection models. (A–C) Drug sensitivity of Mtb grown under acidic pH or NO stress conditions. Mtb was grown in regular 7H9 broth (control), acidified 7H9 broth (pH 6.0), 7H9 broth with 50-μM NO, and acidic 7H9 broth with NO (pH 6.0 + 50-μM NO) and exposed to 0.4 μg/ml INH, 0.4 μg/ml RIF, or an equal amount of DMSO. Bacterial survival rate was quantified after 2 (A), 4 (B), or 6 d (C) of treatment by CFU enumeration. *, P < 0.05 by two-tailed Student’s t test versus control. (D and E) Drug sensitivity of Mtb in BMDMs isolated from WT, NOS2−/−, or Phox−/− mice. Mtb survival was quantified after 96 h of drug treatment by normalizing the bacterial load in drug-treated samples against that in DMSO-treated samples. The data are shown as both CFU numbers (D) and as survival percentage relative to appropriate control conditions (E). Data represent the mean ± SD of triplicates from an individual experiment and are representative of two independent experiments. *, P < 0.05 by two-tailed Student’s t test. (F–I) C57BL/6J and NOS2−/− mice were infected with mCherry-expressing Erdman Mtb for 21 d, and Mtb-containing myeloid cells with different immune activation status were isolated from lung tissue using flow cytometry. Isolated cells were established in culture and subjected to treatment with 1 μg/ml INH or RIF or an equivalent volume of DMSO. After 24 h of drug treatment, bacterial survival was determined by CFU enumeration (F and G), and the percentage of Mtb surviving the drug treatment was quantified by normalizing the bacterial load in drug-treated samples against that in DMSO-treated samples (H and I). Data represent the mean ± SD and were pooled from two independent experiments.

References

    1. Abramovitch R.B., Rohde K.H., Hsu F.F., and Russell D.G.. 2011. aprABC: a Mycobacterium tuberculosis complex-specific locus that modulates pH-driven adaptation to the macrophage phagosome. Mol. Microbiol. 80:678–694. 10.1111/j.1365-2958.2011.07601.x - DOI - PMC - PubMed
    1. Adams K.N., Takaki K., Connolly L.E., Wiedenhoft H., Winglee K., Humbert O., Edelstein P.H., Cosma C.L., and Ramakrishnan L.. 2011. Drug tolerance in replicating mycobacteria mediated by a macrophage-induced efflux mechanism. Cell. 145:39–53. 10.1016/j.cell.2011年02月02日2 - DOI - PMC - PubMed
    1. Aldridge B.B., Keren I., and Fortune S.M.. 2014. The spectrum of drug susceptibility in Mycobacteria. Microbiol. Spectr. 2:MGM2-0031-2013 10.1128/microbiolspec.MGM2-0031 - DOI - PubMed
    1. Alland D., Kramnik I., Weisbrod T.R., Otsubo L., Cerny R., Miller L.P., Jacobs W.R. Jr., and Bloom B.R.. 1998. Identification of differentially expressed mRNA in prokaryotic organisms by customized amplification libraries (DECAL): the effect of isoniazid on gene expression in Mycobacterium tuberculosis. Proc. Natl. Acad. Sci. USA. 95:13227–13232. - PMC - PubMed
    1. Baek S.H., Li A.H., and Sassetti C.M.. 2011. Metabolic regulation of mycobacterial growth and antibiotic sensitivity. PLoS Biol. 9:e1001065 10.1371/journal.pbio.1001065 - DOI - PMC - PubMed

Publication types

MeSH terms

Cite

AltStyle によって変換されたページ (->オリジナル) /