This site needs JavaScript to work properly. Please enable it to take advantage of the complete set of features!
Skip to main page content
U.S. flag

An official website of the United States government

Dot gov

The .gov means it’s official.
Federal government websites often end in .gov or .mil. Before sharing sensitive information, make sure you’re on a federal government site.

Https

The site is secure.
The https:// ensures that you are connecting to the official website and that any information you provide is encrypted and transmitted securely.

NIH NLM Logo
Log in
Access keys NCBI Homepage MyNCBI Homepage Main Content Main Navigation
. 2016 Apr 19:7:11361.
doi: 10.1038/ncomms11361.

NETosis and lack of DNase activity are key factors in Echis carinatus venom-induced tissue destruction

Affiliations

NETosis and lack of DNase activity are key factors in Echis carinatus venom-induced tissue destruction

Gajanan D Katkar et al. Nat Commun. .

Abstract

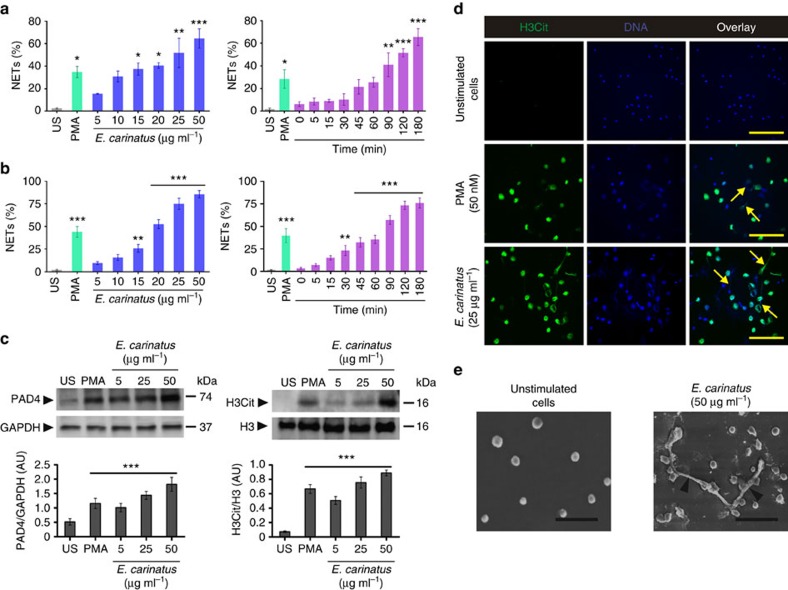
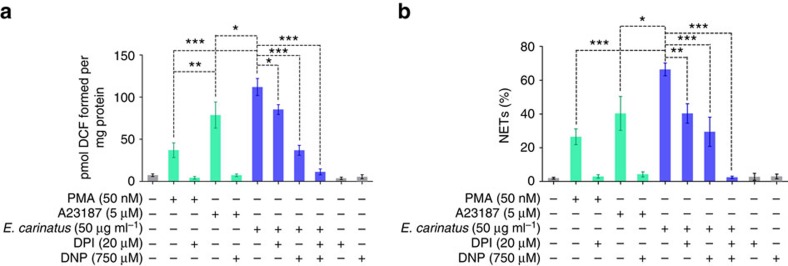
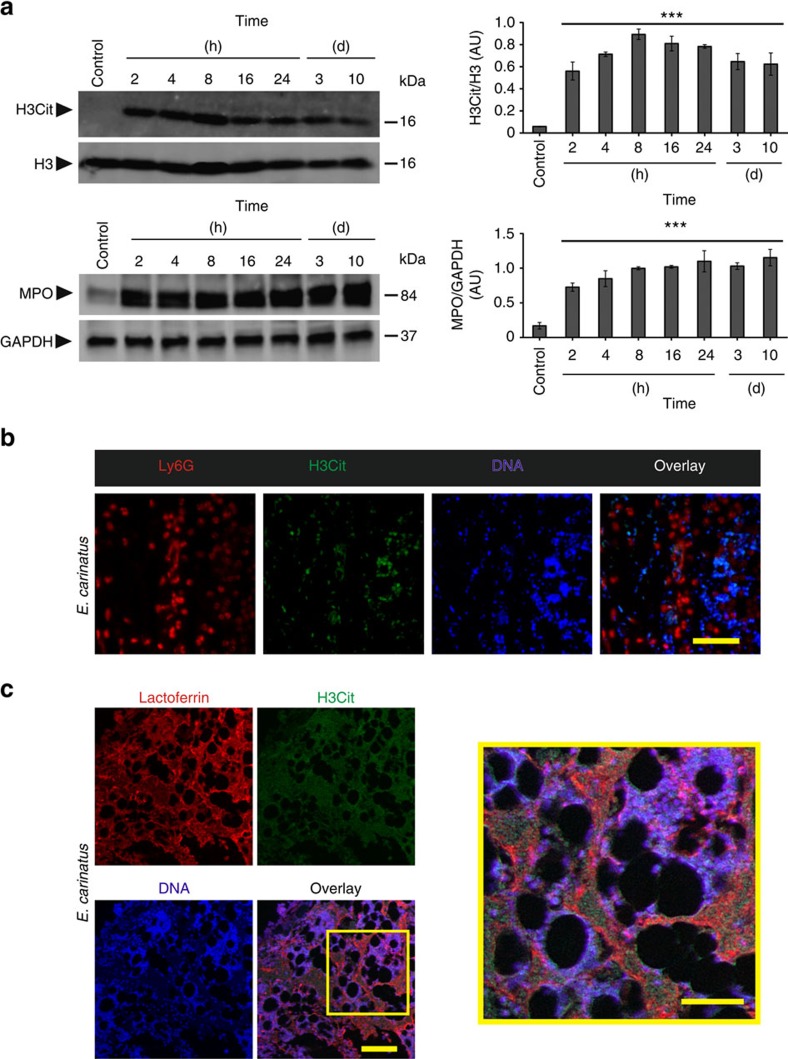
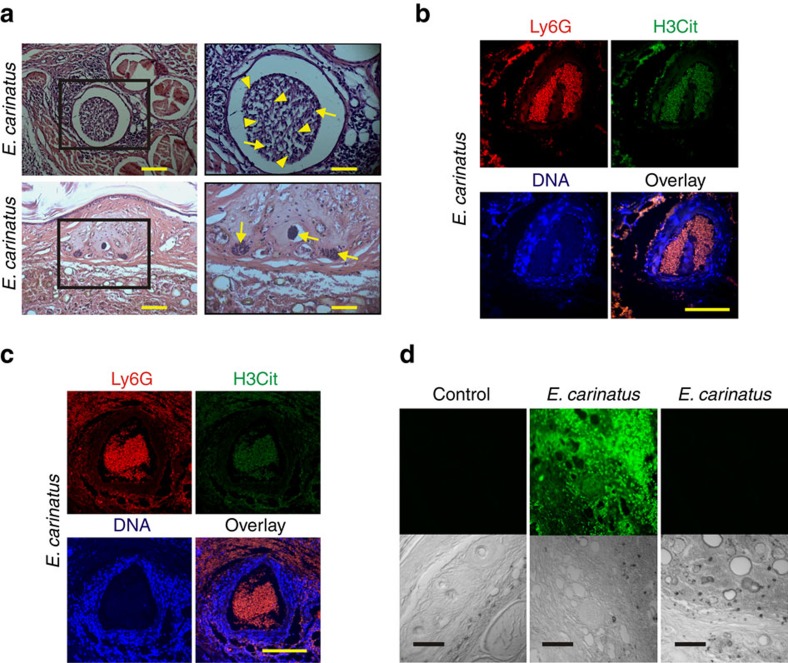
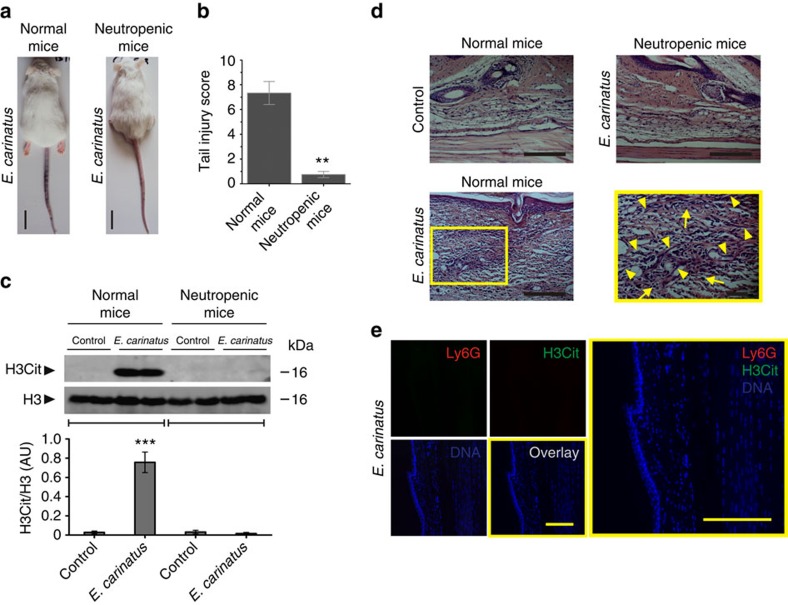
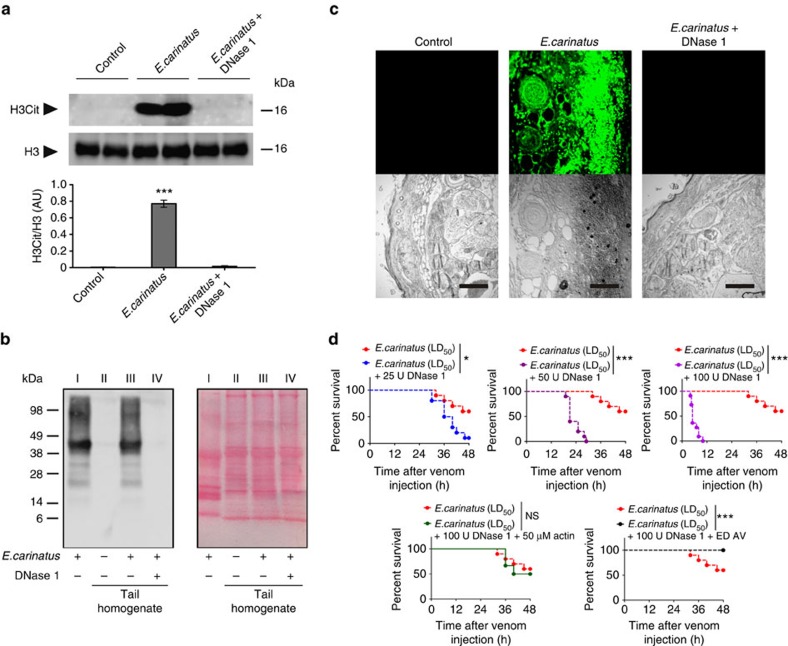
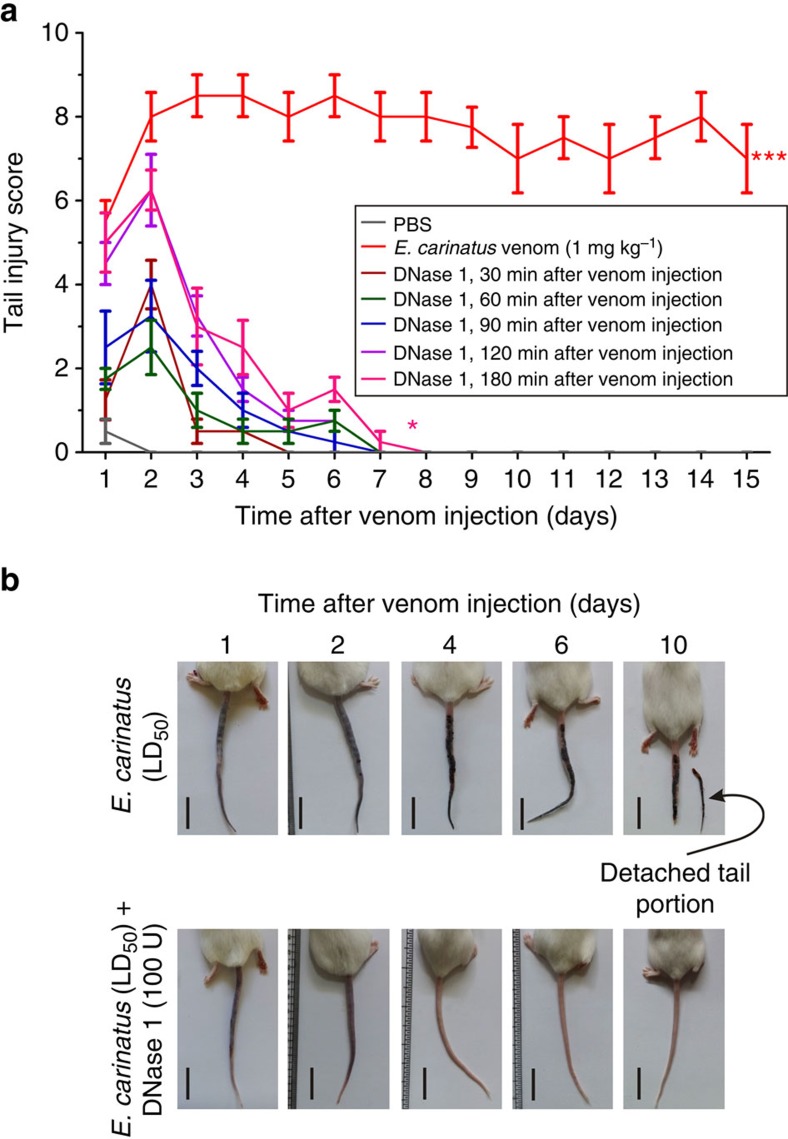
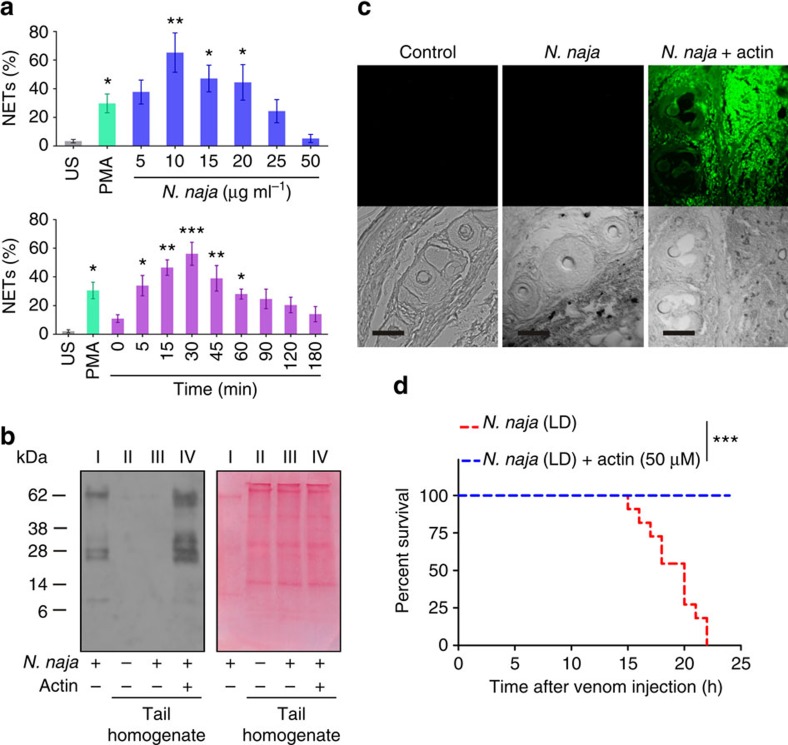
Indian Echis carinatus bite causes sustained tissue destruction at the bite site. Neutrophils, the major leukocytes in the early defence process, accumulate at the bite site. Here we show that E. carinatus venom induces neutrophil extracellular trap (NET) formation. The NETs block the blood vessels and entrap the venom toxins at the injection site, promoting tissue destruction. The stability of NETs is attributed to the lack of NETs-degrading DNase activity in E. carinatus venom. In a mouse tail model, mice co-injected with venom and DNase 1, and neutropenic mice injected with the venom, do not develop NETs, venom accumulation and tissue destruction at the injected site. Strikingly, venom-induced mice tail tissue destruction is also prevented by the subsequent injection of DNase 1. Thus, our study suggests that DNase 1 treatment may have a therapeutic potential for preventing the tissue destruction caused by snake venom.


Figures

Figure 1
Figure 1. E. carinatus venom stimulates ex vivo NETosis.
E. carinatus venom-stimulated NET formation was quantified using (a) MPO-DNA capture ELISA and (b) Hoechst staining in dose- (left) and time-dependent (right) assays. The results are expressed as the percent increase relative to unstimulated cells (US); mean±s.e.m. (n=6). *P<0.05, **P<0.01, ***P<0.001 versus US; one-way analysis of variance (ANOVA), followed by Dunnett's post-hoc test. PMA (50 nM) served as a positive control. (c) Western blot analysis of PAD4 expression (top, left) and the presence of H3Cit (top, right) in E. carinatus venom-treated neutrophils. PAD4 expression was normalized to GAPDH expression (bottom, left), and H3Cit levels were normalized to H3 levels (bottom, right). AU, arbitrary units; H3Cit, citrullinated histone 3; H3, histone 3; US, unstimulated cells. The data are presented as mean±s.e.m. (n=4). ***P<0.001 versus US; one-way ANOVA, followed by Dunnett's post-hoc test. PMA (50 nM) served as a positive control. The PVDF membranes were cut based on molecular weight of respective protein using protein molecular weight marker and then probed with respective antibodies. (d) Representative immunofluorescence images of neutrophils/NETs. The neutrophils were exposed to E. carinatus venom (25 μg ml−1) for 2.5 h at 37 °C. Yellow arrows indicate NETs. (n=4) Scale bars, 100 μm. PMA (50 nM) served as a positive control. (e) Scanning electron microscopy images showing unstimulated neutrophils (left) and E. carinatus venom-stimulated neutrophils, which displayed NETs with thick bundles of fibres (black arrowheads; right). (n=4) Scale bars, 30 μm.
Figure 2
Figure 2. E. carinatus venom-mediated NETosis is both NOX-dependent and NOX-independent.
(a) Represents the level of ROS in neutrophils incubated with PMA, A23187 or E. carinatus venom in the presence or absence of DPI (20 μM) or DNP (750 μM) or both DPI (20 μM), DNP (750 μM). The data are presented as mean±s.e.m. (n=4). *P<0.05, **P<0.01, ***P<0.001; one-way analysis of variance followed by Bonferroni post-hoc test. (b) Represents NET release measured using MPO-DNA capture ELISA in neutrophils incubated with PMA, A23187 or E. carinatus venom in the presence or absence of DPI (20 μM) or DNP (750 μM) or both DPI (20 μM) DNP (750 μM). The data are presented as mean±s.e.m. (n=4). *P<0.05, **P<0.01, ***P<0.001; one-way ANOVA, followed by Bonferroni post-hoc test.
Figure 3
Figure 3. E. carinatus venom stimulates in vivo NETosis.
(a) Representative western blot of the time course of H3Cit and MPO appearance in E. carinatus venom (LD50)-injected mouse tail tissue (left) and quantification of the H3Cit levels compared with the H3 levels (top, right) and MPO level compared to GAPDH (bottom, right). AU, arbitrary units; H3Cit, citrullinated histone 3; H3, histone 3; MPO, myeloperoxidase. The data are presented as mean±s.e.m; Student's t-test, ***P<0.001 versus control; n=4 for the control, 2, 4, 8 and 16 h samples; n=5 for 24 h, day 3 and day 10 samples. The PVDF membranes were cut based on molecular weight of respective protein using protein molecular weight marker and then probed with respective antibodies. (b) Representative immunofluorescence images of mouse tail tissue 8 h after E. carinatus venom (LD50) injection, focused beneath the epithelial layer. Scale bar, 100 μm (n=4). (c) Representative confocal image of E. carinatus venom (LD50)-injected mouse tail tissues focused beneath the epithelial layer. The area enclosed by the yellow box is magnified and shown on the right. Scale bars, 100 μm (left), 50 μm (right); n=3.
Figure 4
Figure 4. NETs block blood vessels, leading to accumulation of E. carinatus venom.
(a) Images of H&E-stained mouse tail tissue 8 h after E. carinatus venom (LD50) injection show clot formation in the mouse tail vein (top, left) and blocked blood capillaries (bottom, left). The respective enlarged images are shown on the right. Scale bars, 50 μm (left), 100 μm (right). Yellow arrowheads indicate NETs and yellow arrows indicate neutrophils. Immunofluorescence image of the mouse (n=4). (b) tail artery and (c) vein 8 h after E. carinatus venom (LD50) injection. Scale bars, 100 μm (n=4). (d) Immunofluorescence images show the accumulation of venom in E. carinatus venom (LD50)-injected mouse tail tissue section (top row, middle), section with a secondary antibody control (top row, right) and section of PBS-injected tail tissue, which served as a control (top, left). The corresponding differential interference contrast (DIC) images of the respective tissues are also shown (bottom row). Scale bars, 100 μm (n=4).
Figure 5
Figure 5. NETs capture E. carinatus venom toxins.
(a) Representative immunofluorescence image of neutrophils exposed to E. carinatus venom (50 μg ml−1) for 2.5 h; the venom was detected using rabbit polyclonal antibody against E. carinatus venom followed by an AlexaFluor 488-conjugated goat anti-rabbit antibody along with DNA stained by Hoechst stain (top row). The AlexaFluor 488-conjugated goat anti-rabbit secondary antibody control (bottom row). Yellow arrow heads indicate NETs. Scale bars, 100 μm (n=4). (b) The NET–venom complex was quantified using the DNA–venom capture ELISA assay. The results are expressed as a percent increase with respect to the unstimulated cells. The data are presented as mean±s.e.m. (n=4). *P<0.05, **P<0.01, ***P<0.001 versus the unstimulated cells; one-way analysis of variance, followed by Dunnett's post-hoc test. (c) Native PAGE (7.5%) showing the interaction between DNA and E. carinatus venom (left), as demonstrated by the dose-dependent retardation of the bands. Marker (lane I), 250 ng DNA (lane II), 250 ng DNA+5 μg E. carinatus venom (lane III), 250 ng DNA+25 μg E. carinatus venom (lane IV) and 250 ng DNA+50 μg E. carinatus venom (lane V). Recovery of DNA from the DNA–venom complex (right). Marker (lane I), 250 ng DNA+5 U DNase 1 (lane II), 250 ng DNA (lane III), 250 ng DNA+25 μg E. carinatus venom (lane IV) and recovered DNA from DNA+E. carinatus venom complex (lane V); n=3. (d) Kaplan–Meier survival curves show that the lethal potency of the E. carinatus venom is inhibited when it is incubated with DNA: E. carinatus venom, LD50 (red line, left) and LD (red line, right), and E. carinatus venom incubated with DNA for 10 min at 37 °C (blue line, both left and right); n=10. ***P<0.001. Log-rank test.
Figure 6
Figure 6. E. carinatus venom does not induce local tissue damage or NETosis in neutropenic mice.
(a) Representative photographs of mice 8 h after E. carinatus venom (LD50) injection in the tail show intense venom-induced wound in the tail of a normal mouse (left), but no haemorrhage in a neutropenic mouse (right). Scale bars, 2 cm. (n=10). (b) The corresponding tail injury score 8 h after the E. carinatus venom (LD50) injection is shown in a bar graph. The data are presented as mean±s.e.m. n=6 venom-injected normal mice; n=10 venom-injected neutropenic mice. **P<0.01; Student's t-test. (c) Western blot analysis of the appearance of H3Cit (top) in tail tissue homogenates taken from normal and neutropenic mice 8 h after E. carinatus venom (LD50) injection. The quantification of H3Cit levels compared with H3 levels is shown (bottom). AU, arbitrary units; H3Cit, citrullinated histone 3; H3, histone 3. The data are presented as mean±s.e.m. (n=4). ***P<0.001 versus the normal control mice; one-way analysis of variance, followed by Dunnett's post-hoc test. The PVDF membranes were cut based on molecular weight of respective protein using protein molecular weight marker and then probed with respective antibodies. (d) H&E-stained tail tissue sections from neutropenic (top right) and normal mice (bottom left) injected with E. carinatus venom (LD50); the yellow portion is enlarged and shown on the right. Tissue from PBS-injected normal mice is also shown (top, left). Scale bars, 100 μm. (n=4). (e) Representative immunofluorescence images of neutropenic mouse tail tissue 8 h after E. carinatus venom (LD50) injection, focused beneath the epithelial layer. Scale bars, 100 μm (n=4).
Figure 7
Figure 7. Co-injection with DNase 1 prevents E. carinatus venom-induced tissue destruction.
(a) Western blot analysis of the appearance of H3Cit (top) in tail tissue homogenates taken 8 h after E. carinatus venom (LD50) injection in the presence or absence of DNase 1. Quantification of H3Cit levels compared with H3 levels is shown (bottom). AU, arbitrary units; H3Cit, citrullinated histone 3; H3, histone 3. The data are presented as mean±s.e.m. (n=4). ***P<0.001 versus control mice; one-way analysis of variance, followed by Dunnett's post-hoc test. The PVDF membranes were cut based on molecular weight of respective protein using protein molecular weight marker and then probed with respective antibodies. (b) Western blot analysis (left) of the appearance of E. carinatus venom in tail tissue homogenates taken 8 h after venom (LD50) injection in the presence or absence of DNase 1. E. carinatus venom (20 μg) served as a positive control. The image of the corresponding Ponceau-stained PVDF membrane (right) shows E. carinatus venom, 20 μg (lane I), and equal protein loading of the tail tissue homogenates (lane II–IV); n=3. (c) Immunofluorescence images showing the accumulation of venom toxins from E. carinatus venom (LD50)-injected mouse tail tissues sections in the absence (top row, middle) or presence of DNase 1 (100 U; top row, right). PBS-injected tail tissue served as a control (top row, left). The corresponding DIC images of the respective tissues are also shown (bottom row). Scale bars, 100 μm (n=3). (d) All the experiments in this group were performed simultaneously but the data are divided into five graphs (top three and bottom two) for clarity. Kaplan–Meier survival curves: E. carinatus venom, LD50 (red line) in all the graphs; co-injection of E. carinatus venom (LD50) with 25 U DNase 1 (blue line), 50 U DNase 1 (green line), 100 U DNase 1 (violet line), 100 U DNase 1 pre-incubated with 50 μM actin (grey line) and 100 U DNase 1 followed by ED AV (black line). ED AV, effective dose of antivenom. (n=10). *P<0.05, ***P<0.001 and NS, non-significant between groups using the Log-rank test. See Supplementary Fig. 5 for the effect of DNase 1 on the lethal potency of E. carinatus venom (LD).
Figure 8
Figure 8. DNase 1 treatment prevents E. carinatus venom-induced tissue destruction in the challenge study.
(a) The graph represents the continued high injury score in E. carinatus venom (LD50)-injected mouse tails (red line), whereas the administration of 100 U DNase 1 at various times (30–180 min post-venom injection) decreased the tail injury score. The data are presented as mean±s.e.m. (n=10). *P<0.05, ***P<0.001 versus PBS injected control mice; one-way analysis of variance, followed by Dunnett's post-hoc test. (b) Representative photographs of mice taken on different days after injection. The mice were injected with E. carinatus venom (LD50; top row) or co-injected with E. carinatus venom (LD50) and DNase 1 (100 U; bottom row); the mice in the latter group recovered and normal tail morphology was restored on day 4 onwards (bottom, third). Scale bars, 2 cm (n=10).
Figure 9
Figure 9. DNase activity of N. naja venom is essential for degrading NETs and increasing its lethal potency.
(a) N. naja venom-stimulated NET formation was quantified using MPO-DNA capture ELISA in both dose- (top) and time-dependent (bottom) assays. US, unstimulated cells. The results are expressed as the percent increase relative to the US; mean±s.e.m. (n=6). *P<0.05, **P<0.01, ***P<0.001 versus the US; one-way analysis of variance, followed by Dunnett's post-hoc test. PMA (50 nM) served as a positive control. (b) Western blot analysis (left) of the appearance of N. naja venom in tail tissue homogenates taken 8 h after venom (LD) injection in the presence or absence of actin (50 μM). N. naja venom (20 μg) served as a positive control. The image of the corresponding Ponceau-stained PVDF membrane (right) shows N. naja venom, 20 μg (lane I) and equal protein loading of tail tissue homogenates (lane II–IV); n=3. (c) Representative immunofluorescence images were captured 8 h after N. naja venom (LD) injection in mouse tails and did not show an accumulation of venom (top row, middle), similar to the PBS-injected control tissue (left). However, N. naja venom accumulated when the venom (LD) was pre-treated with 50 μM actin before injection. The corresponding DIC images of respective tissues are shown (bottom). Scale bars, 100 μm (n=3). (d) Kaplan–Meier survival curves after injections of N. naja venom (LD, red line) or N. naja venom (LD) pre-incubated with 50 μM actin (blue line); n=10. ***P<0.001; Log-rank test.

References

    1. Warrell D. A. Snake bite. Lancet 375, 77–88 (2010). - PubMed
    1. Williams D. The global snake bite initiative: an antidote for snake bite. Lancet 375, 89–91 (2010). - PubMed
    1. WHO. Snakebites. Neglected Tropical Diseases Preprint at http://www.who.int/neglected_diseases/diseases/snakebites/en/ (2009).
    1. Girish K. S. & Kemparaju K. Overlooked issues of snakebite management: time for strategic approach. Curr. Top. Med. Chem. 11, 2494–2508 (2011). - PubMed
    1. Herrera C. et al.. Tissue localization and extracellular matrix degradation by PI, PII and PIII snake venom metalloproteinases: clues on the mechanisms of venom-induced hemorrhage. PLoS Negl. Trop. Dis. 9, 1–20 (2015). - PMC - PubMed

Publication types

MeSH terms

Cite

AltStyle によって変換されたページ (->オリジナル) /