This site needs JavaScript to work properly. Please enable it to take advantage of the complete set of features!
Skip to main page content
U.S. flag

An official website of the United States government

Dot gov

The .gov means it’s official.
Federal government websites often end in .gov or .mil. Before sharing sensitive information, make sure you’re on a federal government site.

Https

The site is secure.
The https:// ensures that you are connecting to the official website and that any information you provide is encrypted and transmitted securely.

NIH NLM Logo
Log in
Access keys NCBI Homepage MyNCBI Homepage Main Content Main Navigation
. 2016 May 15;196(10):4100-9.
doi: 10.4049/jimmunol.1502678. Epub 2016 Apr 13.

Regulatory IgDhi B Cells Suppress T Cell Function via IL-10 and PD-L1 during Progressive Visceral Leishmaniasis

Affiliations

Regulatory IgDhi B Cells Suppress T Cell Function via IL-10 and PD-L1 during Progressive Visceral Leishmaniasis

Robert G Schaut et al. J Immunol. .

Abstract

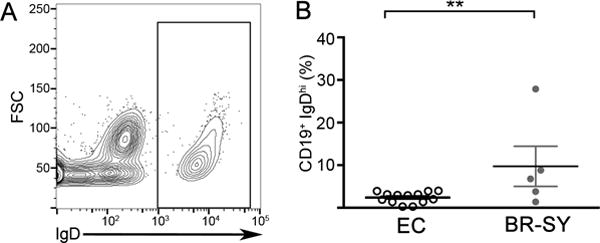
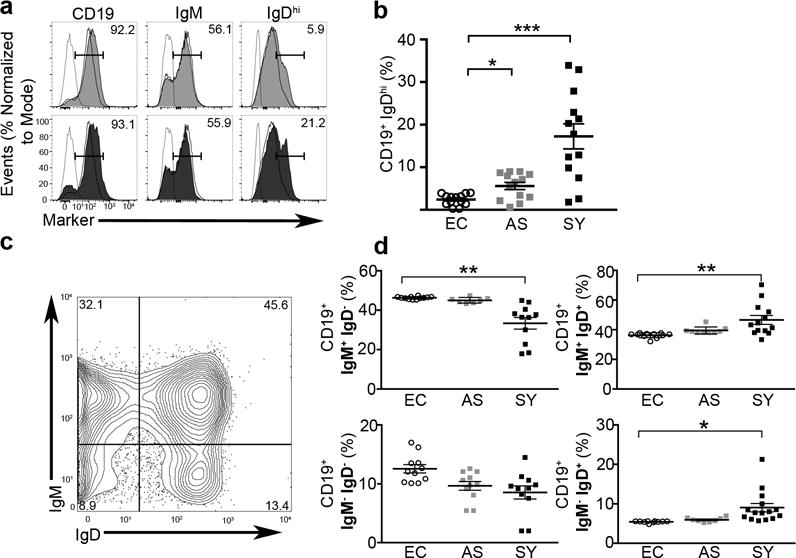
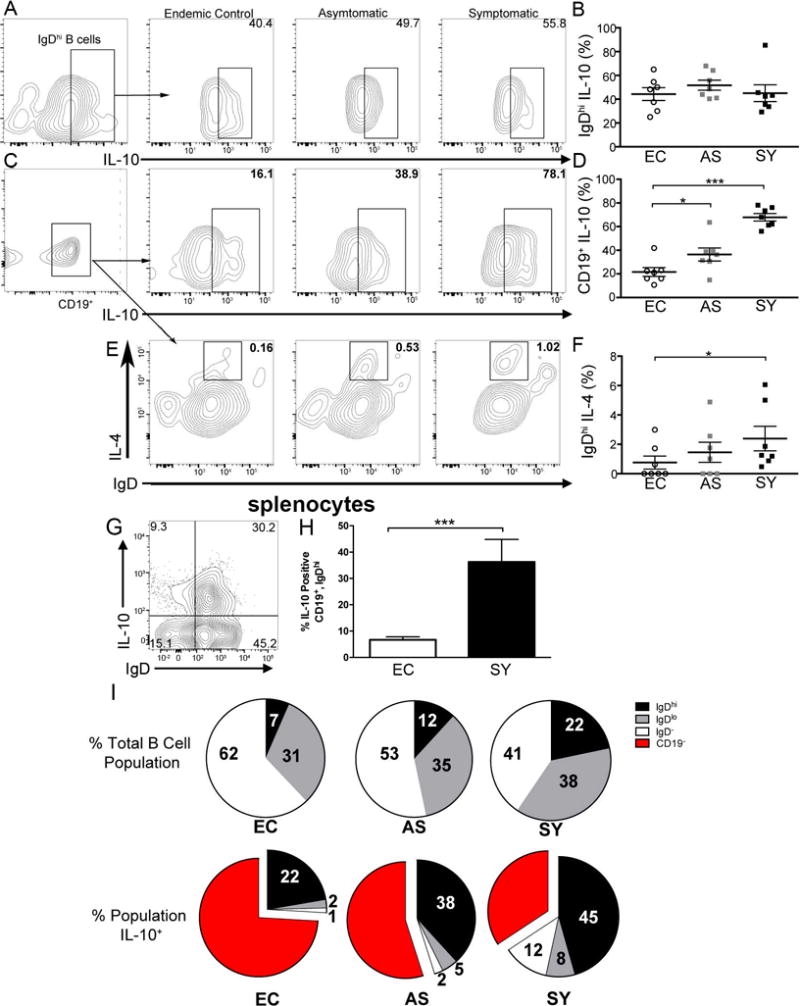
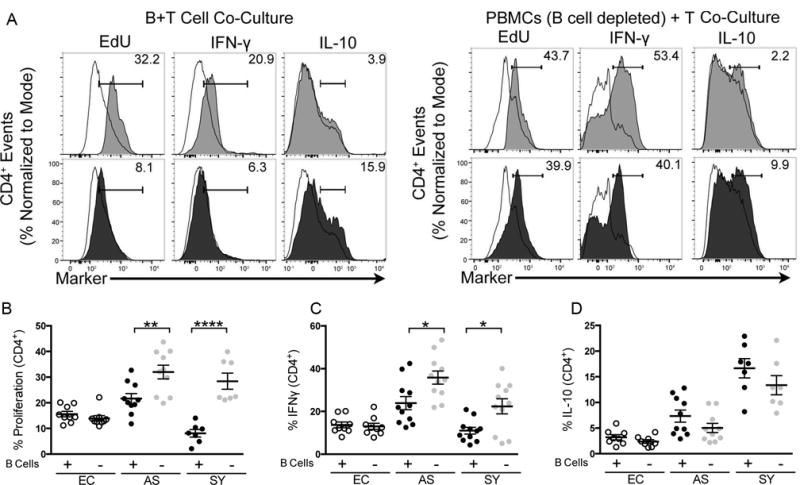
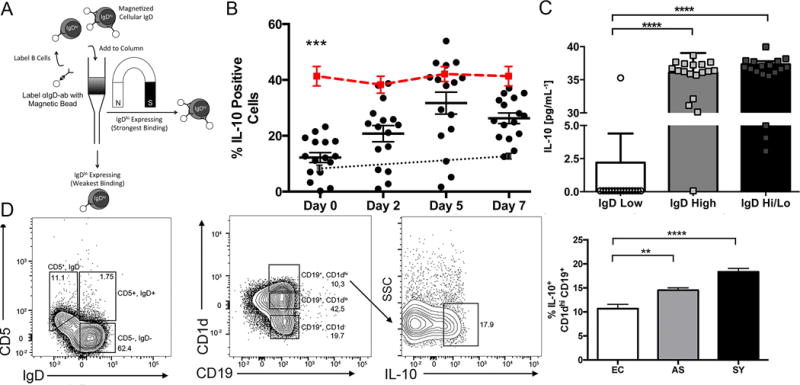
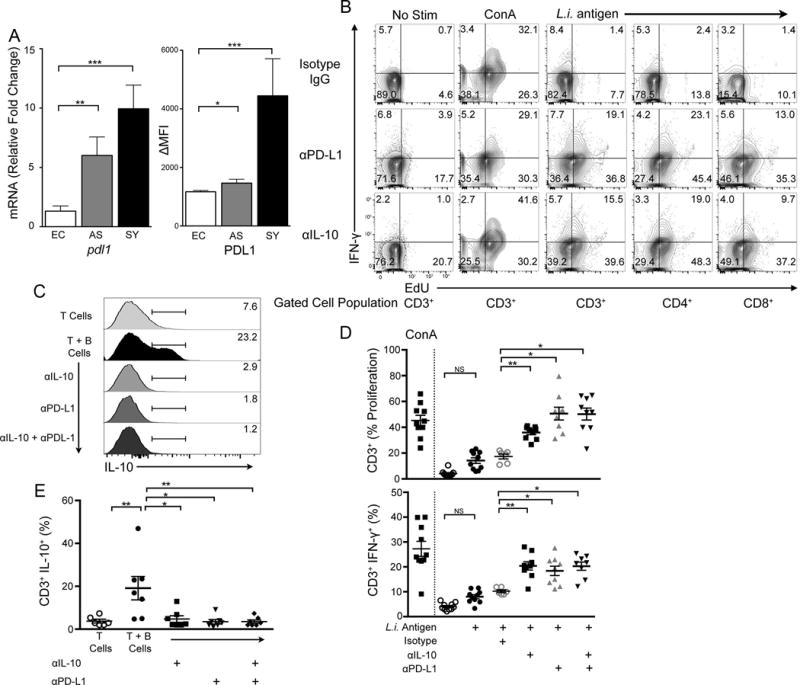
During visceral leishmaniasis (VL), Th1-based inflammation is induced to control intracellular parasites. Inflammation-based pathology was shown to be dampened by IL-10 and eventual programmed death 1-mediated T cell exhaustion. Cell type(s) responsible for the initiation of T cell-produced IL-10 during VL are unknown. CD19(+), CD5(-), CD1d(-), IgD(hi) regulatory B cells from healthy controls produced IL-10 in the absence of infection or stimulation, in contrast to IgD(lo/neg) B cells. IgD(hi) B cells may have a de novo versus induced regulatory program. The population of IgD(hi) B cells increased 3-fold as VL progressed. B cells from VL dogs were necessary and sufficient to suppress Th1 cell effector function. IgD(hi) B cells induced IL-10 production by T cells and IgD(lo) B cells. Blockage of B cell-specific PD-L1 restored Th1 responses. IgD(hi) regulatory B cells represent a novel regulatory B cell that may precipitate T cell exhaustion during VL.


Conflict of interest statement

Competing Financial Interests

The authors declare no competing financial interests.

Figures

Figure 1
Figure 1
L. infantum infected dogs from Brazil display high levels of immunoglobulin D on the surface of their B cells suggesting the occurrence of a naïve-like B cell during chronic VL. (A) Representative flow cytometry plot of IgD expression on CD19+ B cells isolated from clinically symptomatic, L. infantum infected Brazilian dogs. (B) Quantification of CD19+, IgDhi populations in individuals. Endemic controls (EC), or Brazilian symptomatic (BR-SY) dogs. N=5, 1 experiment. Significance determined via one-way ANOVA ±SEM **p<0.01,
Figure 2
Figure 2
Immunoglobulin IgD significantly increased on the surface of B cells during visceral leishmaniasis. (A) Histogram of isotype (dashed), endemic control (open-solid), asymptomatic (grey) or symptomatic (black) magnetically selected B cells. Percentages of CD19 (left), IgM (center) or IgDhi (right). Histograms representative of n=7 per group and 3 experiments. (B) Quantification of CD19+, IgDhi populations in individuals. Endemic controls (EC), asymptomatic (AS), symptomatic (SY) dogs. N=13 per group from 5 experiments, except SY-BR where N=5, 1 experiment. Significance determined via one-way ANOVA ±SEM **p<0.01, ***p<0.001. (C) Relative expression of IgD and IgM in healthy endemic control dog. Representative of n=7 and 3 experiments. (D) Relative surface expression of IgM and IgD positive peripheral blood B cell populations. N=12 per group from 3 experiments. Statistical significance determined via one-way ANOVA with multiple comparisons was used for statistical analysis. Bars represent ±SEM *p<0.05, **p<0.01.
Figure 3
Figure 3
All IgDhi B cells have significantly increased IL-10 production. (A) CD19+ B cells gated for IgDhi and IL-10 via flow cytometry. Left panel (a) represents IgDhi gating scheme of CD19+ cells. Following panels are representative of IgDhi intracellular IL-10 from progressive clinical groups. Representative of n=7 per group and 5 experiments. (B) Percentage of CD19+, IgDhi, IL-10 positive cells per clinical group as represented in A. EC= endemic controls, AS= asymptomatic, SY= symptomatic. (C) Total CD19+ B cells gated for intracellular IL-10 via flow cytometry. Left represents CD19+ gate and following panels show representative IL-10 production in CD19+ cells from progressive clinical groups. (D) Quantification of CD19+, IL-10 percent positive cells per clinical group. Representative of n=7 per group and 5 experiments. (E) CD19+ cells analyzed for IgD and intracellular IL-4 via flow cytometry. Representative of n=7 per group and 2 experiments. (F) Quantification of CD19+, IgDhi, IL-4 percent positive cells per clinical group. Graph is representative of n=7 per group and 2 experiments. (G) Representative plot of IgD, IL-10 expression of splenic B cells from VL symptomatic dogs. (H) Graphical representation of percentage of IgDhi B cells within the spleen of L. infantum-infected symptomatic dogs. (I) IgD distribution across all CD19+ cells in the three clinical groups (top) and intracellular IL-10 production in IgD and B cell groups. All bars (B,D,F) represent ± SEM. One-way ANOVA with multiple comparisons was used for all statistical analysis. *p<0.05, ***p<0.001.
Figure 4
Figure 4
B cells isolated from VL symptomatic dogs sufficient and necessary to suppress CD4+ T cell TH1 function. (A) CD4+ T cell proliferation, IFN-γ production or IL-10 production in response to freeze-thawed (FT) L. infantum antigen when co-cultured with B cells (left) or co-cultured with B cell negative- PBMCs (right panel set). Histogram of responses by endemic control (open-solid line), asymptomatic (grey) or symptomatic (black) VL ex vivo CD4+ T cells. Representative of n=7 per group. (B,C,D) Percent CD4+ T cell population containing (B) EdU (proliferation), (C) IFNγ, and (D) IL-10 after co-culture with B cells (+) ×ばつ105 cells/well] or co-cultured with B cell negative PBMCs ×ばつ105 cells/well]. Graphs representative of n=7 per group. Percentages are normalized to isotype control and values subtracted from endemic control baseline. Statistical analysis performed utilizing one way-ANOVA with multiple comparison of the means. *p<0.05, **p<0.01, ****p<0.0001. EC = endemic controls, AS = asymptomatic and SY = symptomatic groups. All B cell co-culture was performed at 1:1 B/T cell ratios. Error bars represent ±SEM.
Figure 5
Figure 5
IgDhi B cells induced IgDlo B cells to produce IL-10. (A) Schema of magnetic IgDhi/IgDlo B cell separation. (B) IL-10 production in IgDhi (red line), IgDlo (black dots) and IgDlo-MHCII, with IgDhi B cell depleted co-culture (grey dots with dotted line). B cells were selected using CD19+ positive selection magnetic beads followed by labeling with anti-human-IgD magnetic beads. MHCII cells were isolated via adherence from total CD19, cells. Dots represent results from individual dogs. (C) IL-10 secretion as measured by ELISA in IgDhi and co-cultured IgDhi/lo cells compared to only IgDlo cells after 7 days of culture. Dots represent results from individual asymptomatic VL dogs. Bars are ±SEM. N=18 per group. (D) CD5 vs. IgD expression, CD1d+ cells significantly increased IL-10 expression during progressive VL. ** p<0.01, *** p<0.001, **** p<0.0001 One-way ANOVA with multiple comparisons was used to for statistical analysis. Cells were incubated in a ratio of 10:1 (IgDlo:IgDhi) or (IgDlo:MHCII).
Figure 6
Figure 6
Inhibitory receptor PD-L1 and IL-10 drove B cell suppression of T cell function in ex vivo cells from VL symptomatic dogs. (A) mRNA expression of PDL1 via qPCR in B cells (left). MFI surface expression of PD-L1 on CD19+, IgDhi B cells (right) (B) Representative contour plots of IFN-γ vs. proliferation in non-stimulated, positive-control ConA or L. infantum antigen stimulated T cells after B cell co-culture. B cells treated with isotype IgG, anti-PD-L1 (αPD-L1), or anti-IL-10 (αIL-10) specific antibodies prior to incubation with indicated T cell populations. (C) Intracellular IL-10 expression in non-stimulated CD3+ T cells isolated from symptomatic VL group. Histograms represent intracellular IL-10 percent positive cells. (D) CD3+T cell responses to co-culture with anti-PDL1 or IL-10 antibody-treated B cells from symptomatic animals. Percentages normalized to isotype control. N=7 per group. (E) Population data of CD3+ T cells producing IL-10 from symptomatic dogs co-cultured with B cells. Percentages normalized to isotype control subtracted from endemic control. N=7 per group. One-way ANOVA with multiple comparisons ± SEM. p<0.05, **p<0.01, ***p<0.001.

References

    1. Kaye PM, Aebischer T. Visceral leishmaniasis: immunology and prospects for a vaccine. Clin Microbiol Infect. 2011;17:1462–1470. - PubMed
    1. Esch KJ, Juelsgaard R, Martinez PA, Jones DE, Petersen CA. Programmed death 1-mediated T cell exhaustion during visceral leishmaniasis impairs phagocyte function. Journal of immunology (Baltimore, Md.: 1950) 2013;191:5542–5550. - PMC - PubMed
    1. Boggiatto PM, Ramer-Tait AE, Metz K, Kramer EE, Gibson-Corley K, Mullin K, Hostetter JM, Gallup JM, Jones DE, Petersen CA. Immunologic indicators of clinical progression during canine Leishmania infantum infection. Clin Vaccine Immunol. 2010;17:267–273. - PMC - PubMed
    1. Hernandez-Ruiz J, Salaiza-Suazo N, Carrada G, Escoto S, Ruiz-Remigio A, Rosenstein Y, Zentella A, Becker I. CD8 cells of patients with diffuse cutaneous leishmaniasis display functional exhaustion: the latter is reversed, in vitro, by TLR2 agonists. PLoS Negl Trop Dis. 2010;4:e871. - PMC - PubMed
    1. Ortiz M, Mon C, Herrero JC, Oliet A, Rodriguez I, Ortega O, Gallar P, Hinostroza J, Cobo G, del Alamo M, Jimenez J, Torres R, Digiogia C, San Martin J, Vigil AI, Blanco J. Glomerulonephritis and cryoglobulinemia: first manifestation of visceral leishmaniasis. Clin Nephrol. 2015;83:370–377. - PubMed

MeSH terms

Cite

AltStyle によって変換されたページ (->オリジナル) /