This site needs JavaScript to work properly. Please enable it to take advantage of the complete set of features!
Skip to main page content
U.S. flag

An official website of the United States government

Dot gov

The .gov means it’s official.
Federal government websites often end in .gov or .mil. Before sharing sensitive information, make sure you’re on a federal government site.

Https

The site is secure.
The https:// ensures that you are connecting to the official website and that any information you provide is encrypted and transmitted securely.

NIH NLM Logo
Log in
Access keys NCBI Homepage MyNCBI Homepage Main Content Main Navigation
doi: 10.1038/srep21047.

Multiple functions of Na/K-ATPase in dopamine-induced salivation of the Blacklegged tick, Ixodes scapularis

Affiliations

Multiple functions of Na/K-ATPase in dopamine-induced salivation of the Blacklegged tick, Ixodes scapularis

Donghun Kim et al. Sci Rep. .

Abstract

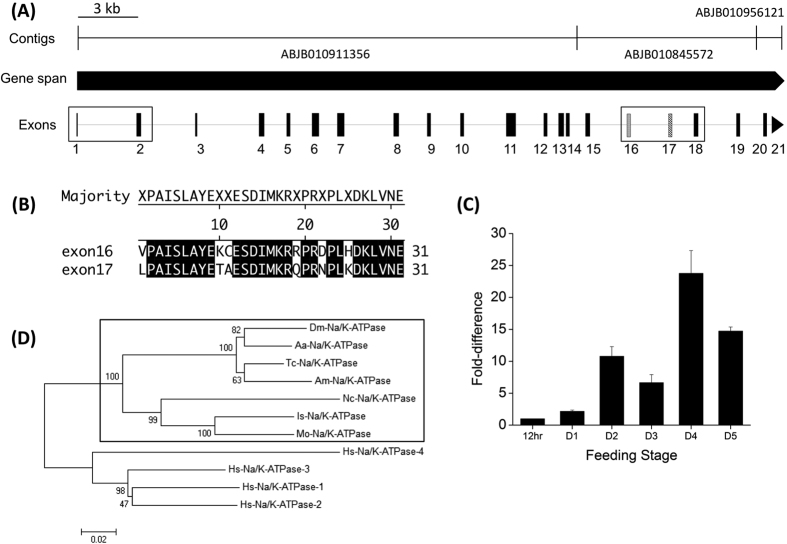
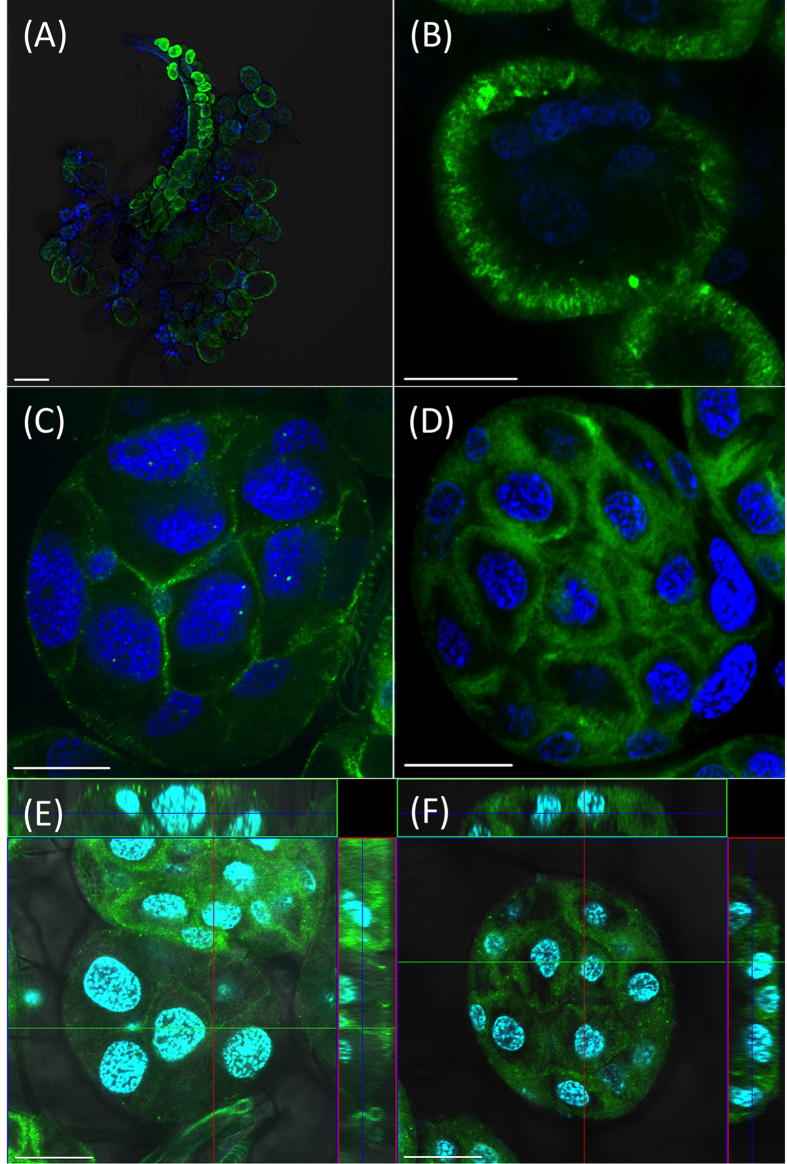
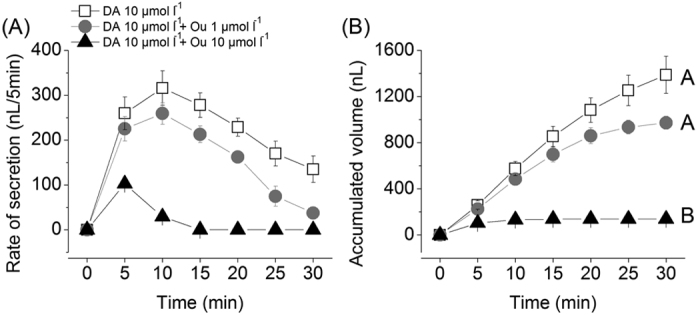
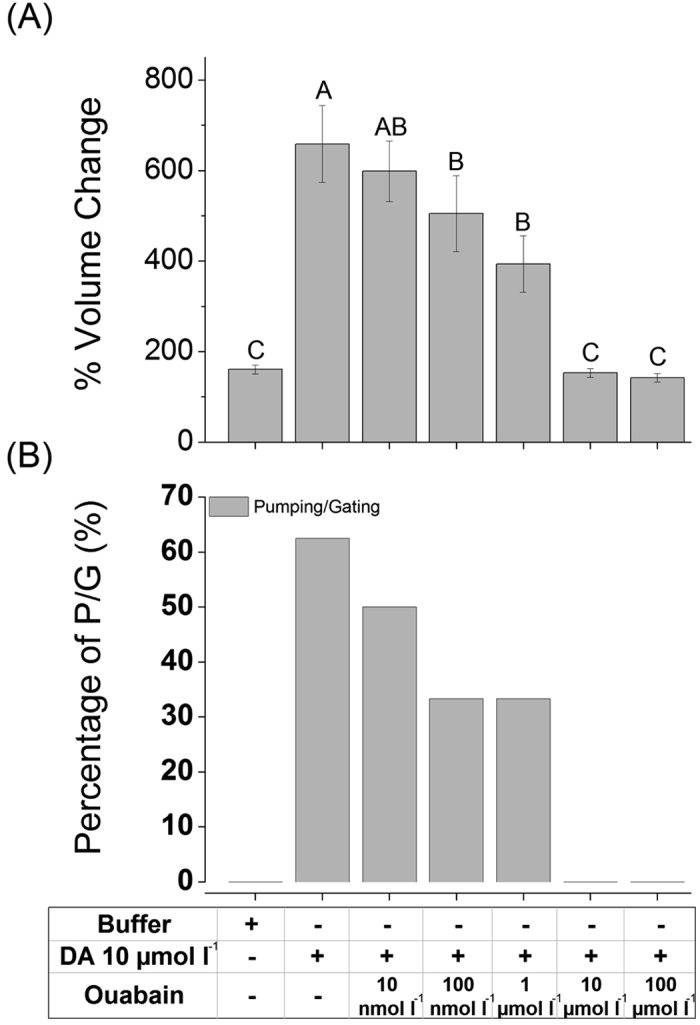
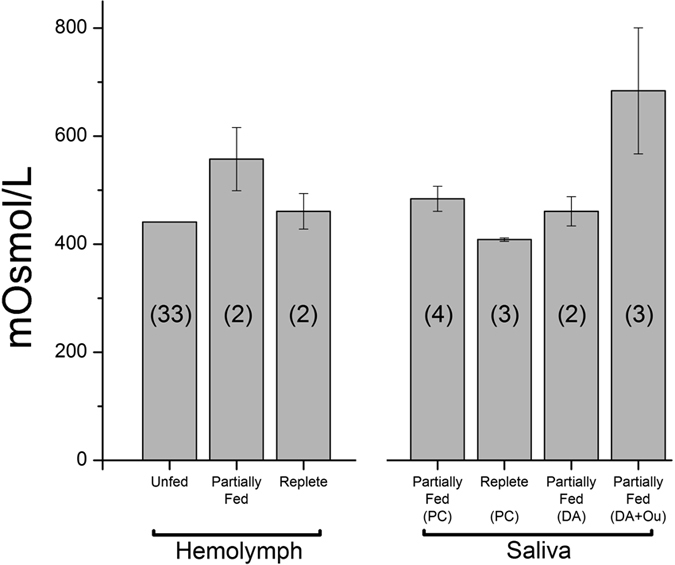
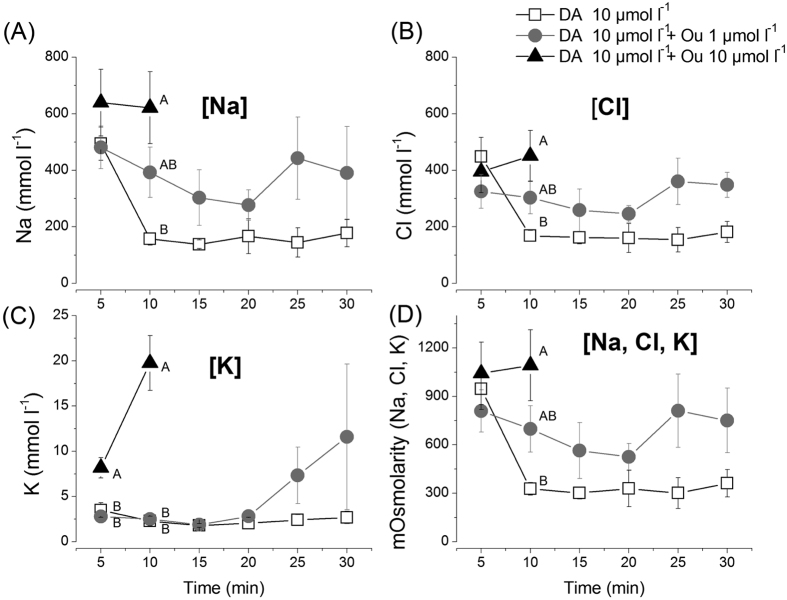
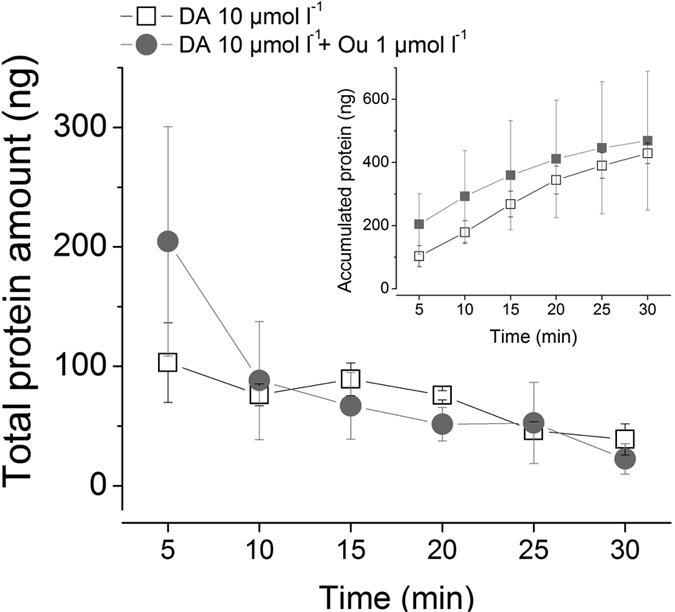
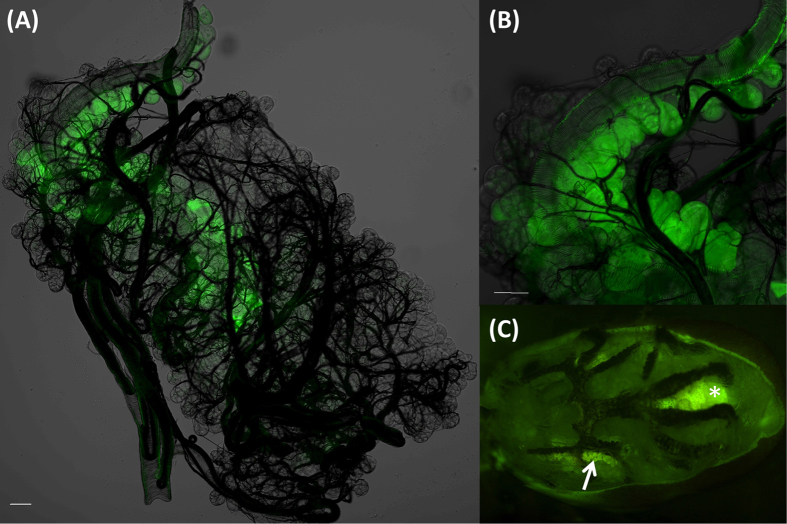
Control of salivary secretion in ticks involves autocrine dopamine activating two dopamine receptors: D1 and Invertebrate-specific D1-like dopamine receptors. In this study, we investigated Na/K-ATPase as an important component of the secretory process. Immunoreactivity for Na/K-ATPase revealed basal infolding of lamellate cells in type-I, abluminal interstitial (epithelial) cells in type-II, and labyrinth-like infolding structures opening towards the lumen in type-III acini. Ouabain (10 μmol l(-1)), a specific inhibitor of Na/K-ATPase, abolished dopamine-induced salivary secretion by suppressing fluid transport in type III acini. At 1 μmol l(-1), ouabain, the secreted saliva was hyperosmotic. This suggests that ouabain also inhibits an ion resorptive function of Na/K-ATPase in the type I acini. Dopamine/ouabain were not involved in activation of protein secretion, while dopamine-induced saliva contained constitutively basal level of protein. We hypothesize that the dopamine-dependent primary saliva formation, mediated by Na/K-ATPase in type III and type II acini, is followed by a dopamine-independent resorptive function of Na/K-ATPase in type I acini located in the proximal end of the salivary duct.


Figures

Figure 1
Figure 1. Gene structure, phylogeny, and expression profiles of I. scapularis Na/K-ATPase.
(A) Gene structure of Na/K-ATPase (ISCW002538) including 21 exons. The two boxes indicate corrected regions of the ISCW002538 as determined by manual annotation and experimental confirmation in the present study. The region of exon 1 and exon 2 (exon1 of ISCW002538) is in the first box. The two mutually alternative exons, exons 16 and 17 are in the second box. (B) Amino acid sequence alignment of exon16 and exon17. Black shades indicate identical amino acid residues. (C) Stage-specific expression profile of Na/K-ATPase, from 12 hrs to 5-days after the onset of feeding. (D) Phylogenetic relationship of Na/K-ATPase including I. scapularis Na/K-ATPase. The numbers at nodes represent percentage support from 1,000 bootstrap replicates. GenBank Accession numbers: Metaseiulus occidentali (XP_003737553.1), Neoseiulus cucumeris (AGQ56700.1), Drosophila melanogaster (AAF55825.3), Tribolium castaneum (XP_008196418.1), Apis mellifera (XP_006564225.1), Aedes aegypti (XP_001662217.1), and four genes of Homo sapiens (NP_000692.2, NP_000693.1, NP_689509.1, and NP_653300.2).
Figure 2
Figure 2. Na/K-ATPase immunoreactivity in three types of salivary gland acini from partially engorged female ticks.
(A) Overview of salivary glands at low magnification. (B) Type I acini. (C,E) Type II acini. (D,F) Type III acini. (E,F) Orthoview of type II and type III acini. Positive staining (green) was detected on the epithelial cells of all types of acini from the salivary glands. The blue color shows nuclei stained with DAPI. Scale bars are for 100 μm (A) and 20 μm (BF).
Figure 3
Figure 3. Secretory activities of isolated salivary glands induced by dopamine and ouabain treatments.
(A) The salivary secretion pattern observed over a 30-minute time period following treatments (B) Accumulated saliva volume over a 30-minute time period after treatments. The symbols indicate averages with standard error of the mean (s.e.m.) of three replicates. The data were analyzed by an ANOVA-Tukey-Kramer HSD test (p = 0.05). Different letters indicate significant differences.
Figure 4
Figure 4. Effect of ouabain on dopamine-mediated fluid influx in type III acini.
(A) Percentage increase in acinar volume after various combinatory treatments. (B) Percentage of acini observed for pumping/gating in each treatment. The data in A are the averages with standard error of mean (s.e.m.) for at least three biological replicates. The data in B are frequencies in observations of more than six acini for each data point. The data were analyzed by an ANOVA-Tukey-Kramer HSD test (p = 0.05). Different letters indicate significant differences.
Figure 5
Figure 5. Osmotic pressure of hemolymph and saliva secreted by pilocarpine or dopamine treated ticks.
Hemolymph was collected from three different feeding stages: unfed, partially-fed, and replete. Numbers in each bar indicate total number of utilized ticks. The data are the averages with standard error of mean (s.e.m.) for at least two biological replicates. For the collection of saliva, 2 μl of pilocarpine was injected into ticks (partially fed and replete ticks). Saliva collected from dopamine only and dopamine with ouabain were from isolated salivary glands in via the modified Ramsay’s assay. DA: dopamine (10 μmol l−1), Ou: ouabain (1 μmol l−1), and PC: pilocarpine (10 mg ml−1).
Figure 6
Figure 6. Ion composition and osmotic concentration of secreted saliva from isolated salivary glands.
(AC) The major three ions’ (Na+, Cl, K+) secretion patterns over a 30-minute time period following treatments. (D) The pattern of total osmotic concentration of three major ions (Na+, Cl, and K+) in the saliva secreted over a 30 minute time period. SEM/EDS was used to analyze each ion concentration from each time point. Standard curves for each ion (Na+, Cl, and K+) were generated with NaCl and KCl (see Supplementary Fig. S4). The symbols indicate averages with standard error of the mean (s.e.m.) of three replicates. The data were analyzed by an ANOVA-Tukey-Kramer HSD test (p = 0.05). Different letters indicate significant differences.
Figure 7
Figure 7. Protein quantification of secreted saliva.
Protein secretion over a 30-minute time period following treatments: dopamine (10 μmol l−1) alone (empty box) and dopamine (10 μmol l−1) with ouabain (1 μmol l−1) (grey circle). Inset graph, accumulated protein amounts over 30 minutes after treatments. The data are the averages with standard error of mean (s.e.m.) for at least three biological replicates. Values were plotted after conversion by applying value ratio between CBQCA analysis and TapeStation analysis.
Figure 8
Figure 8. Absorptive function of type I acini shown by absorption of Rhodamine 123.
Ticks were dissected to trace the fluorescence after the desiccated tick was offered a drop of water containing Rhodamine 123 (1 mmol l−1) for ~5 hr, (A) Intact salivary glands of unfed tick. (B) Magnified view of type I acini. (C) Overview of fluorescence from whole unfed tick body after the tergum was removed. Arrow in (C) indicates the salivary glands. Asterisk indicates hindgut and rectal sac that is autofluorescent (See Supplementary Fig. S6). Scale bars equal 50 μm.

References

    1. Kaufman W. R. Gluttony and sex in female ixodid ticks: How do they compare to other blood-sucking arthropods? J. Insect Physiol. 53, 264–273, doi: 10.1016/J.Jinsphys.200610004 (2007). - DOI - PubMed
    1. Coons L. B. & Roshdy M. A. Fine Structure of the Salivary Glands of Unfed Male Dermacentor variabilis (Say) (Ixodoidea: Ixodidae). J. Parasitol. 59, 900–912, doi: 10.2307/3278433 (1973). - DOI - PubMed
    1. Fawcett D. W., Doxsey S. & Büscher G. Salivary gland of the tick vector (R. appendiculatus) of East Coast fever. II. Cellular basis for fluid secretion in the type III acinus. Tissue Cell 13, 231–253, doi: 10.1016/0040-8166(81)90003-3 (1981). - DOI - PubMed
    1. Fawcett D. W., Doxsey S. & Büscher G. Salivary gland of the tick vector (R. appendiculatus) of East Coast fever. I. Ultrastructure of the type III acinus. Tissue Cell 13, 209–230, doi: 10.1016/0040-8166(81)90002-1 (1981). - DOI - PubMed
    1. Krolak J. M., Ownby C. L. & Sauer J. R. Alveolar structure of salivary glands of the lone star tick, Amblyomma americanum (L.): unfed females. J. Parasitol. 68, 61–82 (1982). - PubMed

Publication types

MeSH terms

Cite

AltStyle によって変換されたページ (->オリジナル) /