This site needs JavaScript to work properly. Please enable it to take advantage of the complete set of features!
Skip to main page content
U.S. flag

An official website of the United States government

Dot gov

The .gov means it’s official.
Federal government websites often end in .gov or .mil. Before sharing sensitive information, make sure you’re on a federal government site.

Https

The site is secure.
The https:// ensures that you are connecting to the official website and that any information you provide is encrypted and transmitted securely.

NIH NLM Logo
Log in
Access keys NCBI Homepage MyNCBI Homepage Main Content Main Navigation
. 2015;11(12):2309-22.
doi: 10.1080/15548627.2015.1117734.

Epigenetic regulation of autophagy by the methyltransferase EZH2 through an MTOR-dependent pathway

Affiliations

Epigenetic regulation of autophagy by the methyltransferase EZH2 through an MTOR-dependent pathway

Fu-Zheng Wei et al. Autophagy. 2015.

Abstract

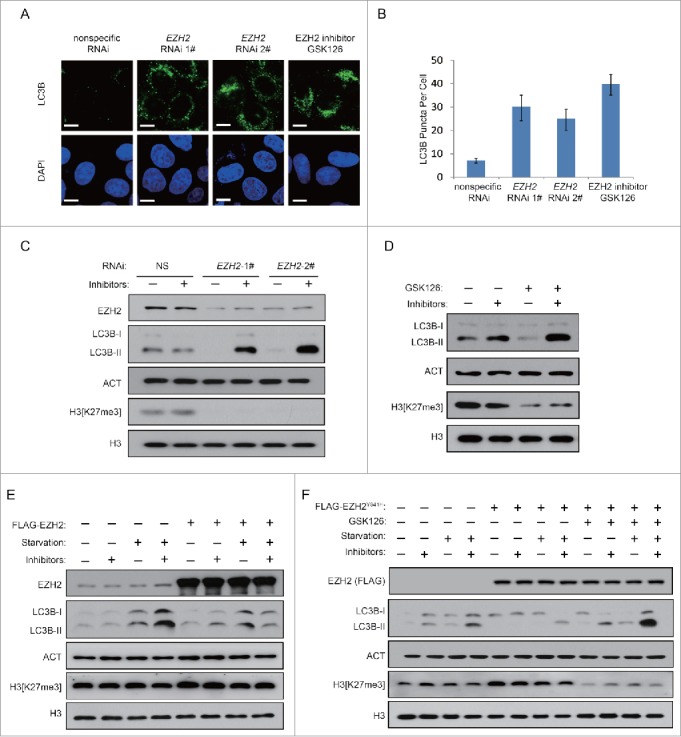
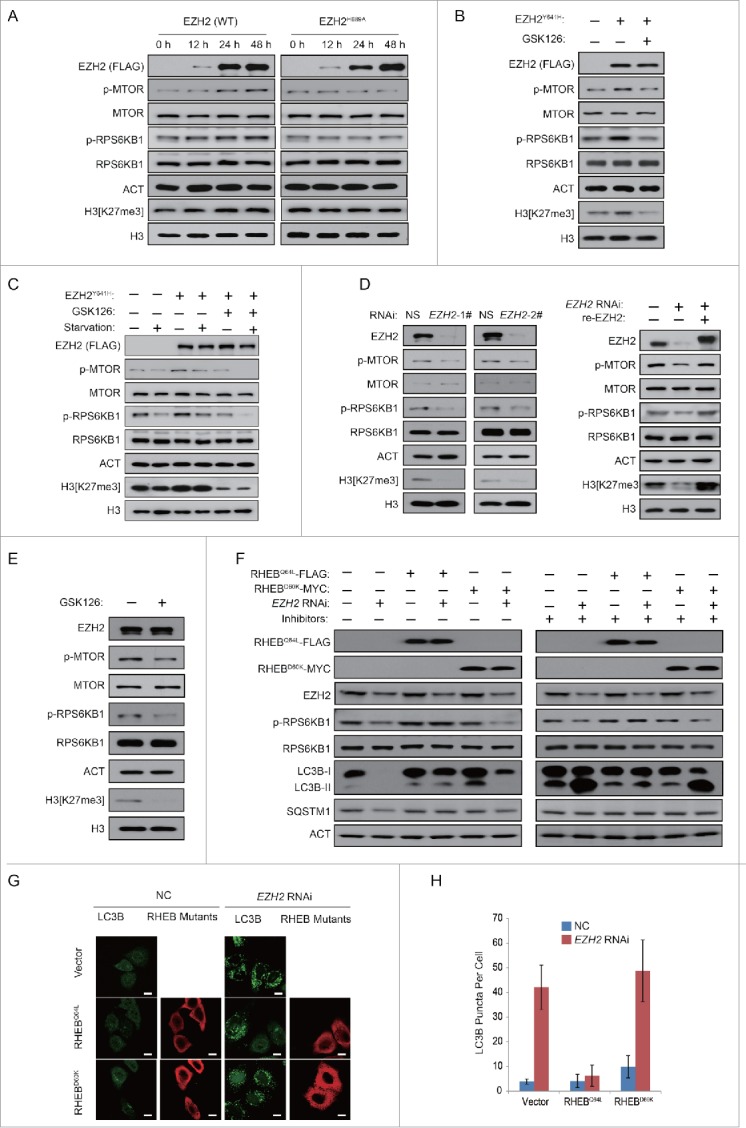
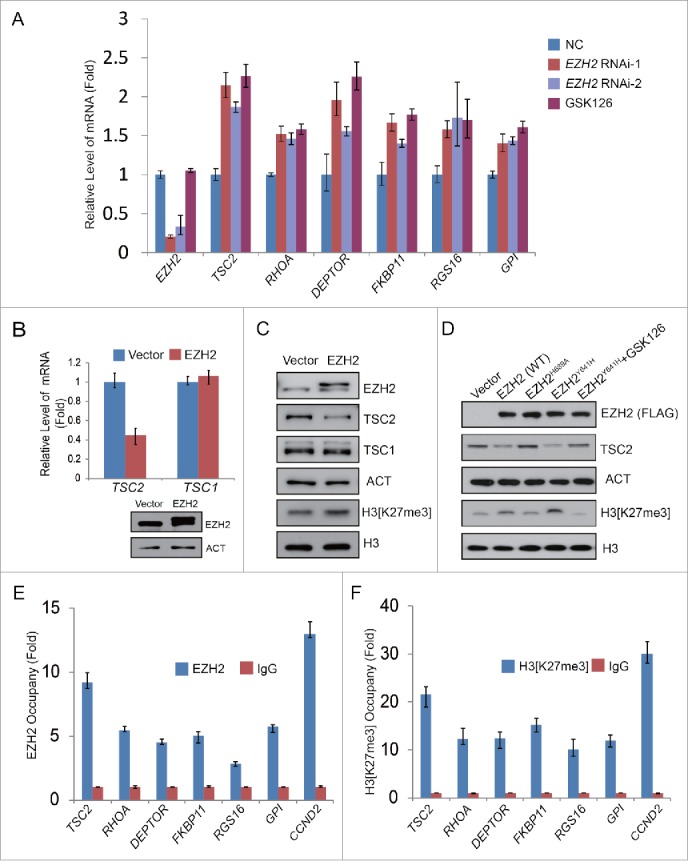
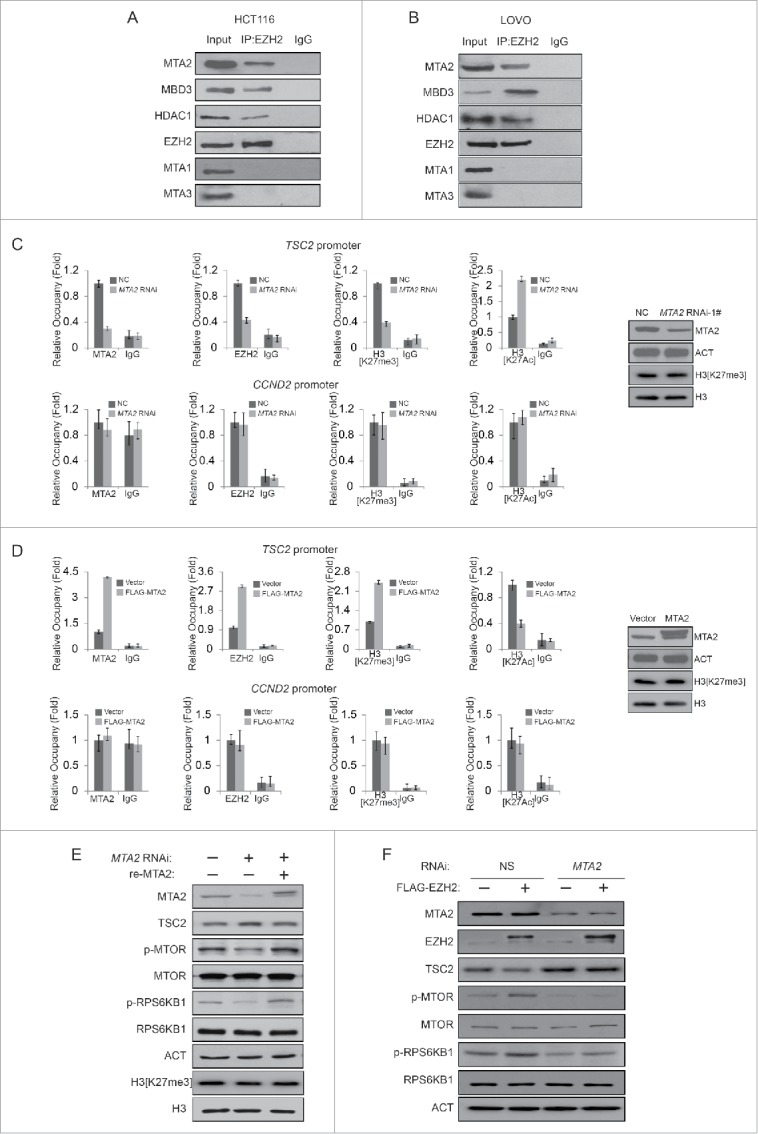
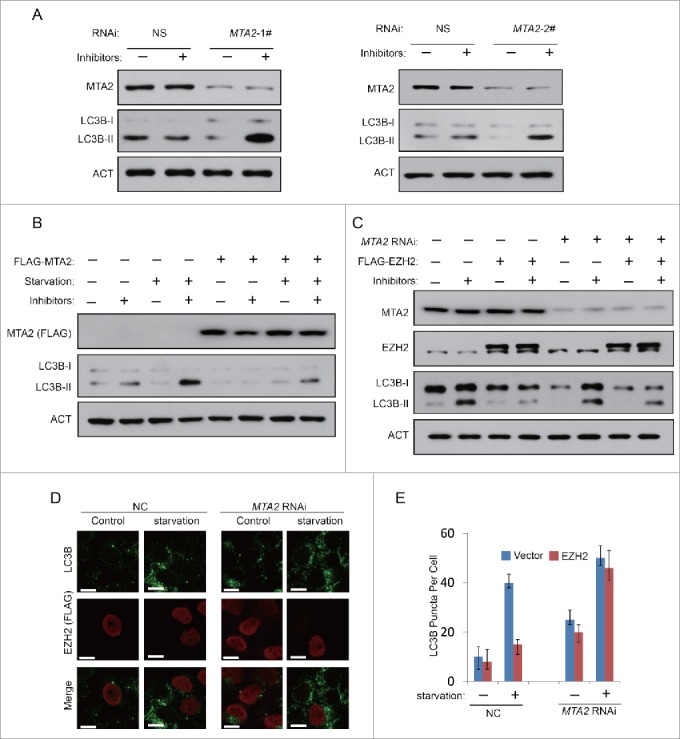
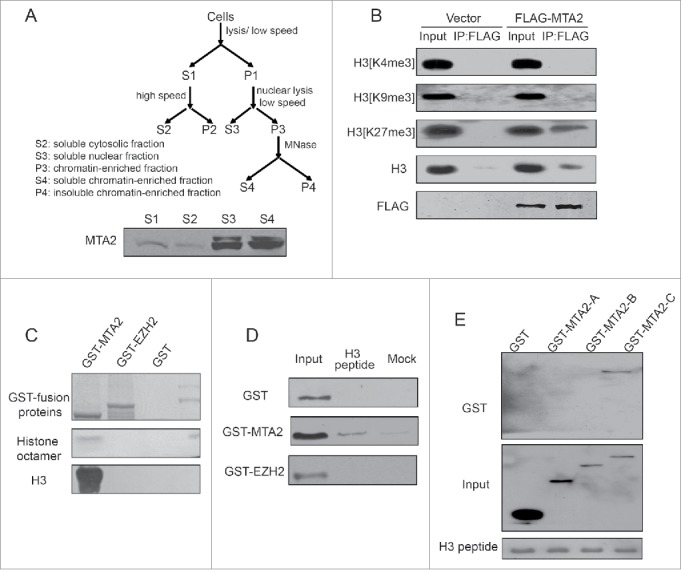
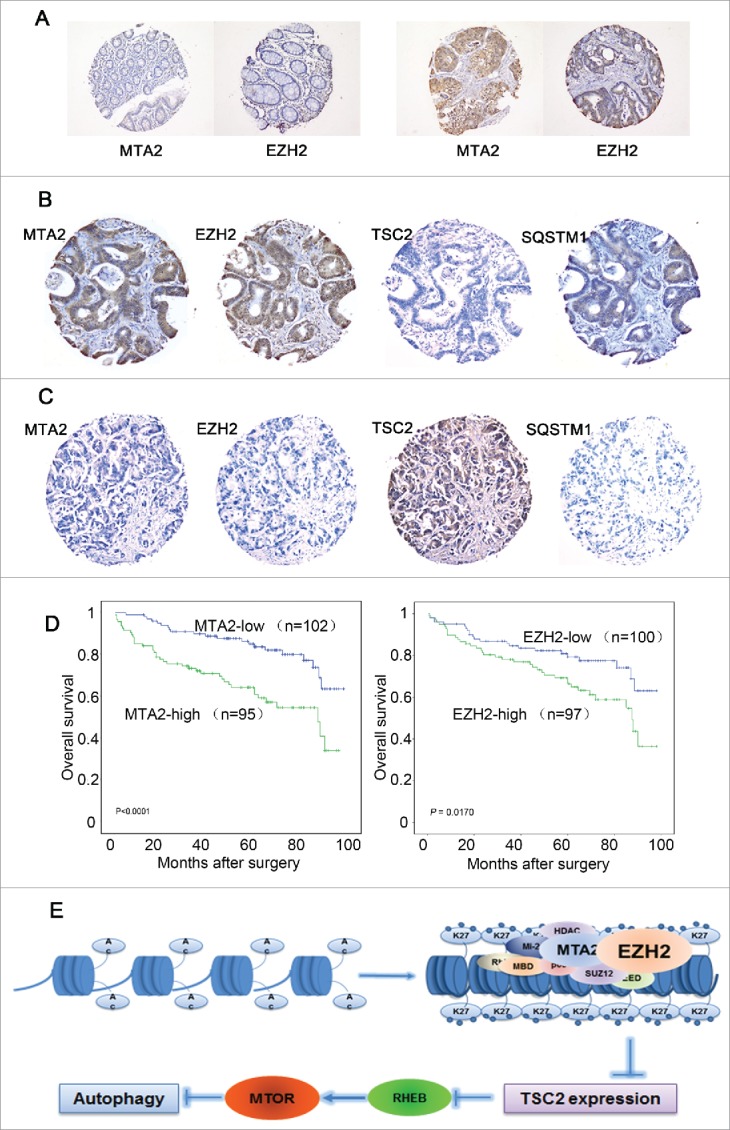
Macroautophagy is an evolutionarily conserved cellular process involved in the clearance of proteins and organelles. Although the autophagy regulation machinery has been widely studied, the key epigenetic control of autophagy process still remains unknown. Here we report that the methyltransferase EZH2 (enhancer of zeste 2 polycomb repressive complex 2 subunit) epigenetically represses several negative regulators of the MTOR (mechanistic target of rapamycin [serine/threonine kinase]) pathway, such as TSC2, RHOA, DEPTOR, FKBP11, RGS16 and GPI. EZH2 was recruited to these genes promoters via MTA2 (metastasis associated 1 family, member 2), a component of the nucleosome remodeling and histone deacetylase (NuRD) complex. MTA2 was identified as a new chromatin binding protein whose association with chromatin facilitated the subsequent recruitment of EZH2 to silenced targeted genes, especially TSC2. Downregulation of TSC2 (tuberous sclerosis 2) by EZH2 elicited MTOR activation, which in turn modulated subsequent MTOR pathway-related events, including inhibition of autophagy. In human colorectal carcinoma (CRC) tissues, the expression of MTA2 and EZH2 correlated negatively with expression of TSC2, which reveals a novel link among epigenetic regulation, the MTOR pathway, autophagy induction, and tumorigenesis.

Keywords: EZH2; MTA2; MTOR pathway; autophagy; histone modification.


Figures

Figure 1.
Figure 1.
Inhibition of EZH2 induces autophagy. (A) HeLa cells were transfected with NS (nonspecific) or EZH2-specific siRNA for 48 h with protease inhibitors (10 μM E64 and 10 μM pepstatin-A). Cells were stained with LC3B antibody (green) and DAPI, and observed under confocal microscopy for LC3B puncta. Scale bars: 10 μm. (B) Quantification of the number of LC3B puncta per cell in A. Data in B are means ± s.d. (n=50 , 3 experimental repeats). (C and D) HeLa cells were transfected with NS (nonspecific) or EZH2-specific siRNA (C) or treated with GSK126 (2 μM) (D) for 48 h in the presence or absence of protease inhibitors (E64 and pepstatin-A). Cell lysates were extracted and analyzed with immunoblotting as indicated. (E) A FLAG-tagged EZH2 or an empty plasmid was individually transfected into MCF-7 cells. 24 h after transfection, cells were then incubated in medium with or without serum for 24 h. LC3B-II accumulation was detected in the presence or absence of lysosomal protease inhibitors (E64 and pepstatin-A). (F) A FLAG-tagged EZH2Y641H mutant or an empty plasmid was individually transfected into MCF-7 cells with or without GSK126. 24 h after transfection, cells were incubated in medium with or without serum for 24 h. LC3B-II accumulation was detected in the presence or absence of lysosomal protease inhibitors (E64 and pepstatin-A).
Figure 2 (see previous page).
EZH2 regulates autophagy through the MTOR pathway. (A) A FLAG-tagged EZH2 (WT) or EZH2H689A mutant was individually transfected into MCF-7 cells for up to 48 h. Cell extracts were extracted and then analyzed with immunoblotting as indicated. (B) A FLAG-tagged EZH2Y641H mutant or an empty plasmid was individually transfected into MCF-7 cells. At 24 h post-transfection, cells were then treated with or without GSK126 for 48 h. Cell extracts were extracted and then analyzed with immunoblotting as indicated. (C) A FLAG-tagged EZH2Y641H mutant or an empty plasmid was individually transfected into MCF-7 cells with or without GSK126. 24 h after transfection, cells were incubated in medium with or without serum for 24 h. Cell extracts were extracted and then analyzed with immunoblotting as indicated. (D) HeLa cells were transfected with control (NS) or 2 independent EZH2-specific siRNAs. After 48 h, cells were further transfected with RNAi-resistant rescue form of wt-EZH2 to rescue the expression of EZH2. The cell lysate was extracted and then analyzed with immunoblotting as indicated. (E) HeLa cells were treated with or without 2 μM GSK126 for 48 h. Cell lysates were extracted and analyzed with immunoblotting as indicated. (F and G) HeLa cells were transfected with an empty plasmid or plasmids expressing active (RHEBQ64L-FLAG) or inactive (RHEBD60K-MYC) RHEB mutants. 24 h after transfection, cells were then transfected with control (NS) or EZH2-specific siRNA for 48 h with or without protease inhibitors (E64 and pepstatin-A). Cell extracts were analyzed by immunoblotting as indicated (F). Endogenous LC3B punctate signals were observed under a confocal microscope. Scale bars: 10 μm (G). (H) Quantification of the number of LC3B puncta per cell in (G). Data in (H) are means ± s.d. (n=50 , 3 experimental repeats).
Figure 3.
Figure 3.
EZH2 regulates the expression of TSC2 and other MTOR pathway-related genes. (A) HeLa cells were treated with 2 μM GSK126 for 48 h or transfected with 2 independent EZH2-specific siRNAs for 48 h. RNA was then extracted and RT-PCR was performed as indicated. (B) A FLAG-EZH2 (WT) or an empty plasmid was transfected into MCF-7 cells for 48 h. RNA was then extracted and analyzed with RT-PCR. mRNA expression level of the indicated genes is presented. (C) A FLAG-EZH2 (WT) or an empty plasmid was transfected into MCF-7 cells for 48 h. Western blots were performed using the indicated antibodies. (D) An empty plasmid, a FLAG-EZH2 (WT), a FLAG-tagged EZH2H689A mutant, or a FLAG-tagged EZH2Y641H mutant was transfected into 293T cells. 24 h later, cells transfected with EZH2Y641H were treated with GSK126 for 48 h. Western blotting was then performed using the indicated antibodies. (E and F) ChIP experiments were performed using anti-EZH2 and anti-H3[K27me3] antibodies, binding of EZH2 (E) or H3[K27me3] (F) to the indicated promoters was measured in HCT116 cells. CCND2 was used as a positive control. All error bars denote the s.d. (n=3 ).
Figure 4 (see previous page).
Gene-specific recruitment of EZH2 is dependent on MTA2 binding. (A and B) Nuclear proteins from HCT116 cells (A) or LOVO cells (B) were extracted and immunoprecipitated using anti-EZH2. Immunoprecipitation with rabbit IgG was used as a negative control. Western blotting was performed with the antibodies indicated. (C) HCT116 Cells were transfected with a nonspecific siRNA, or a siRNA targeting MTA2. ChIP assays were performed using the indicated antibodies. The enrichment of MTA2, EZH2, H3[K27me3] and H3[K27Ac] on the indicated promoter was measured. CCND2 was used as a positive control. (D) A FLAG-tagged MTA2 or an empty plasmid was individually transfected into HCT116 cells. ChIP assays were performed using the indicated antibodies. CCND2 was used as a positive control. (E) HCT116 cells transfected with MTA2 siRNA was followed by transfection of a plasmid encoding siRNA-resistant MTA2. Western blotting was performed as indicated. (F) A FLAG-tagged EZH2 or an empty plasmid was individually transfected into HCT116 cells, with or without the siRNA against MTA2. Western blotting was performed with the indicated antibodies.
Figure 5.
Figure 5.
Inhibition of MTA2 induces autophagy. (A) HeLa cells were transfected with NS (nonspecific) or 2 independent MTA2-specific siRNAs for 48 h with or without protease inhibitors (E64 and pepstatin-A). Cell lysates were extracted and analyzed with immunoblotting as indicated. (B) A FLAG-tagged MTA2 or an empty plasmid was individually transfected into 293T cells. At 24 h after transfection, cells were then incubated in medium with or without serum for 24 h. LC3B-II accumulation was detected in the presence or absence of lysosomal protease inhibitors (E64 and pepstatin-A). (C) A FLAG-tagged EZH2 or an empty plasmid was individually transfected into 293T cells with or without the siRNA against MTA2. Cells were then incubated in serum-free medium for 24 h. LC3B-II accumulation was detected in the presence or absence of lysosomal protease inhibitors (E64 and pepstatin-A). (D) HeLa cells were transfected with A FLAG-tagged EZH2 or an empty plasmid, with or without the siRNA against MTA2, and then incubated in medium with or without serum for 24 h with protease inhibitors (E64 and pepstatin-A). Cells were then stained with LC3B antibody (green), FLAG antibody (red) and DAPI. LC3B puncta was observed under confocal microscopy. Scale bars: 10 μm. (E) Quantification of the number of LC3B puncta per cell in (D). Data in (E) are means ± s.d. (n=50, 3 experimental repeats).
Figure 6.
Figure 6.
MTA2 is a chromatin-binding protein. (A) A schematic figure showing the procedures for isolating the different cellular fractions. Cell-equivalent amounts of fractions were probed by immunoblotting with anti-MTA2 to detect MTA2 enrichment in different fractions. (B) HCT116 cells were transfected with FLAG-MTA2 or an empty plasmid. The S4 fraction was immunoprecipitated with an anti-FLAG antibody. Western blotting was performed with the indicated antibodies. (C) GST, GST-MTA2 and GST-EZH2 were individually expressed, purified and incubated with reconstituted histone octamers in vitro. Histones precipitated were subjected to western blotting with anti-H3. (D) GST, GST-MTA2 and GST-EZH2 were individually expressed, purified and incubated with biotin-tagged histone peptides in vitro. (E) The GST-fusion mutant fragments of MTA2 were expressed, purified and incubated with biotin-tagged histone peptides.
Figure 7 (see previous page).
The expression levels of MTA2, EZH2, TSC2 and SQSTM1 in human CRC samples. (A) IHC analysis showing negative expression of MTA2 and EZH2 in normal tissues (left) and high expression of MTA2 and EZH2 in cancer tissues (right). (B) IHC analysis showing high expression levels of MTA2, EZH2 and SQSTM1, and low expression of TSC2 in tumor cells (CRC, case 33). (C) Another CRC (case 165) with high expression of TSC2 and low expression levels of MTA2, EZH2 and SQSTM1 in tumor cells. (D) Survival analysis of MTA2 and EZH2 expressions in a total of 197 patients with CRC. (E) A hypothetical model describing the regulatory mechanism by which EZH2 regulates MTOR and autophagy.

References

    1. Klionsky DJ. Autophagy: from phenomenology to molecular understanding in less than a decade. Nat Rev Mol Cell Biol 2007; 8:931-7; PMID:17712358; http://dx.doi.org/10.1038/nrm2245 - DOI - PubMed
    1. Mizushima N. Autophagy in Protein and Organelle Turnover. Cold Spring Harb Symp Quant Biol 2011; 76:397-402; PMID:21813637; http://dx.doi.org/10.1101/sqb.201176011023 - DOI - PubMed
    1. Feng Y, Yao Z, Klionsky DJ. How to control self-digestion: transcriptional, post-transcriptional, and post-translational regulation of autophagy. Trends Cell Biol 2015; 25:354-63; PMID:25759175; http://dx.doi.org/10.1016/j.tcb.201502002 - DOI - PMC - PubMed
    1. Kim YC, Guan KL. mTOR: a pharmacologic target for autophagy regulation. J Clin Invest 2015; 125:25-32; PMID:25654547; http://dx.doi.org/10.1172/JCI73939 - DOI - PMC - PubMed
    1. Noda T, Ohsumi Y. Tor, a phosphatidylinositol kinase homologue, controls autophagy in yeast. J Biol Chem 1998; 273:3963-6; PMID:9461583; http://dx.doi.org/10.1074/jbc.273.7.3963 - DOI - PubMed

Publication types

MeSH terms

Cite

AltStyle によって変換されたページ (->オリジナル) /