This site needs JavaScript to work properly. Please enable it to take advantage of the complete set of features!
Skip to main page content
U.S. flag

An official website of the United States government

Dot gov

The .gov means it’s official.
Federal government websites often end in .gov or .mil. Before sharing sensitive information, make sure you’re on a federal government site.

Https

The site is secure.
The https:// ensures that you are connecting to the official website and that any information you provide is encrypted and transmitted securely.

NIH NLM Logo
Log in
Access keys NCBI Homepage MyNCBI Homepage Main Content Main Navigation
. 2016 Jan 5;10(1):e0004306.
doi: 10.1371/journal.pntd.0004306. eCollection 2016 Jan.

FOXP3+ Regulatory T Cells in Hepatic Fibrosis and Splenomegaly Caused by Schistosoma japonicum: The Spleen May Be a Major Source of Tregs in Subjects with Splenomegaly

Affiliations

FOXP3+ Regulatory T Cells in Hepatic Fibrosis and Splenomegaly Caused by Schistosoma japonicum: The Spleen May Be a Major Source of Tregs in Subjects with Splenomegaly

Audrey Romano et al. PLoS Negl Trop Dis. .

Erratum in

Abstract

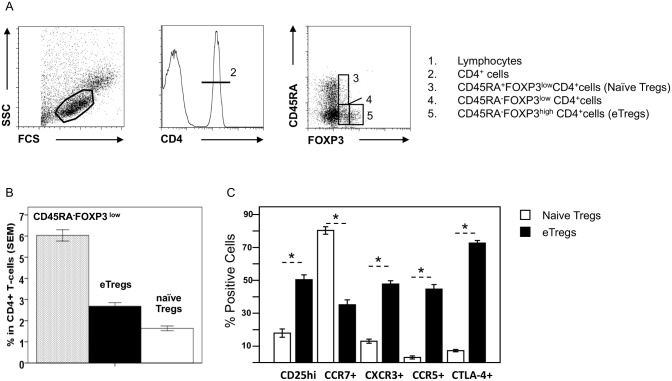
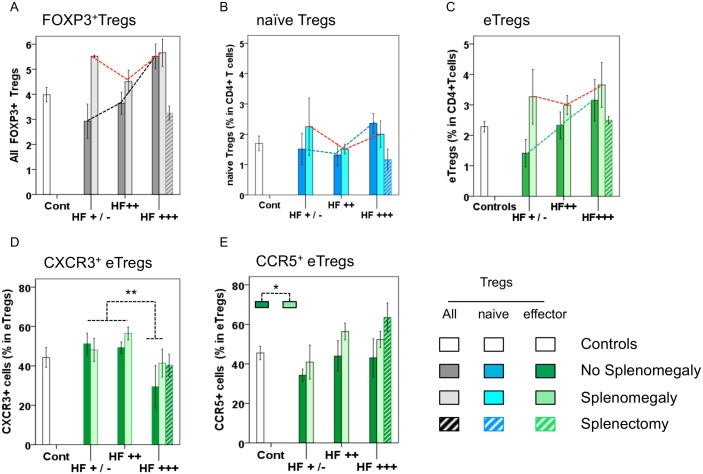
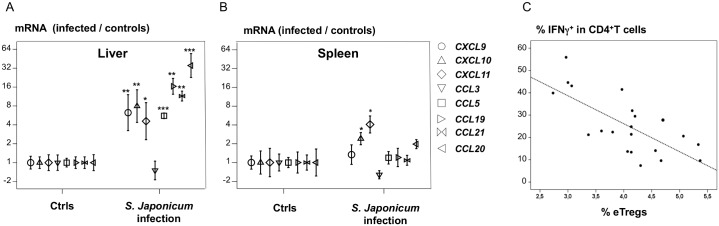
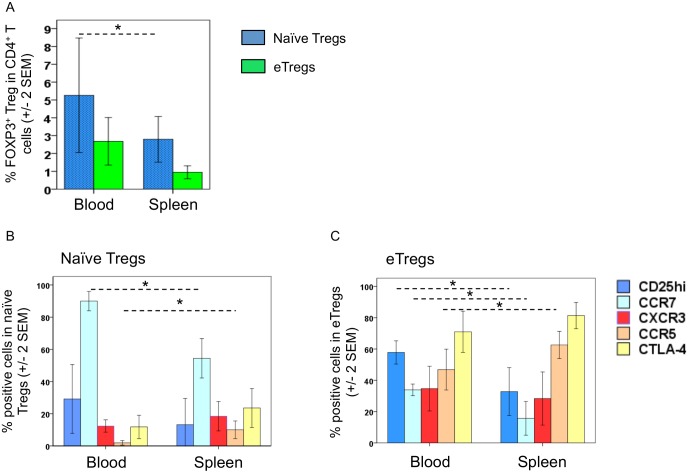
Schistosoma eggs cause chronic liver inflammation and a complex disease characterized by hepatic fibrosis (HF) and splenomegaly (SplM). FOXP3+ Tregs could regulate inflammation, but it is unclear where these cells are produced and what roles they play in human schistosomiasis. We investigated blood and spleen FOXP3+ Tregs in Chinese fishermen with lifelong exposure to Schistosoma japonicum and various degrees of liver and spleen disease. FOXP3+ Tregs accounted for 4.3% of CD4+ T cells and 41.2% of FOXP3+CD4+ T cells; they could be divided into CD45RA-FOXP3hi effector (eTregs) and CD45RA+FOXP3low naive Tregs. Blood Treg levels were high in severe HF (+1.3; p = 0.004) and in SplM (+1.03, p = 0.03). Multivariate regression showed that severe HF (+0.85, p = 0.01) and SplM (+0.97; p = 0.05) were independently associated with the higher proportion of Tregs in the blood. This effect was mostly due to an increase in the proportion of eTregs in the blood of HF+++ (+0.9%; p = 0.04) and SplM (+0.9%; p = 0.04) patients. The proportion of eTregs expressing CXCR3 in the blood was lower in the HF+++ patients (37.4 +/- 5.9%) than in those with milder fibrosis (51.7 ± 2%; p = 0.009), whereas proportion were similar for cells expressing CD25hi, CCR7, and CTLA-4. Splenectomy improves symptoms and was associated with decreases in blood FOXP3+ Treg (-2.5; p<0.001) and eTreg (-1.3; p = 0.03) levels. SplM spleens contained a high proportion of eTregs with CXCR3, CCR5 and CTLA4 upregulation and CCR7 downregulation. This, and the strong expression of ligands of CXCR3 and CCR5 in the liver (n = 8) but not in the spleen suggested that spleen eTregs migrated to Th1-infiltrated liver tissues. Such migration may be attenuated in hepatosplenic patients due to lower levels of CXCR3 expression on Tregs (p = 0.009). Thus, higher blood Treg levels are associated with severe liver disease and splenomegaly. Our data are consistent with the hypothesis that the spleen is a major source of Tregs in subjects with splenomegaly. In most cases, Tregs migrate to the Th1-infiltrated liver and the lower levels of CXCR3+ Tregs in the blood of patients with severe schistosomiasis suggest that decreases in Treg migration sites of inflammation may aggravate the disease.


Conflict of interest statement

The authors have declared that no competing interests exist.

Figures

Fig 1
Fig 1. Phenotyping of FOXP3+ Tregs.
A) Gating strategy for accurate determination of the proportion of regulatory T cells in PBMCs 1. Lymphocytes; 2. CD4+ T cells; 3. CD4+CD45RA+FOXP3low T cells; 4. CD4+CD45RA-FOXP3low T cells; 5.CD4+CD45RA-FOXP3high T cells); B) Percentage of blood CD45RA-FOXP3low non-Tregs (gray bars), CD45RA-FOXP3high T cells (black bars) and CD45RA+FOXP3low T cells (white bars) among the blood CD4+ T cells of infected patients (group 1; n = 76); C) Proportion of CD45RA-FOXP3high T cells and CD45RA+FOXP3low T cells expressing CD25, CCR7, CXCR3, CCR5, or CTLA-4 among blood CD4+ T cells in 45 patients (excluding splenectomized patients). A nonparametric test was used. * p<0.01.
Fig 2
Fig 2. Proportion of FOXP3+ Tregs according to patient clinical status.
(A) Proportions of total FOXP3+ Tregs (gray bars); B) naïve Tregs (blue bars); C) and eTregs (green bars) in the blood of study subjects, by clinical status (hepatic fibrosis grade and splenomegaly); D) Proportion of CXCR3+ cells among eTregs, by clinical status, E) Proportion of CCR5+ cells among eTregs, by clinical status. Fig 2A: Blood FOXP3+ Treg levels were positively correlated with the severity of both HF (p = 0.004) and SplM (p = 0.03). In the multivariate regression analysis, HF (p = 0.01) and SplM (p = 0.05) were associated with high blood Treg levels. Fig 2C: Blood eTreg levels were higher in patients with HF (p = 0.05) or SplM (p = 0.08) than in healthy controls. The statistical differences shown in Fig 2E correspond to the comparison of HF+/- and HF++ with HF+++ (51.7 ± 2%; p = 0.009). Subjects with splenomegaly were compared with subjects with a normal spleen (p = 0.04). All patients are from group 1 (Cont n = 20, HF+/- n = 29; HF++ n = 23; HF+++ n = 16, normal spleen n = 44, splenomegaly patients n = 24, splenectomized subjects n = 8). * p<0.05; ** p<0.01.
Fig 3
Fig 3. Ligands for CXCR3 and CCR5 are overexpressed in the livers of hepatosplenic subjects.
The highest proportions of Tregs among PBMCs were associated with the lowest levels of IFNγ production by PBMCs. A-B) Expression of the ligands for CXCR3, CCR5 and CCR7 in the liver and spleen of eight hepatosplenic patients (Group 2). Messenger RNA levels are expressed relative to the arithmetic mean values obtained for 11 healthy controls. C) The proportion of IFNγ+ cells among blood CD4+ T cells is negatively correlated (r = -0.73, p = 0.002) with the proportion of eTregs in the blood in Group 1. The proportion of IFNγ+CD4+ T cells was determined after 6h of stimulation with PMA, ionomycin and monensin. Nonparametric statistical tests were used * p<0.01, ** p<0.001, *** p<0.0001.
Fig 4
Fig 4. Proportions of naïve (blue bars) and effector (green bars) Tregs in the blood and spleen of subjects with severe spleen and liver disease (hepatosplenic subjects) requiring splenectomy.
(A) Proportions of eTregs (B) and naïve Tregs (C) expressing CD25hi, CCR7, CXCR3, CCR5 and CTLA-4 in the blood and spleen of these same hepatosplenic subjects. Data from five patients with severe disease are shown (Group 2). Nonparametric tests were used *p<0.05.

References

    1. Sakaguchi S, Yamaguchi T, Nomura T, Ono M. Regulatory T cells and immune tolerance. Cell. 2008;133(5):775–87. 10.1016/j.cell.200805009 - DOI - PubMed
    1. Rudensky AY. Regulatory T cells and Foxp3. Immunol Rev. 241(1):260–8. 10.1111/j.1600-065X.2011.01018.x - DOI - PMC - PubMed
    1. Morikawa H, Sakaguchi S. Genetic and epigenetic basis of Treg cell development and function: from a FoxP3-centered view to an epigenome-defined view of natural Treg cells. Immunol Rev. 259(1):192–205. 10.1111/imr.12174 - DOI - PubMed
    1. Ohkura N, Hamaguchi M, Morikawa H, Sugimura K, Tanaka A, Ito Y, et al. T cell receptor stimulation-induced epigenetic changes and Foxp3 expression are independent and complementary events required for Treg cell development. Immunity. 37(5):785–99. 10.1016/j.immuni.2012年09月01日0 - DOI - PubMed
    1. Fontenot JD, Gavin MA, Rudensky AY. Foxp3 programs the development and function of CD4+CD25+ regulatory T cells. Nature immunology. 2003;4(4):330–6. - PubMed

Publication types

MeSH terms

Cite

AltStyle によって変換されたページ (->オリジナル) /