This site needs JavaScript to work properly. Please enable it to take advantage of the complete set of features!
Skip to main page content
U.S. flag

An official website of the United States government

Dot gov

The .gov means it’s official.
Federal government websites often end in .gov or .mil. Before sharing sensitive information, make sure you’re on a federal government site.

Https

The site is secure.
The https:// ensures that you are connecting to the official website and that any information you provide is encrypted and transmitted securely.

NIH NLM Logo
Log in
Access keys NCBI Homepage MyNCBI Homepage Main Content Main Navigation
doi: 10.1038/srep14697.

A robust screening method for dietary agents that activate tumour-suppressor microRNAs

Affiliations

A robust screening method for dietary agents that activate tumour-suppressor microRNAs

Keitaro Hagiwara et al. Sci Rep. .

Abstract

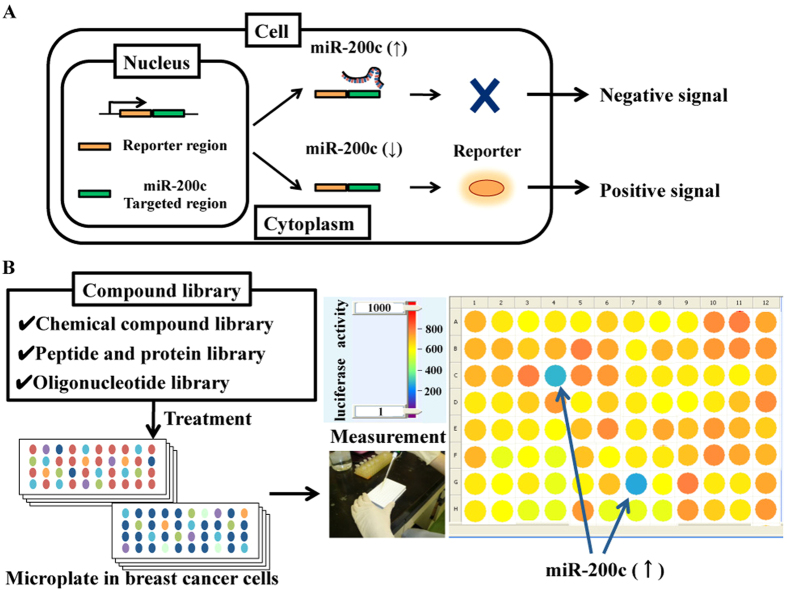
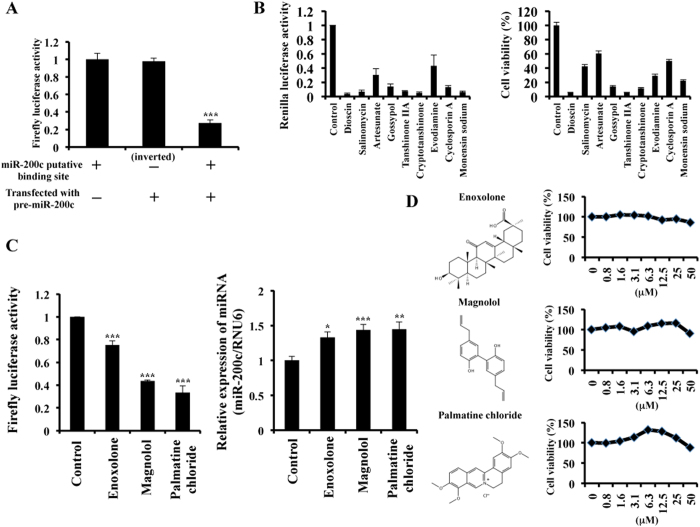
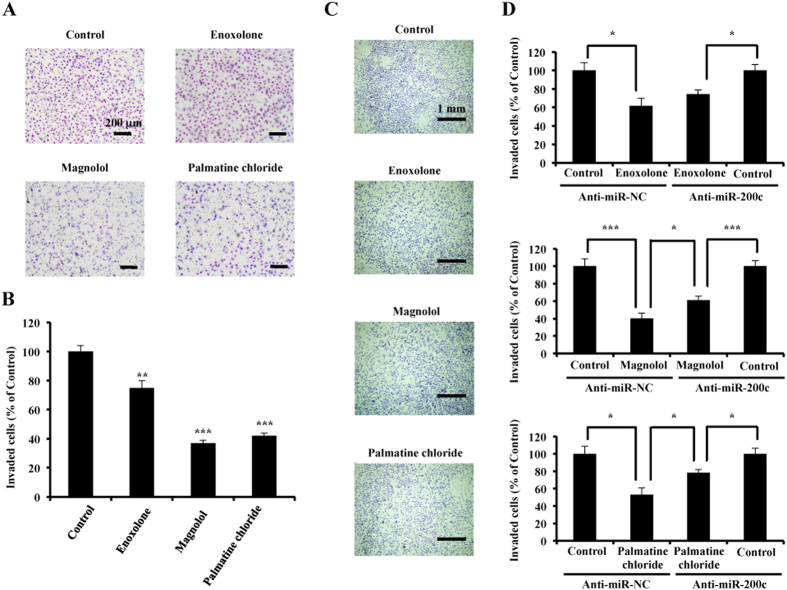
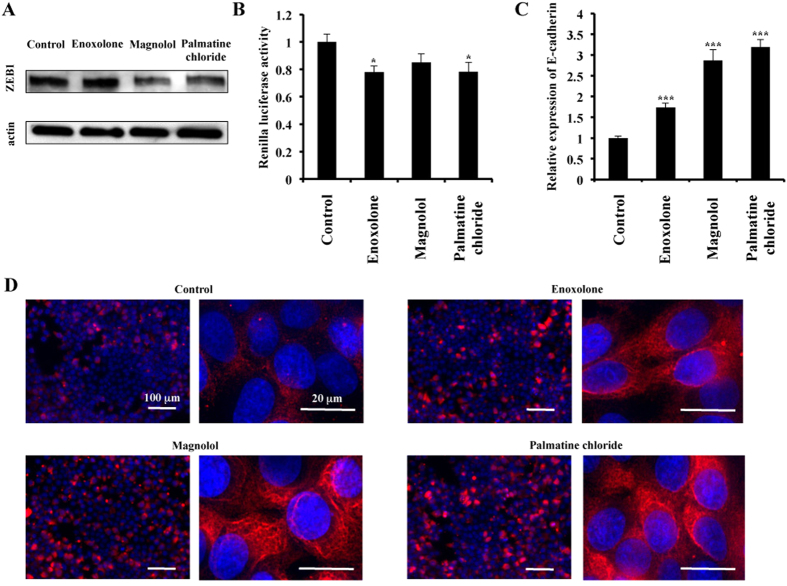
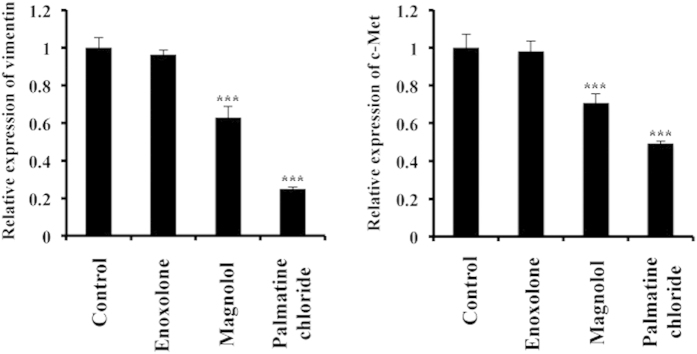
Certain dietary agents, such as natural products, have been reported to show anti-cancer effects. However, the underlying mechanisms of these substances in human cancer remain unclear. We recently found that resveratrol exerts an anti-cancer effect by upregulating tumour-suppressor microRNAs (miRNAs). In the current study, we aimed to identify new dietary products that have the ability to activate tumour-suppressor miRNAs and that therefore may serve as novel tools for the prevention and treatment of human cancers. We describe the generation and use of an original screening system based on a luciferase-based reporter vector for monitoring miR-200c tumour-suppressor activity. By screening a library containing 139 natural substances, three natural compounds - enoxolone, magnolol and palmatine chloride - were identified as being capable of inducing miR-200c expression in breast cancer cells at 10 μM. Moreover, these molecules suppressed the invasiveness of breast cancer cells in vitro. Next, we identified a molecular pathway by which the increased expression of miR-200c induced by natural substances led to ZEB1 inhibition and E-cadherin induction. These results indicate that our method is a valuable tool for a fast identification of natural molecules that exhibit tumour-suppressor activity in human cancer through miRNA activation.


Figures

Figure 1
Figure 1. Screening method for the identification of molecules that promote miR-200c activity.
(A) Schematic representation of the miR-200c monitoring system. To monitor miR-200c activity, we generated a reporter sensor vector that expresses a version of firefly luciferase and contains tandem-binding sites with a precise complementary sequence to miR-200 c. If the level of miR-200c increases after treatment with a natural substance, the firefly luciferase activity decreases. (B) A graphical scheme of the screening method for the characterisation of small molecules that can activate miR-200c expression. Using this experimental system, the compounds contained in our natural product library were screened. MCF7 cells stably expressing the reporter sensor vector were treated with 139 natural substances at concentrations of 10 μM. After 2 days of exposure, the cells were harvested and the firefly luciferase activity was measured.
Figure 2
Figure 2. Identification of natural products that activate miR-200c expression.
(A) MCF7 cells stably expressing firefly luciferase and Renilla luciferase (pmiR-200c-MCF7) were transfected with 100 nM pre-miR-200c or AllStars Negative Control for 2 days. Whole-cell lysates were collected and firefly luciferase activity was measured and normalised to Renilla luciferase activity using the Dual-Glo Luciferase Assay System. The values on the y-axis are depicted relative to the firefly luciferase activity of the AllStars Negative Control transfectant, which is defined as 1.0. (B) pmiR-200c-MCF7 cells were seeded and treated with natural compounds (10 μM) or DMSO (Control) for 2 days. Whole-cell lysates were collected, and Renilla luciferase activity was measured (left panel). The values on the y-axis are depicted relative to the Renilla luciferase activity of the DMSO treatment (Control), which is defined as 1.0. After 3 days of culture, cell viability was measured by the MTS assay (right panel). The values on the y-axis are depicted relative to the cell viability of the DMSO (Control) treatment, which is defined as 100. (C) pmiR-200c-MCF7 cells were cultured and treated with enoxolone, magnolol and palmatine chloride at 10 μM for 2 days. Whole-cell lysates were collected, and firefly luciferase activity was measured and normalised to Renilla luciferase activity using the Dual-Glo Luciferase Assay System (left panel). The values on the y-axis are depicted relative to the firefly luciferase activity of the DMSO treatment (Control), which is defined as 1.0. Cell extracts were also subjected to qRT-PCR (right panel). The values on the y-axis are depicted relative to the miR-200c expression in the DMSO-treated cells (Control), which is defined as 1.0. (D) The chemical structures of enoxolone, magnolol and palmatine chloride are shown in the left panels. pmiR-200c-MCF7 cells were cultured and treated with enoxolone, magnolol and palmatine chloride (10 μM) at 10 μM for 3 days. Cell viability was examined using the MTS assay (right panels). The values on the y-axis are depicted relative to the cell viability of the DMSO (Control) treatment, which is defined as 100. All data are shown as the mean ± S.E. *P < 0.05, **P < 0.01, ***P < 0.001.
Figure 3
Figure 3. Inhibition of invasive activity through the enhancement of miR-200c activity by natural substances.
(A,B) MDA-MB-231-luc-D3H2LN cells were grown and treated with enoxolone, magnolol or palmatine chloride (10 μM), or DMSO (Control), for 1 day and subjected to a Matrigel invasion assay. Representative photographs (A) and quantification (B) are shown. Scale bar: 200 μm. (C,D) MDA-MB231-luc-D3H2LN cells were grown and transiently transfected with anti-miR-200c or anti-miR-NC (Control). After 4 hours, the cells were treated with enoxolone, magnolol or palmatine chloride (10 μM), or DMSO (Control), for 1 day and subjected to a Matrigel invasion assay. Representative photographs (C) and quantification (D) are shown. Scale bar: 1 mm. All data are shown as the mean ± S.E. *P < 0.05, **P < 0.01, ***P < 0.001.
Figure 4
Figure 4. Effect of natural compounds on breast cancer cell phenotypes.
(A) MDA-MB-231 cells were grown and treated with enoxolone, magnolol or palmatine chloride (10 μM), or DMSO (Control). After 2 days of culture, the cells were collected, and proteins were extracted with M-PER. ZEB-1 expression was detected using immunoblotting. β-actin was used as a loading control. (B) MDA-MB-231 cells were grown and transiently transfected with a ZEB-1 3′ UTR or psiCheck-2 vector (Control) prior to treatment with the three natural compounds. After 2 days of culture, the cells were subjected to a Renilla luciferase reporter assay. The values on the y-axis are depicted relative to the Renilla luciferase activity of the cells treated with DMSO (Control), which is defined as 1.0. (C) MCF7 cells were grown and treated with enoxolone, magnolol or palmatine chloride (10 μM), or DMSO (Control). After 2 days of culture, cell extracts were subjected to qRT-PCR. The values on the y-axis are depicted relative to the E-cadherin expression of the cells treated with DMSO (Control), which is defined as 1.0. (D) Immunofluorescence staining of E-cadherin (red) was performed following 2 days of treatment. Nuclei are shown in blue. Lower magnification views are shown in the left panels, and the bars indicate 100 μm. Higher magnification views are shown in the right panels, and the bars indicate 20 μm. All data are shown as the mean ± S.E. *P < 0.05, ***P < 0.001.
Figure 5
Figure 5. Effect of natural compounds on EMT markers.
MCF7 cells were grown and treated with enoxolone, magnolol or palmatine chloride (10 μM), or DMSO (Control). After 2 days of culture, cell extracts were subjected to qRT-PCR. The values on the y-axis are depicted relative to the mRNA expression of vimentin (left panel) and c-Met (right panel). Cells treated with DMSO (Control) were used as controls, and their values were defined as 1.0. All data are shown as the mean ± S.E. *P < 0.05, ***P < 0.001.

References

    1. Lee C.-K., Klopp R. G., Weindruch R. & Prolla T. A. Gene expression profile of aging and its retardation by caloric restriction. Science. 285, 1390–1393 (1999). - PubMed
    1. Coleman D. L., Kuzava J. E. & Leiter E. H. Effect of diet on incidence of diabetes in nonobese diabetic mice. Diabetes. 39, 432–436 (1990). - PubMed
    1. Davis C. D. & Ross S. A. Dietary components impact histone modifications and cancer risk. Nutr Rev. 65, 88–94 (2007). - PubMed
    1. Epstein L. H., Myers M. D., Raynor H. A. & Saelens B. E. Treatment of pediatric obesity. Pediatrics. 101, 554–570 (1998). - PubMed
    1. Newman D. J. & Cragg G. M. Natural Products as Sources of New Drugs over the Last 25 Years. J. Nat Prod. 70, 461–477 (2007). - PubMed

Publication types

MeSH terms

Cite

AltStyle によって変換されたページ (->オリジナル) /