This site needs JavaScript to work properly. Please enable it to take advantage of the complete set of features!
Skip to main page content
U.S. flag

An official website of the United States government

Dot gov

The .gov means it’s official.
Federal government websites often end in .gov or .mil. Before sharing sensitive information, make sure you’re on a federal government site.

Https

The site is secure.
The https:// ensures that you are connecting to the official website and that any information you provide is encrypted and transmitted securely.

NIH NLM Logo
Log in
Access keys NCBI Homepage MyNCBI Homepage Main Content Main Navigation
Comparative Study
. 2015 Aug 18;9(8):e0003993.
doi: 10.1371/journal.pntd.0003993. eCollection 2015 Aug.

Comparative Analysis of Transcriptional Profiles of Adult Schistosoma japonicum from Different Laboratory Animals and the Natural Host, Water Buffalo

Affiliations
Comparative Study

Comparative Analysis of Transcriptional Profiles of Adult Schistosoma japonicum from Different Laboratory Animals and the Natural Host, Water Buffalo

Shuai Liu et al. PLoS Negl Trop Dis. .

Abstract

Background: Schistosomiasis is one of the most widely distributed parasitic diseases in the world. Schistosoma japonicum, a zoonotic parasite with a wide range of mammalian hosts, is one of the major pathogens of this disease. Although numerous studies on schistosomiasis japonica have been performed using laboratory animal models, systematic comparative analysis of whole-genome expression profiles in parasites from different laboratory animals and nature mammalian hosts is lacking to date.

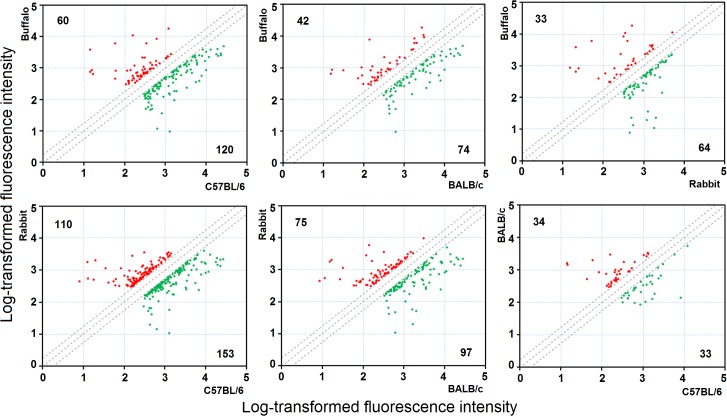
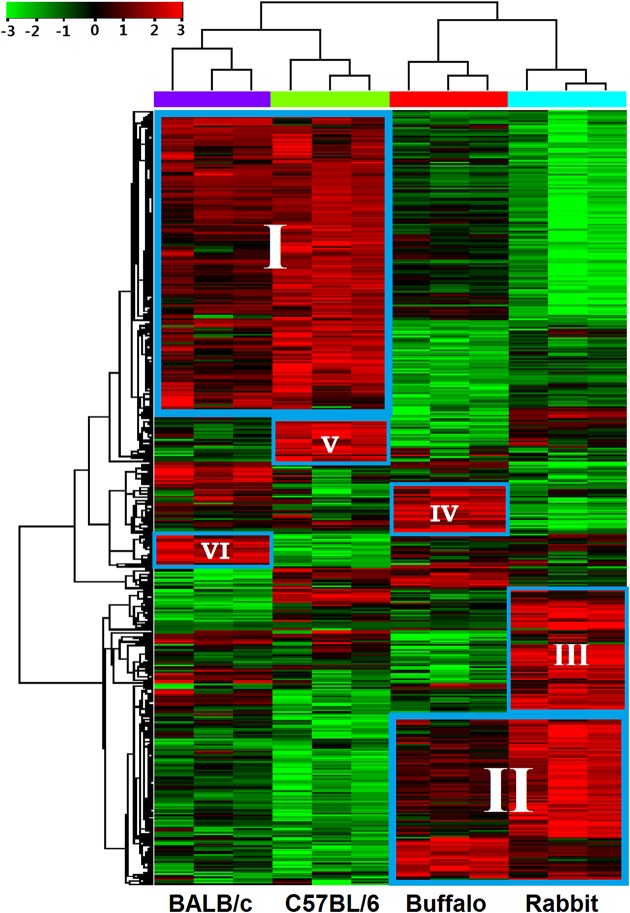
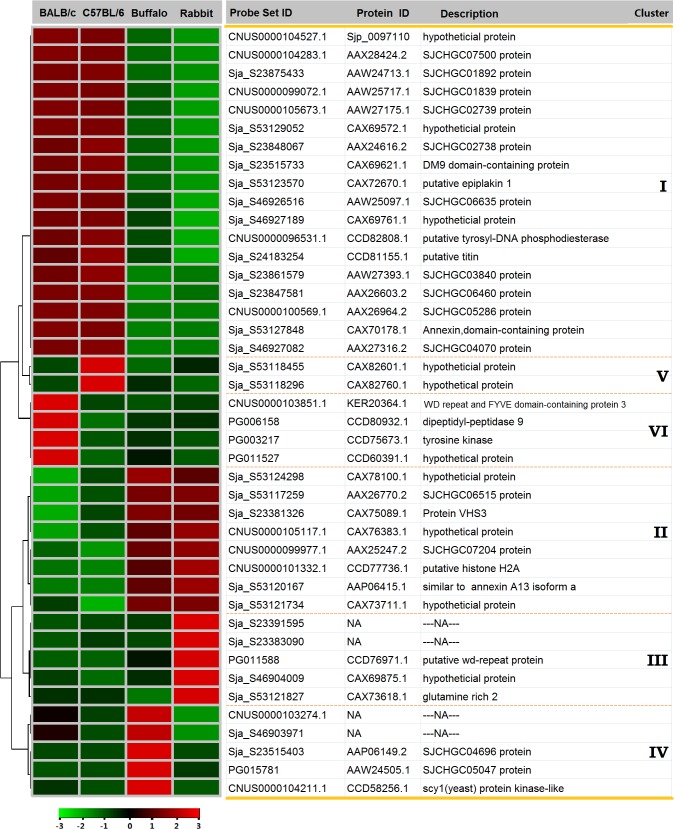
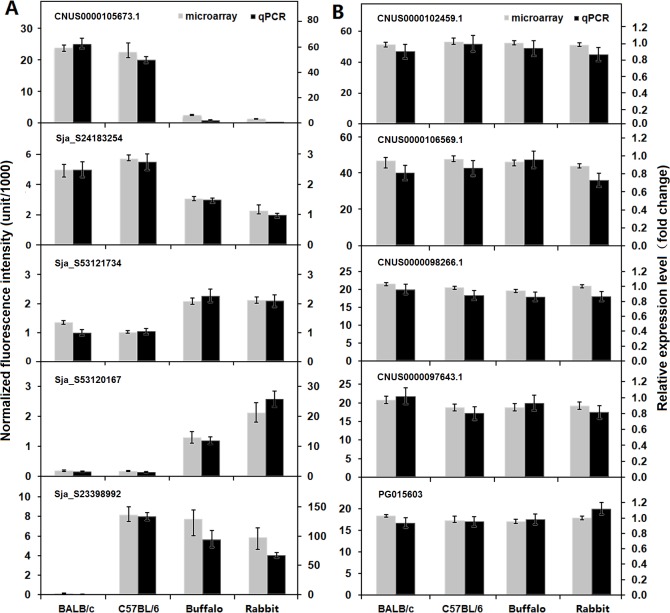
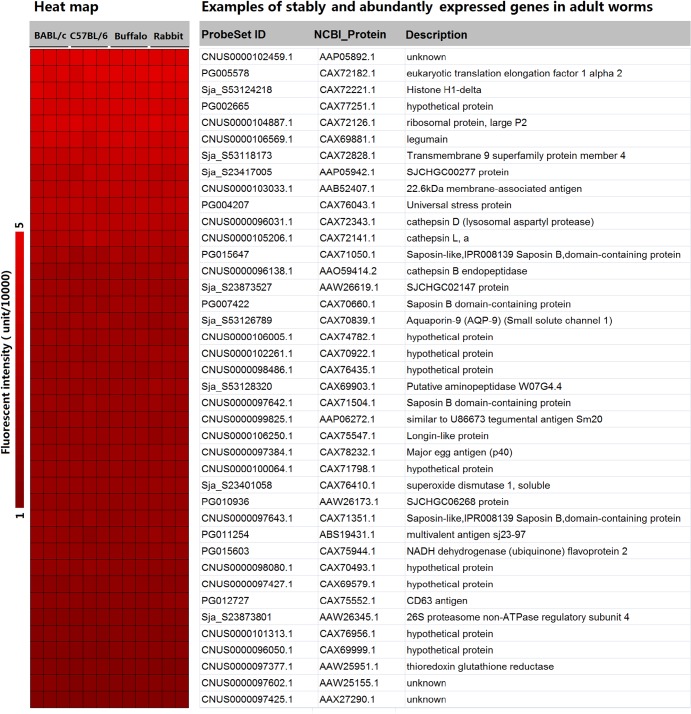
Methodology/principal findings: Adult schistosomes were obtained from laboratory animals BALB/c mice, C57BL/6 mice, New Zealand white rabbits and the natural host, water buffaloes. The gene expression profiles of schistosomes from these animals were obtained and compared by genome-wide oligonucleotide microarray analysis. The results revealed that the gene expression profiles of schistosomes from different laboratory animals and buffaloes were highly consistent (r>0.98) genome-wide. Meanwhile, a total of 450 genes were identified to be differentially expressed in schistosomes which can be clustered into six groups. Pathway analysis revealed that these genes were mainly involved in multiple signal transduction pathways, amino acid, energy, nucleotide and lipid metabolism. We also identified a group of 1,540 abundantly and stably expressed gene products in adult worms, including a panel of 179 Schistosoma- or Platyhelminthes-specific genes that may be essential for parasitism and may be regarded as novel potential anti-parasite intervention targets for future research.

Conclusions/significance: This study provides a comprehensive database of gene expression profiles of schistosomes derived from different laboratory animals and water buffaloes. An expanded number of genes potentially affecting the development of schistosomes in different animals were identified. These findings lay the foundation for schistosomiasis research in different laboratory animals and natural hosts at the transcriptional level and provide a valuable resource for screening anti-schistosomal intervention targets.


Conflict of interest statement

The authors have declared that no competing interests exist.

Figures

Fig 1
Fig 1. Scatter plots of pairwise comparisons between schistosomes from BALB/c mice, C57BL/6 mice, rabbits and water buffaloes.
The x-axis and y-axis correspond to the log-transformed fluorescent intensity values of genes in the pairwise worm samples. The red plots and green plots represent up-regulated genes and down-regulated genes, respectively (FC≥2, p<0.05). The number of up-regulated genes or down-regulated genes is shown at the upper left and lower right, respectively.
Fig 2
Fig 2. Hierarchical clustering of differentially expressed genes in worms from BALB/c mice, C57BL/6 mice, rabbits and water buffaloes.
The heat map of 450 differentially expressed genes extracted from the microarray dataset is shown (three biological replicates were performed for each worm sample). Six major clusters of differentially expressed genes were identified: cluster I, genes significantly expressed in worms from BALB/c mice and C57BL/6 mice; cluster II, genes highly expressed in worms from water buffaloes and rabbits; cluster III-VI, genes respectively up-regulated in the worms from rabbits, water buffaloes, C57BL/6 mice and BALB/c mice. The color scale represents relative expression levels: red, up-regulated; green, down-regulated; and black, unchanged.
Fig 3
Fig 3. Examples of differentially expressed genes from the six clusters.
The heat map illustrates the hierarchical clustering of 42 selected common differentially expressed genes using the average gene expression values of the three biological replicates. The color scale represents relative expression levels: red, up-regulated; green, down-regulated; and black, unchanged.
Fig 4
Fig 4. Validation of a subset of genes exhibiting different expression patterns.
The expression patterns of ten selected genes in adult worms from BALB/c mice, C57BL/6 mice, rabbits and water buffaloes were quantified by real-time PCR analysis. (A) Genes differentially expressed in worms from the four mammalian hosts. (B) Genes stably expressed in worms from the four mammalian hosts. The corresponding microarray gene expression data are presented as the average gene expression values of three biological replicates, and the upper and lower error bars represent the maximum and minimum values of the three biological replicates. The relative expression levels of genes were calculated using SDS v1.4 software (Applied Biosystems) and the error bars represent the standard deviation for three technical replicates.
Fig 5
Fig 5. Gene ontology distributions of the differentially expressed genes in adult worms from BALB/c mice, C57BL/6 mice, rabbits and buffaloes.
The Blast2Go program defined the GO terms in three categories: biological processes, molecular functions, and cellular components. Data without assigned GO terms were excluded from the graph.
Fig 6
Fig 6. Transcription profiles of four Schistosoma-specific genes in worms from different mammalian hosts and developmental stages.
(A) Transcription profiles of the four Schistosoma-specific genes in adult worms from BALB/c mice, C57BL/6 mice, water buffaloes and rabbits. (B) Transcription profiles of the four Schistosoma-specific genes in egg, schistosomulum, adult worm (from rabbits) and cercaria. The average gene expression values of three biological replicates were obtained from the microarray data. The upper and lower error bars represent the maximum and minimum values of the three biological replicates.
Fig 7
Fig 7. Examples of abundantly and stably expressed genes in adult worms from BALB/c mice, C57BL/6 mice, rabbits and water buffaloes.
The heat map shows the normalized fluorescent intensity values of these genes abstracted from the microarray data. Three biological replicates were performed for each worm sample.
Fig 8
Fig 8. Molecular phylogenetic relationships and expression profiles of Schistosoma VAL genes.
(A) The unrooted phylogenetic tree was generated using MEGA5.0 and the neighbor-joining method with 1000 bootstrap replicates. The tree was divided into two phylogenetic groups, and the bootstrap values are shown at the nodes. S. japonicum genes are indicated in red letters, and S. mansoni genes are indicated in black letters. くろまる represents differentially expressed genes in adult worms from the different mammalian hosts. (B) Transcription profiles of ten SjVALs in adult worms from BALB/c mice, C57BL/6 mice, rabbits and water buffaloes. (C) Transcription profiles of ten SjVALs in egg, schistosomulum, adult worm (from rabbit) and cercaria. The average gene expression values of three biological replicates were obtained from the microarray data. The upper and lower error bars represent the maximum and minimum values of the three biological replicates.

References

    1. Steinmann P, Keiser J, Bos R, Tanner M, Utzinger J. Schistosomiasis and water resources development: systematic review, meta-analysis, and estimates of people at risk. Lancet Infect Dis. 2006;6(7):411–25. - PubMed
    1. Vos T, Flaxman AD, Naghavi M, Lozano R, Michaud C, Ezzati M, et al. Years lived with disability (YLDs) for 1160 sequelae of 289 diseases and injuries 1990–2010: a systematic analysis for the Global Burden of Disease Study 2010. Lancet. 2012;380(9859):2163–96. 10.1016/S0140-6736(12)61729-2 - DOI - PMC - PubMed
    1. Colley DG, Bustinduy AL, Secor WE, King CH. Human schistosomiasis. Lancet. 2014;383(9936):2253–64 10.1016/S0140-6736(13)61949-2 - DOI - PMC - PubMed
    1. Gryseels B, Polman K, Clerinx J, Kestens L. Human schistosomiasis. Lancet. 2006;368(9541):1106–18. - PubMed
    1. He YX, Salafsky B, Ramaswamy K. Host—parasite relationships of Schistosoma japonicum in mammalian hosts. Trends Parasitol. 2001;17(7):320–4. - PubMed

Publication types

Substances

Cite

AltStyle によって変換されたページ (->オリジナル) /