This site needs JavaScript to work properly. Please enable it to take advantage of the complete set of features!
Skip to main page content
U.S. flag

An official website of the United States government

Dot gov

The .gov means it’s official.
Federal government websites often end in .gov or .mil. Before sharing sensitive information, make sure you’re on a federal government site.

Https

The site is secure.
The https:// ensures that you are connecting to the official website and that any information you provide is encrypted and transmitted securely.

NIH NLM Logo
Log in
Access keys NCBI Homepage MyNCBI Homepage Main Content Main Navigation
. 2015 Oct;83(10):4103-17.
doi: 10.1128/IAI.00769-15. Epub 2015 Aug 3.

Comparative Genomics Provides Insight into the Diversity of the Attaching and Effacing Escherichia coli Virulence Plasmids

Affiliations

Comparative Genomics Provides Insight into the Diversity of the Attaching and Effacing Escherichia coli Virulence Plasmids

Tracy H Hazen et al. Infect Immun. 2015 Oct.

Abstract

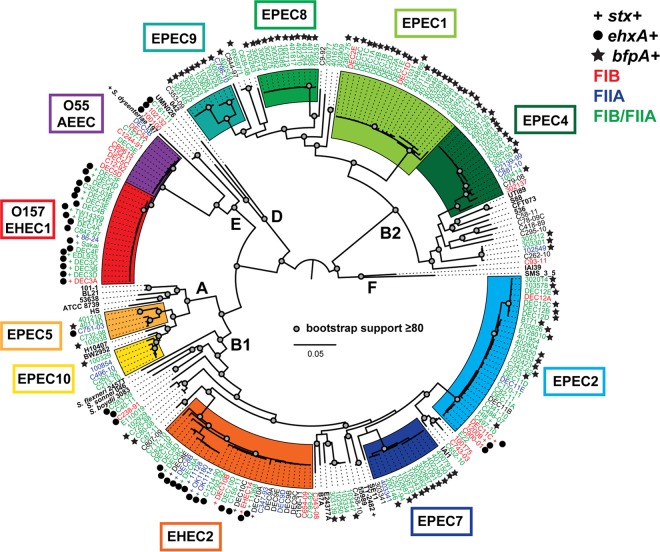
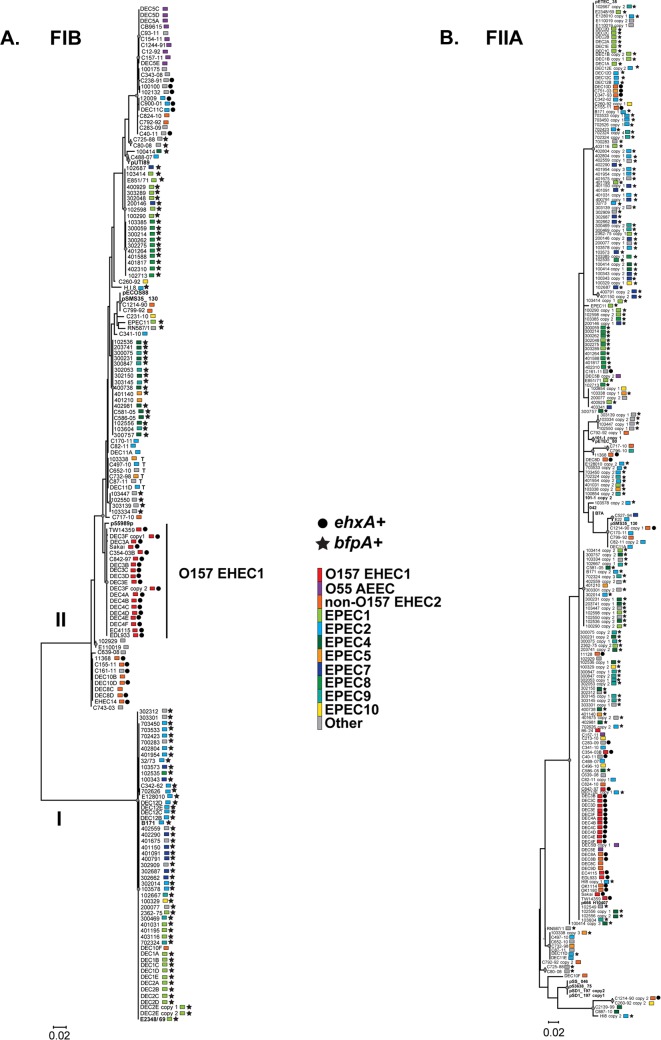
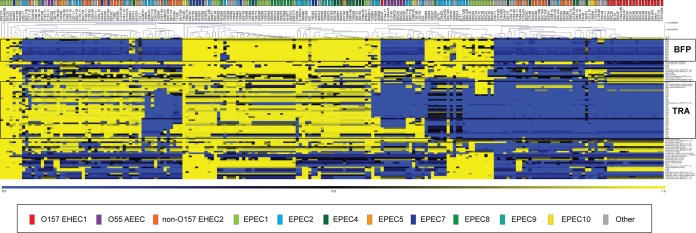
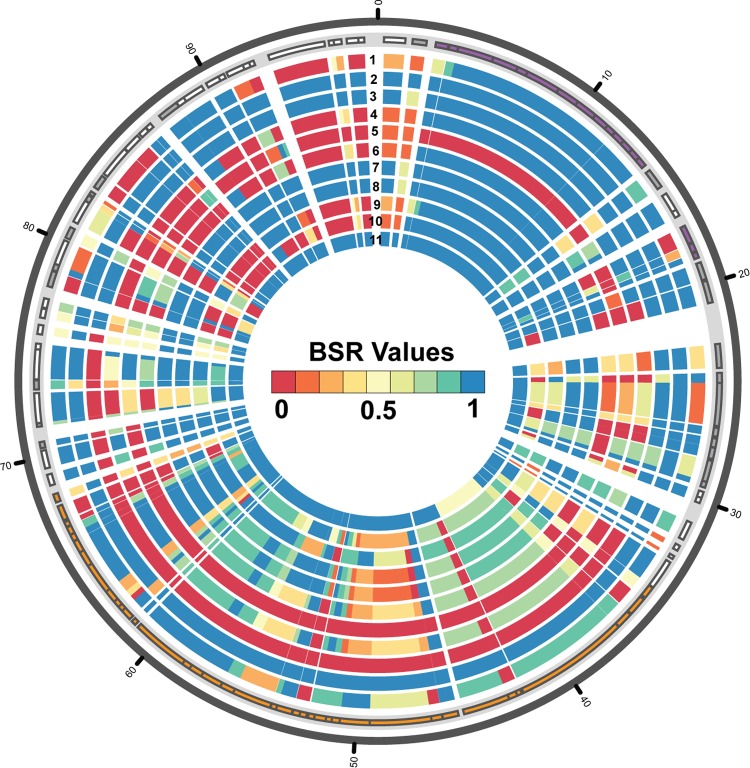
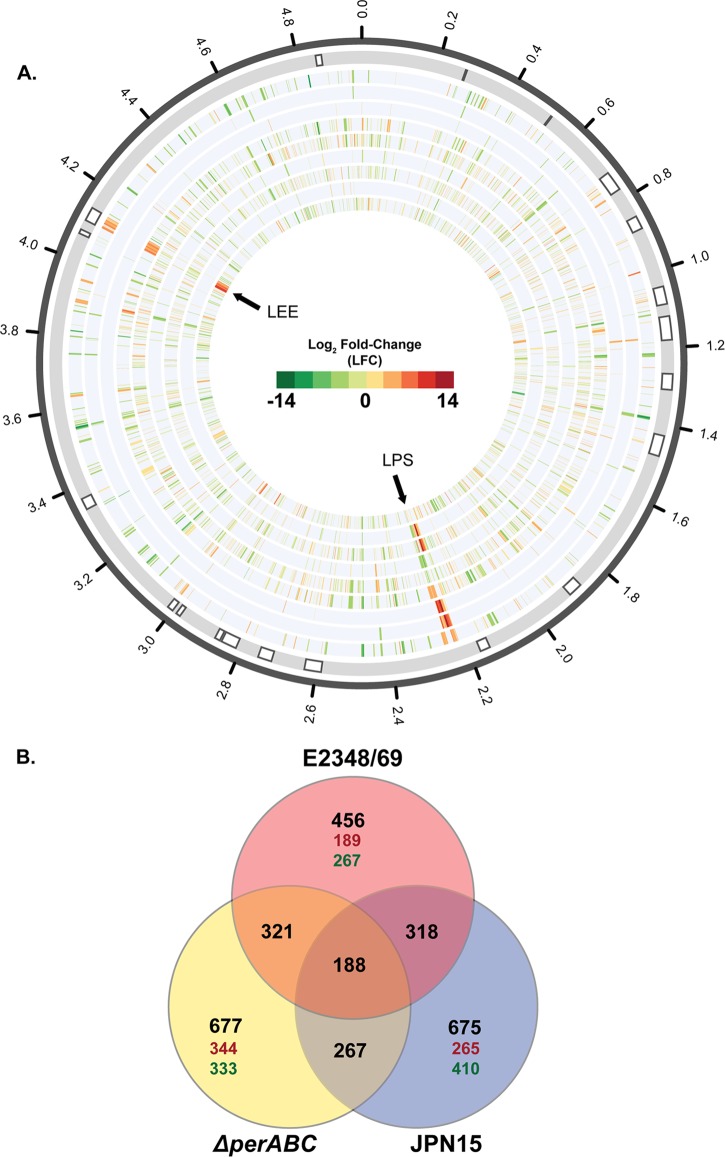
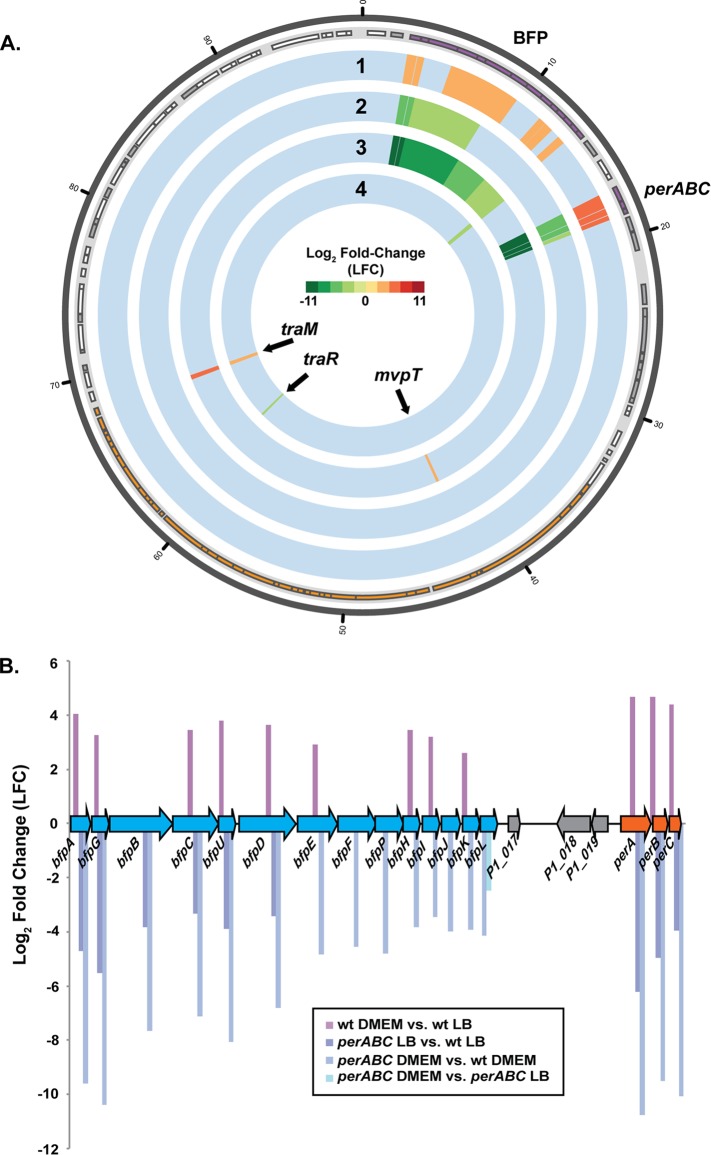
Attaching and effacing Escherichia coli (AEEC) strains are a genomically diverse group of diarrheagenic E. coli strains that are characterized by the presence of the locus of enterocyte effacement (LEE) genomic island, which encodes a type III secretion system that is essential to virulence. AEEC strains can be further classified as either enterohemorrhagic E. coli (EHEC), typical enteropathogenic E. coli (EPEC), or atypical EPEC, depending on the presence or absence of the Shiga toxin genes or bundle-forming pilus (BFP) genes. Recent AEEC genomic studies have focused on the diversity of the core genome, and less is known regarding the genetic diversity and relatedness of AEEC plasmids. Comparative genomic analyses in this study demonstrated genetic similarity among AEEC plasmid genes involved in plasmid replication conjugative transfer and maintenance, while the remainder of the plasmids had sequence variability. Investigation of the EPEC adherence factor (EAF) plasmids, which carry the BFP genes, demonstrated significant plasmid diversity even among isolates within the same phylogenomic lineage, suggesting that these EAF-like plasmids have undergone genetic modifications or have been lost and acquired multiple times. Global transcriptional analyses of the EPEC prototype isolate E2348/69 and two EAF plasmid mutants of this isolate demonstrated that the plasmid genes influence the expression of a number of chromosomal genes in addition to the LEE. This suggests that the genetic diversity of the EAF plasmids could contribute to differences in the global virulence regulons of EPEC isolates.


Figures

FIG 1
FIG 1
Single nucleotide polymorphism (SNP)-based phylogenomic analysis of the 210 AEEC genomes analyzed in this study compared to a reference collection of 25 diverse E. coli and Shigella genomes. SNPs were detected relative to the completed genome sequence of the laboratory isolate E. coli IAI39 with the In Silico Genotyper (ISG) (34). There were 75,504 SNP sites that were identified in all of the genomes analyzed, and these were concatenated into a representative sequence for each genome and used to generate a phylogeny. A maximum-likelihood phylogeny with 100 bootstrap replicates was constructed using RAxML v.7.2.8 (36). The genome names are colored by the plasmid rep type that was detected in the genome sequence. Red indicates that they contained only the FIB and not the FIIA repA gene, blue indicates that they contained only the FIIA and not the FIB repA gene, and green indicates that the genome contained both the FIB and FIIA repA genes. The symbols next to each genome indicate the presence of the genes for Shiga toxin, stx, the EHEC hemolysin, ehxA, and the major subunit of the bundle-forming pilus, bfpA. The clades in the phylogeny are colored by phylogenomic lineage, and the previously designated E. coli phylogroups are indicated by the designations A, B1, B2, D, E, and F (53, 54).
FIG 2
FIG 2
Phylogenetic analysis of the FIB replication protein-encoding gene, repA (A), and the FIIA replication protein-encoding gene, repA (B), identified in all AEEC genomes analyzed in this study. The nucleotide sequences were aligned in MEGA5 (37) using ClustalW (38). A maximum-likelihood phylogeny was constructed in MEGA5 (37) using the Kimura 2-parameter model and 1,000 bootstrap replications. All major nodes of the tree are supported by bootstrap values of ≥50 and are indicated on the phylogeny by a circle. The scale bar represents the distance of the number of nucleotide substitutions per site. The symbols next to each genome indicate the presence of the genes for EHEC hemolysin, ehxA, and the major subunit of the bundle-forming pilus, bfpA. The clades in the phylogeny are colored by phylogenomic lineage.
FIG 3
FIG 3
In silico detection of genes that have similarity to those of the EAF plasmid, pMAR2 (21, 22). TBLASTN (41) BSR (40) analysis of proteins encoded by the EAF plasmid pMAR2 (21, 22) of the EPEC1 lineage prototype isolate E2348/69, compared to the 210 AEEC genomes analyzed in this study, was carried out. Each square represents the BSR of a single gene compared to each genome. Each row is a gene, while each column is a genome. Hierarchical cluster analysis was performed using the Pearson correlation coefficient of MeV (76–78). The colored rectangle above each genome indicates the phylogenomic lineage that each genome belongs to in Fig. 1. The colors of the heatmap indicate the BSRs corresponding to the presence (yellow), divergence (black), or absence (blue) of each of the plasmid genes in each AEEC genome.
FIG 4
FIG 4
Circular display of genes with similarity to those of pMAR2 in the genomes of EPEC isolates from diverse phylogenomic lineages. The nucleotide sequences of predicted protein-encoding genes and pseudogenes of pMAR2 (21, 22) were compared to selected EPEC genomes and the previously sequenced EPEC2 plasmid pB171 (23), using BLASTN (42). A BSR was generated for each predicted protein-encoding sequence and pseudogene compared to each genome as previously described (40), and the plot was generated using Circos (43). Genes are indicated in the light gray outer track of the plot as rectangles of different sizes according to their coordinates and are colored purple to indicate BFP-associated genes, orange to indicate the conjugal transfer region, white to indicate protein-encoding genes, and gray to indicate pseudogenes. The genomes in the plot, from the outer BSR track to the inner track, are as follows: EPEC1 isolate 303289 (track 1), EPEC1 isolate 403116 (track 2), EPEC2 plasmid pB171 (track 3), EPEC4 isolate C581-05 (track 4), EPEC4 isolate 100414 (track 5), EPEC5 isolate 401140 (track 6), EPEC7 isolate 402290 (track 7), EPEC7 isolate 401091 (track 8), EPEC8 isolate 401588 (track 9), EPEC9 isolate 302053 (track 10), and EPEC10 isolate 100329 (track 11). The BSR scale is in the middle of the figure, with blue indicating genes that were present with significant similarity, yellow indicating divergent sequences, and red indicating genes that were absent.
FIG 5
FIG 5
RNA-Seq analysis of the global transcription of the E2348/69 chromosome. (A) Circular display of the differential expression analysis of genes on the E2348/69 chromosome (22). RNA-Seq was used to determine changes in the global transcription of wild-type E2348/69, an E2348/69 ΔperABC mutant, and the isogenic plasmid-free E2348/69 isolate, JPN15. The color scale indicates log2 fold change (LFC) from −14 (green) to 14 (red). The outermost track denotes the location of previously identified prophage and insertion element regions of E2348/69 (indicated by white boxes) (22). The tracks of differential expression data are as follows, from the outer track to the innermost track: wild-type E2348/69 in DMEM versus wild-type E2348/69 in LB (track 2), the ΔperABC mutant in LB versus wild-type E2348/69 LB (track 3), the ΔperABC mutant in DMEM versus wild-type E2348/69 in DMEM (track 4), the ΔperABC mutant in DMEM versus the ΔperABC mutant in LB (track 5), the ΔperABC mutant in LB versus JPN15 in LB (track 6), the ΔperABC mutant in DMEM versus JPN15 in DMEM (track 7), JPN15 in LB versus wild-type E2348/69 in LB (track 8), JPN15 in DMEM versus wild-type E2348/69 in DMEM (track 9), and JPN15 in DMEM versus JPN15 in LB (track 10). (B) Venn diagram with the number of differentially expressed chromosomal genes that are shared or exclusive to wild-type E2348/69, E2348/69 ΔperABC mutant, and JPN15 RNA-Seq samples. Red indicates the number of chromosomal genes that were differentially expressed in wild-type E2348/69, yellow indicates the genes differentially expressed in the ΔperABC mutant, and blue indicates the genes differentially expressed in JPN15. The regions of overlap indicate the number of differentially expressed genes that were shared between the different samples. The black numbers in the outer circle represent the total number of transcriptionally altered genes; in red are the number of exclusive genes in each isolate that had increased expression, and in green are the number of exclusive genes in each isolate that had decreased expression.
FIG 6
FIG 6
RNA-Seq analysis of the global transcription of the E2348/69 EAF plasmid pMAR2. (A) Circular display of the differential expression analysis of genes on the EAF plasmid pMAR2 (22). RNA-Seq was used to determine changes in the global transcription of wild-type E2348/69, an E2348/69 ΔperABC mutant, and JPN15. The color scale indicates log2 fold change (LFC) from −11 (green) to 11 (red). The outermost track denotes the location of the protein-encoding genes and pseudogenes (22). Genes are indicated in the light gray outer track of the plot as rectangles of different sizes according to their coordinates and are colored purple to indicate BFP-associated genes, orange to indicate the conjugal transfer region, white to indicate protein-encoding genes, and gray to indicate pseudogenes. The tracks of differential expression data are as follows, from the outer track to the innermost track: wild-type E2348/69 in DMEM versus wild-type E2348/69 in LB (track 1), the ΔperABC mutant in LB versus wild-type E2348/69 LB (track 2), the ΔperABC mutant in DMEM versus wild-type E2348/69 in DMEM (track 3), and the ΔperABC mutant in DMEM versus the ΔperABC mutant in LB (track 4). (B) Diagram of the pMAR2 BFP operon and the LFC values of each gene in the BFP operon. The approximate size of each gene and the coding strand location are indicated by the size and orientation of the arrows. Genes identified in blue are involved in pilus biogenesis, while orange indicates the plasmid-encoded regulator genes, and gray indicates genes that encode hypothetical proteins.
FIG 7
FIG 7
Gel image of the plasmid profiles of EPEC isolates. (A) ERIC PCR profiles of the EPEC prototype isolate E2348/69 and three EPEC isolates (302053, 401195, and 401588). "L1" indicates the 1-kb Plus ladder (Invitrogen). "N" indicates a no-template PCR control. (B) Plasmid profiles of E2348/69, 302053, 401195, and 401588. L2 indicates the lambda HindIII ladder (New England BioLabs), which is a linear DNA ladder that was included for reference comparison to the linearized chromosomal DNA in each plasmid isolation that corresponds to the top band of the ladder. Plus and minus signs indicate the presence and absence of the EAF plasmid in each of the isolates in panels A and B.

References

    1. Kaper JB, Nataro JP, Mobley HL. 2004. Pathogenic Escherichia coli. Nat Rev Microbiol 2:123–140. doi:10.1038/nrmicro818. - DOI - PubMed
    1. Pennington H. 2010. Escherichia coli O157. Lancet 376:1428–1435. doi:10.1016/S0140-6736(10)60963-4. - DOI - PubMed
    1. Kotloff KL, Nataro JP, Blackwelder WC, Nasrin D, Farag TH, Panchalingam S, Wu Y, Sow SO, Sur D, Breiman RF, Faruque AS, Zaidi AK, Saha D, Alonso PL, Tamboura B, Sanogo D, Onwuchekwa U, Manna B, Ramamurthy T, Kanungo S, Ochieng JB, Omore R, Oundo JO, Hossain A, Das SK, Ahmed S, Qureshi S, Quadri F, Adegbola RA, Antonio M, Hossain MJ, Akinsola A, Mandomando I, Nhampossa T, Acacio S, Biswas K, O'Reilly CE, Mintz ED, Berkeley LY, Muhsen K, Sommerfelt H, Robins-Browne RM, Levine MM. 2013. Burden and aetiology of diarrhoeal disease in infants and young children in developing countries (the Global Enteric Multicenter Study, GEMS): a prospective, case-control study. Lancet 382:209–222. doi:10.1016/S0140-6736(13)60844-2. - DOI - PubMed
    1. Ochoa TJ, Contreras CA. 2011. Enteropathogenic Escherichia coli infection in children. Curr Opin Infect Dis 24:478–483. doi:10.1097/QCO.0b013e32834a8b8b. - DOI - PMC - PubMed
    1. Jerse AE, Yu J, Tall BD, Kaper JB. 1990. A genetic locus of enteropathogenic Escherichia coli necessary for the production of attaching and effacing lesions on tissue culture cells. Proc Natl Acad Sci U S A 87:7839–7843. doi:10.1073/pnas.87.20.7839. - DOI - PMC - PubMed

Publication types

MeSH terms

Substances

Cite

AltStyle によって変換されたページ (->オリジナル) /