Cholera: a comparison of the 2008-9 and 2010 outbreaks in Kadoma City, Zimbabwe
- PMID: 26113952
- PMCID: PMC4470448
- DOI: 10.11604/pamj.201520221.5197
Cholera: a comparison of the 2008-9 and 2010 outbreaks in Kadoma City, Zimbabwe
Abstract
Introduction: Kadoma City experienced cholera outbreaks in 2008-9, and 2010, affecting 6,393 and 123 people, respectively. A study was conducted to compare epidemiology of the cholera outbreaks.
Methods: A descriptive cross sectional study was conducted, analyzing line list data for the 2 outbreaks. Proportions, means were generated and compared using the Chi Square test at 5% level of significance.
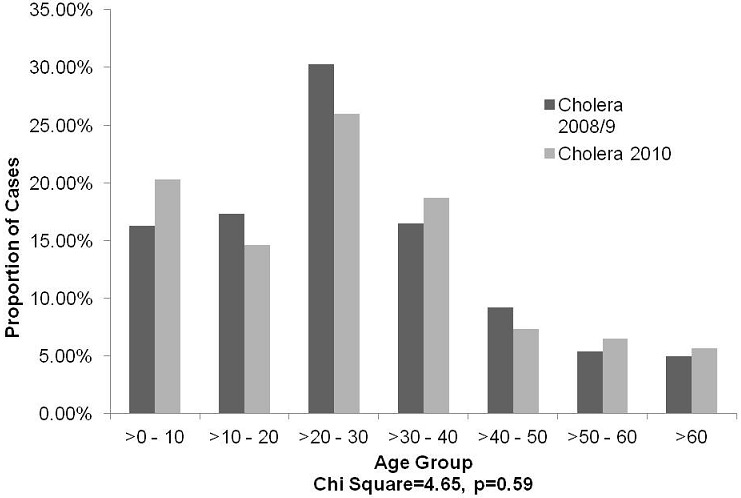
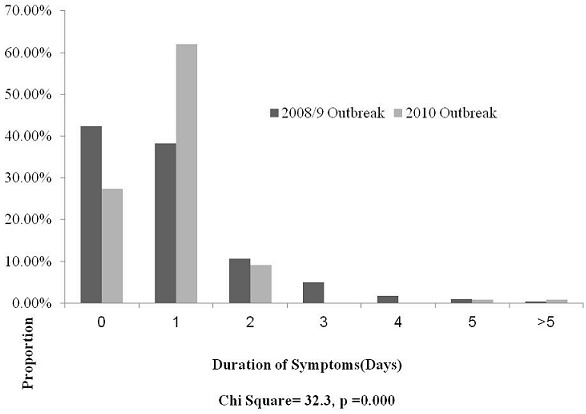
Results: Cholera cases were similar by gender and age, with the 20-30 years group being most affected. Rimuka township contributed 80% and 100% of city cases in 2008-9 and 2010, respectively, p value = 0.000. In 2008-9, 91% of cholera cases presented within 2 days compared to 98% in 2010. Delay seeking treatment increased from 58% to 73% (p value = 0.001), with gender, and place equally affected. The 2010 outbreak evolved faster, resulting in higher proportion being managed in CTU. CFR was 2% in 2008-9, and 3.3% in 2010 (p value =0.31).
Conclusion: The 2008-9 and 2010 cholera outbreaks were similar by age and gender. Rimuka Township was most affected by the outbreaks. There was worsening of delay seeking treatment. The 2010 outbreak was more rapid, leading to early opening of CTC. CFR was consistently above 1%.
Keywords: Cholera trends; Kadoma; Zimbabwe.
Figures
References
-
- World Health Organization. Cholera fact sheet Number 107; August 201 Accessed from http://www.who.int/mediacentre/factsheets/fs107/en/on1/12/11.
-
- Government of Zimbabwe. Public Health Act; http://www.parlzim.gov.zw/cms/Acts/Title15_HEALTH/PUBLIC_HEALTH_ACT_15_0... accessed 6/9/11.
-
- World Health Organization/Ministry of Health and Child Welfare. World Health Organization; 2011. Integrated Disease Surveillance and Response Technical guidelines; p. 18.
-
- Heyman DL. 19th Edition. APHA and WHO Publication; 2004. Control of communicable diseases; pp. 103–111.
-
- World Health Organization. Cholera: Global Surveillance Summary, 2008. 2009;84:309–324. Accessed on http://www.who.int/wer/2009/wer8431.pdf on 1/12/11. Weekly Epidemiological Record No. 31.
MeSH terms
LinkOut - more resources
Full Text Sources
Other Literature Sources
Medical