This site needs JavaScript to work properly. Please enable it to take advantage of the complete set of features!
Skip to main page content
U.S. flag

An official website of the United States government

Dot gov

The .gov means it’s official.
Federal government websites often end in .gov or .mil. Before sharing sensitive information, make sure you’re on a federal government site.

Https

The site is secure.
The https:// ensures that you are connecting to the official website and that any information you provide is encrypted and transmitted securely.

NIH NLM Logo
Log in
Access keys NCBI Homepage MyNCBI Homepage Main Content Main Navigation
. 2015 Apr 30:15:42.
doi: 10.1186/s12874-015-0031-0.

Meta-analysis of incidence rate data in the presence of zero events

Affiliations

Meta-analysis of incidence rate data in the presence of zero events

Matthew J Spittal et al. BMC Med Res Methodol. .

Abstract

Background: When summary results from studies of counts of events in time contain zeros, the study-specific incidence rate ratio (IRR) and its standard error cannot be calculated because the log of zero is undefined. This poses problems for the widely used inverse-variance method that weights the study-specific IRRs to generate a pooled estimate.

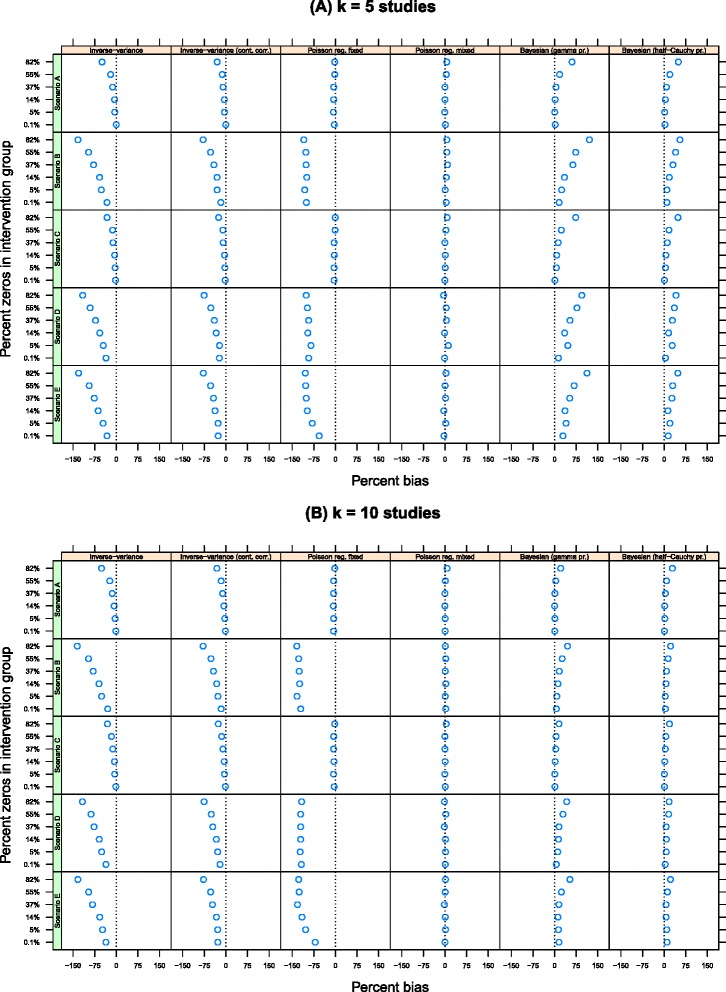
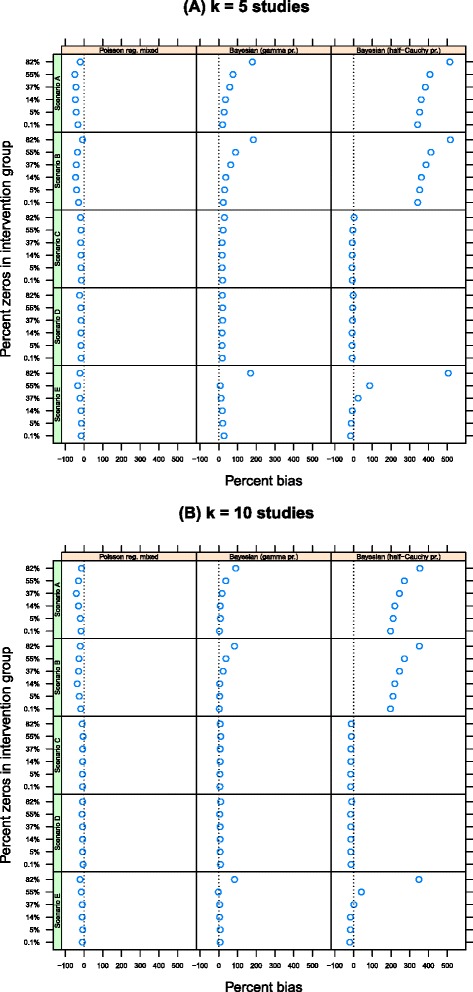
Methods: We conducted a simulation study to compare the inverse-variance method of conducting a meta-analysis (with and without the continuity correction) with alternative methods based on either Poisson regression with fixed interventions effects or Poisson regression with random intervention effects. We manipulated the percentage of zeros in the intervention group (from no zeros to approximately 80 percent zeros), the levels of baseline variability and heterogeneity in the intervention effect, and the number of studies that comprise each meta-analysis. We applied these methods to an example from our own work in suicide prevention and to a recent meta-analysis of the effectiveness of condoms in preventing HIV transmission.

Results: As the percentage of zeros in the data increased, the inverse-variance method of pooling data shows increased bias and reduced coverage. Estimates from Poisson regression with fixed interventions effects also display evidence of bias and poor coverage, due to their inability to account for heterogeneity. Pooled IRRs from Poisson regression with random intervention effects were unaffected by the percentage of zeros in the data or the amount of heterogeneity.

Conclusion: Inverse-variance methods perform poorly when the data contains zeros in either the control or intervention arms. Methods based on Poisson regression with random effect terms for the variance components are very flexible offer substantial improvement.


Figures

Figure 1
Figure 1
Percentage bias in the estimate of β^¯int by number of studies, estimation method and percentage of zeros in the data. The true value is log(0.2)=−1.609 and the estimates are unbiased if they fall along the x=0 line. (A) k = 5 studies and (B) k = 10 studies.
Figure 2
Figure 2
Mean square error by number of studies, estimation method and percentage of zeros in the data. Lower values are preferable to higher values. (A) k = 5 studies and (B) k = 10 studies.
Figure 3
Figure 3
Coverage by number of studies, estimation method and percentage of zeros in the data. Methods with good coverage will have values close to x=95 percent. (A) k = 5 studies and (B) k = 10 studies.
Figure 4
Figure 4
Percentage bias in the estimate of σ^¯ by number of studies, estimation method and percentage of zeros in the data. The estimates are unbiased if they fall along the x=0 line. (A) k = 5 studies and (B) k = 10 studies.
Figure 5
Figure 5
Percentage bias in the estimate of τ^¯ by number of studies, estimation method and percentage of zeros in the data. The estimates are unbiased if they fall along the x=0 line. (A) k =n 5 studies and (B) k = 10 studies.

References

    1. Pirkis J, Spittal MJ, Cox G, Robinson J, Cheung YTD, Studdert D. The effectiveness of structural interventions at suicide hotspots: a meta-analysis. Int J Epidemiol. 2013;42(2):541–8. doi: 10.1093/ije/dyt021. - DOI - PubMed
    1. Mann JJ, Apter A, Bertolote J, Beautrais A, Currier D, Haas A, et al. Suicide prevention strategies: a systematic review. JAMA. 2005;294(16):2064–074. doi: 10.1001/jama.294.16.2064. - DOI - PubMed
    1. Hasselblad VV, McCrory DCD. Meta-analytic tools for medical decision making: a practical guide. Med Decis Making. 1994;15(1):81–96. doi: 10.1177/0272989X9501500112. - DOI - PubMed
    1. Bagos PG, Nikolopoulos GK. Mixed-effects Poisson regression models for meta-analysis of follow-up studies with constant or varying durations. Int J Biostat. 2009;5(1):1–33. doi: 10.2202/1557-4679.1168. - DOI
    1. Guevara JP, Berlin JA, Wolf FM. Meta-analytic methods for pooling rates when follow-up duration varies: a case study. BMC Med Res Methodol. 2004;4:17. doi: 10.1186/1471-2288年4月17日. - DOI - PMC - PubMed

LinkOut - more resources

Cite

AltStyle によって変換されたページ (->オリジナル) /