doi: 10.1021/acs.jmedchem.5b00104.
Epub 2015 Apr 22.
pkCSM: Predicting Small-Molecule Pharmacokinetic and Toxicity Properties Using Graph-Based Signatures
Affiliations
- PMID: 25860834
- PMCID: PMC4434528
- DOI: 10.1021/acs.jmedchem.5b00104
Item in Clipboard
pkCSM: Predicting Small-Molecule Pharmacokinetic and Toxicity Properties Using Graph-Based Signatures
Douglas E V Pires et al.
J Med Chem.
.
Display options
Format
Display options
Format
Abstract
Drug development has a high attrition rate, with poor pharmacokinetic and safety properties a significant hurdle. Computational approaches may help minimize these risks. We have developed a novel approach (pkCSM) which uses graph-based signatures to develop predictive models of central ADMET properties for drug development. pkCSM performs as well or better than current methods. A freely accessible web server (http://structure.bioc.cam.ac.uk/pkcsm), which retains no information submitted to it, provides an integrated platform to rapidly evaluate pharmacokinetic and toxicity properties.
Figures
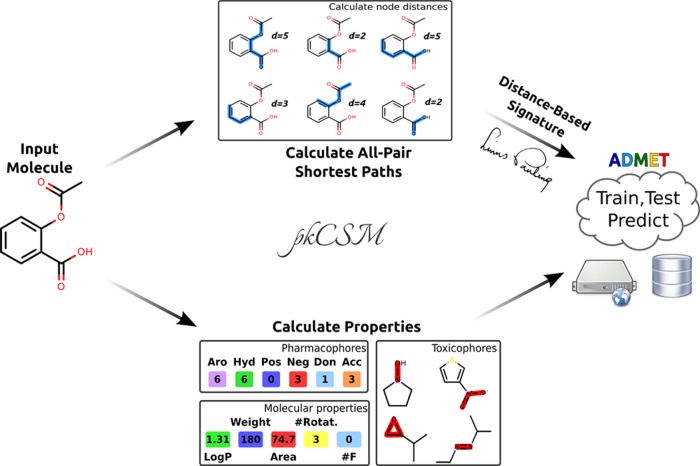
pkCSM workflow. Given an input molecule, two main sources of information
are used to train and test machine learning-based predictors: compound
general properties (including molecular properties, toxicophores and
pharmacophore) and distance-based graph signatures.
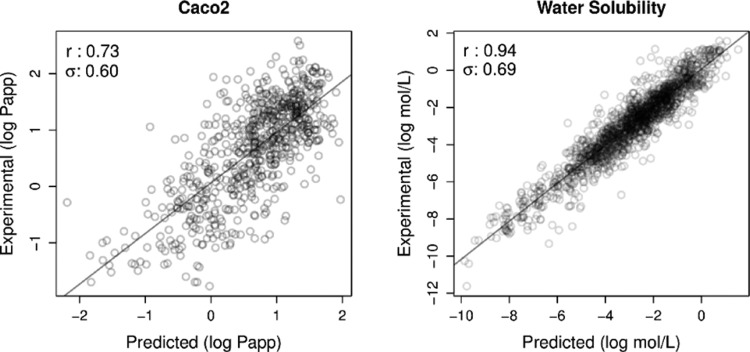
Regression analysis for absorption predictors considering
cross-validation
schemes. Pearson’s correlation coefficients and standard error
are also shown at the top-left corner. The left graph shows the correlation
between experimental and predicted values for Caco2 permeability,
while the graph on the right for water solubility.
References
-
- Kola I.; Landis J. Can the pharmaceutical industry reduce attrition rates?. Nature Rev. Drug Discovery 2004, 3, 711–715. - PubMed
-
- Merlot C. Computational toxicology—a tool for early safety evaluation. Drug Discovery Today 2010, 15, 16–22. - PubMed
-
- Eddershaw P. J.; Beresford A. P.; Bayliss M. K. ADME/PK as part of a rational approach to drug discovery. Drug Discovery Today 2000, 5, 409–414. - PubMed
-
- Li A. P. Screening for human ADME/Tox drug properties in drug discovery. Drug Discovery Today 2001, 6, 357–366. - PubMed
-
- Lin J.; Sahakian D. C.; de Morais S. M.; Xu J. J.; Polzer R. J.; Winter S. M. The role of absorption, distribution, metabolism, excretion and toxicity in drug discovery. Curr. Top. Med. Chem. 2003, 3, 1125–1154. - PubMed
Publication types
MeSH terms
Substances
Grants and funding
LinkOut - more resources
Full Text Sources
Other Literature Sources
Medical