This site needs JavaScript to work properly. Please enable it to take advantage of the complete set of features!
Skip to main page content
U.S. flag

An official website of the United States government

Dot gov

The .gov means it’s official.
Federal government websites often end in .gov or .mil. Before sharing sensitive information, make sure you’re on a federal government site.

Https

The site is secure.
The https:// ensures that you are connecting to the official website and that any information you provide is encrypted and transmitted securely.

NIH NLM Logo
Log in
Access keys NCBI Homepage MyNCBI Homepage Main Content Main Navigation
. 2015 Apr 1:6:6716.
doi: 10.1038/ncomms7716.

Brain metastatic cancer cells release microRNA-181c-containing extracellular vesicles capable of destructing blood-brain barrier

Affiliations

Brain metastatic cancer cells release microRNA-181c-containing extracellular vesicles capable of destructing blood-brain barrier

Naoomi Tominaga et al. Nat Commun. .

Abstract

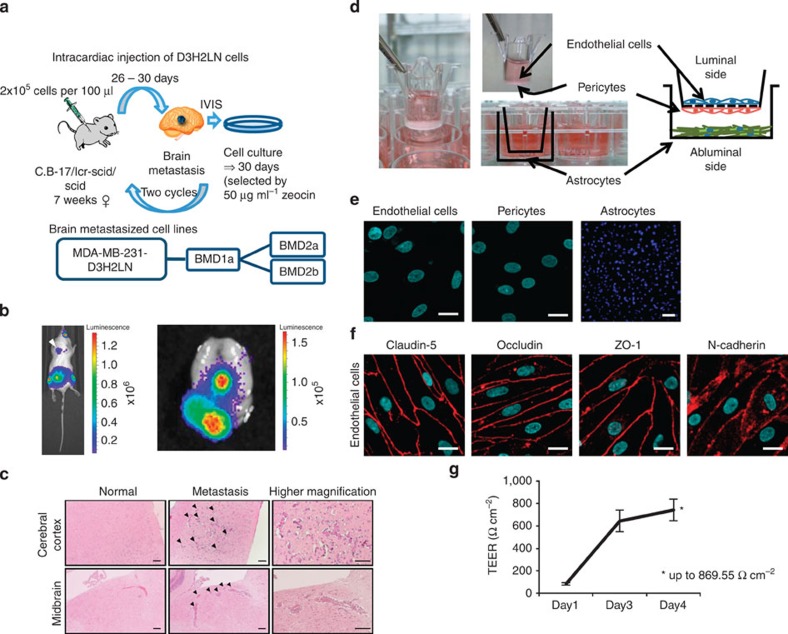
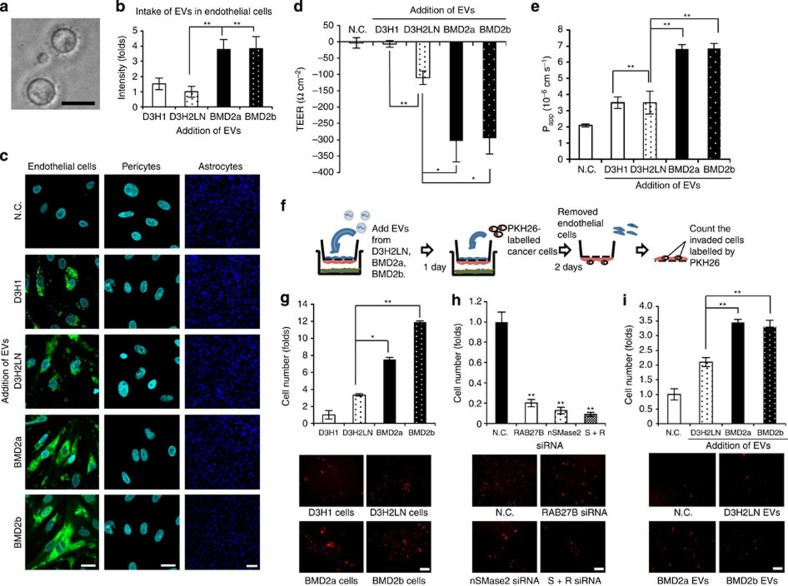
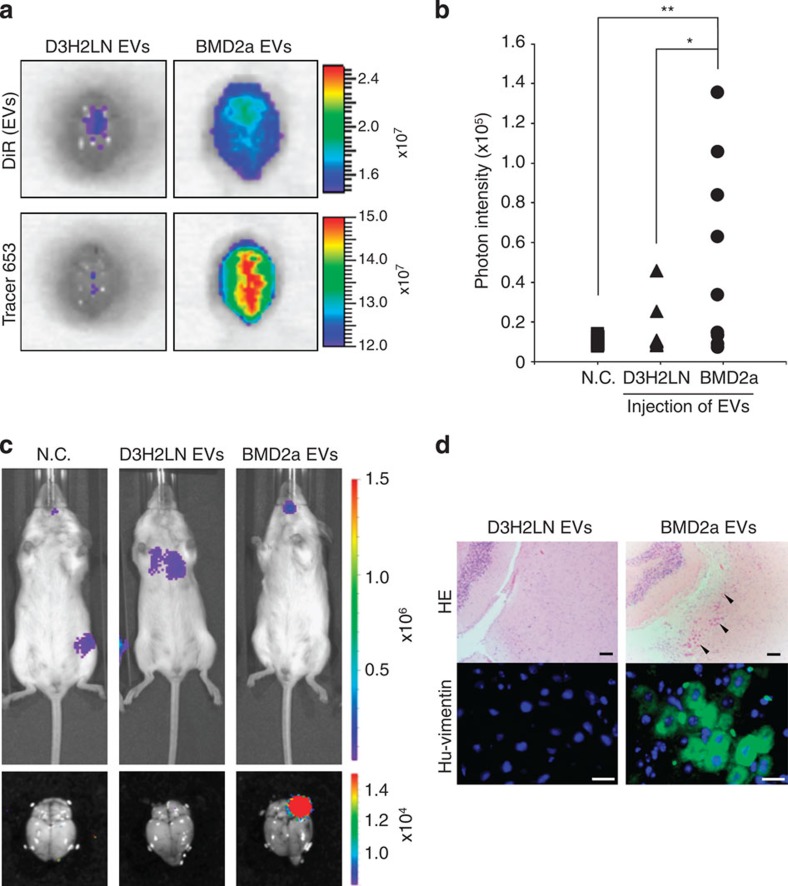
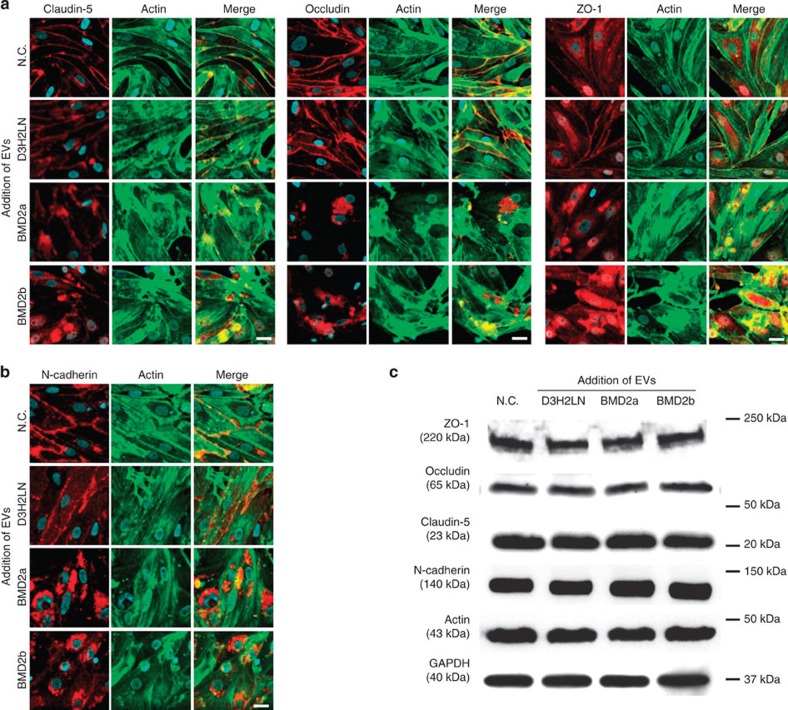
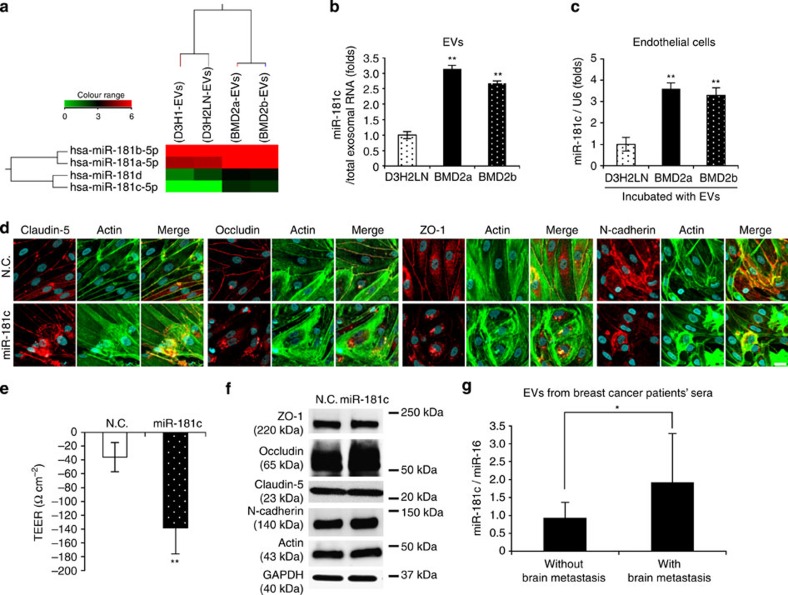
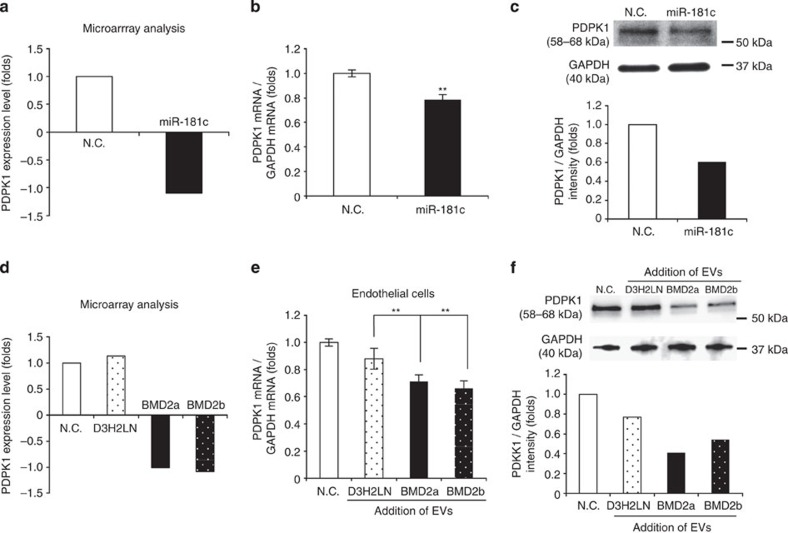
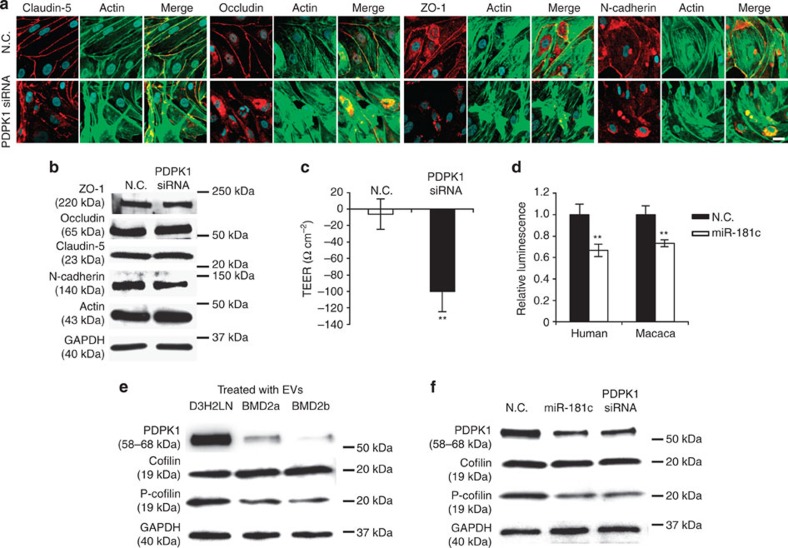
Brain metastasis is an important cause of mortality in breast cancer patients. A key event during brain metastasis is the migration of cancer cells through blood-brain barrier (BBB). However, the molecular mechanism behind the passage through this natural barrier remains unclear. Here we show that cancer-derived extracellular vesicles (EVs), mediators of cell-cell communication via delivery of proteins and microRNAs (miRNAs), trigger the breakdown of BBB. Importantly, miR-181c promotes the destruction of BBB through the abnormal localization of actin via the downregulation of its target gene, PDPK1. PDPK1 degradation by miR-181c leads to the downregulation of phosphorylated cofilin and the resultant activated cofilin-induced modulation of actin dynamics. Furthermore, we demonstrate that systemic injection of brain metastatic cancer cell-derived EVs promoted brain metastasis of breast cancer cell lines and are preferentially incorporated into the brain in vivo. Taken together, these results indicate a novel mechanism of brain metastasis mediated by EVs that triggers the destruction of BBB.


Figures

Figure 1
Figure 1. Establishment of brain metastasis breast cancer cell lines and BBB in vitro model.
(a) Schematic representation of the protocol for the in vivo-selected brain metastatic derivatives. MDA-MB-231-luc-D3H2LN breast cancer cell lines (2 ×ばつ 105 cells) were injected intracardially into C.B-17 Icr-scid scid mice. After 26–30 days, the brain metastasis of cancer cells was monitored by in vivo imaging system (IVIS). The brain-metastasized cancer cells were recovered and cultured for ~30 days in a culture medium containing 50 μg ml−1 Zeocin. This selection was performed twice, and we named the established cell lines BMD2a and BMD2b. (b) Bioluminescence image of a mouse with a BMD2a brain metastasis (left). Right image represents the bioluminescence image of a mouse brain with cancer cell metastasis. (c) Representative image of HE-stained sections from a mouse brain cerebral cortex and midbrain. Left upper and lower panels show the mouse cerebral cortex and midbrain, respectively, without metastasis of cancer cells. Middle upper and lower panels show the mouse cerebral cortex and midbrain, respectively, with metastasis of cancer cells. Arrow-head represent metastatic cancer cells. Right upper and lower panels show higher magnification. Scale bar, 100 μm. (d) The schematic representation of the in vitro model of BBB constructed from primary cultures of monkey brain capillary endothelial cells, brain pericytes and astrocytes. (e) Representative pictures of endothelial cells, pericytes and astrocytes are shown. Endothelial cells and pericytes were visualized using a confocal microscope. Astrocytes were visualized using a fluorescence microscope. Scale bar, 20 μm. Scale bar in the panel of astrocytes represents 100 μm. (f) Immunofluorescence of tight junction proteins (Claudin-5, Occludin and ZO-1) and N-cadherin (red). Scale bar, 20 μm. (g) The transition of TEER after thawing until the start of the experiment. After thawing the BBB in vitro model, the value of TEER increased to a maximum of 869.55 Ω cm−2 (*mean maximum TEER.). Error bars represent s.d., n=12. Data are representative of at least three independent experiments each. (Fig. e,f,g).
Figure 2
Figure 2. EVs from brain metastatic cancer cells were incorporated into endothelial cells, regulating the invasion through BBB of cancer cells.
(a) Phase-contrast electron microscopy was used to visualize resuspended EVs pellets. Scale bar, 100 nm. (b) The intensity of PKH67-labelled EVs was measured by ImageJ. Error bars represent s.d., Student’s t-test, n=3. (**P<0.01). (c) EVs isolated from cancer cells were labelled using PKH67 and added to the upper chamber. Representative pictures of endothelial cells, pericytes and astrocytes are shown. Negative control (N.C.), EVs from MDA-MB-231-luc-D3H2LN (D3H2LN), EVs from BMD2a and EVs from BMD2b are shown. Scale bar, 20 μm. Bar in the panel of astrocytes represents 100 μm. (d) The value of the TEER was monitored before (day 4) and after (day 5) the addition of EVs isolated from each cell line. EVs isolated from brain metastatic cancer cells were incubated in the in vitro BBB model for 24 h. Error bars represent s.d., Student’s t-test, n=3. (**P<0.01, *P<0.05). (e) Assessment of BBB permeability determined by NaF (molecular weight=376.27). EVs from MDA-MB-231-luc-D3H1 (D3H1), D3H2LN, BMD2a or BMD2b cells and N.C. were added to the in vitro BBB model. After 24 h, NaF was added. NaF that had passed through BBB was measured by a fluorometer. Error bars represent s.d., Student’s t-test, n=3. (**P<0.01). (f) PKH26-labelled cancer cells (2 ×ばつ 104 cells) were added to the in vitro BBB model. After a 48-h incubation, endothelial cells were removed, and the invading cells were counted using a fluorescence microscope. (g) In vitro BBB transmigration activity of D3H1, D3H2LN, BMD2a or BMD2b cells. The number of transmigrated cells relative to the D3H1 cell lines is plotted. Error bars represent s.d., Student’s t-test, n=3. (*P<0.05, **P<0.01). (h) In vitro BBB transmigration activity of the BMD2a treated with control siRNA (N.C.), RAB27B, nSMase2 and both siRNAs (S+R). The number of transmigrated cells relative to the control cells is plotted. Error bars represent s.d., Student’s t-test, n=3. (**P<0.01). (i) The number of transmigrated D3H1 cells relative to the control cells is plotted. Error bars represent s.d., Student’s t-test, n=3 (**P<0.01). Data are representative of at least three independent experiments each. (Fig. b,c,d,e,g,h,i).
Figure 3
Figure 3. Cancer-derived EVs promoted the brain metastasis of breast cancer cells.
(a) Fluorescence image of a mouse brain injected D3H2LN or BMD2a cell-derived EVs. The upper image represents the uptake DiR-labelled EVs of a mouse brain. The lower image represents the permeability of a mouse brain. D3H2LN cell-derived EVs were used as a control. This experiment was repeated twice. (b) Distribution of photon intensity in the brain, quantified by ImageJ analysis. P values were determined by Mann–Whitney one-tailed testing. Negative control (N.C.); n=9, D3H2LN; n=9, BMD2a; n=9. (*P<0.05, **P<0.01). (c) Bioluminescence image of D3H2LN and BMD2a cell-derived EVs and N.C.-injected mice. The upper image represents the bioluminescence whole-body image of mice. The lower image represents the bioluminescence image of a mouse brain with cancer cell metastasis. (d) Representative image of HE-stained sections from a mouse brain cerebral cortex (upper panels). The arrowhead shows the cancer cells. Scale bar, 100 μm. The lower panel shows a representative immunofluorescence image of anti-human vimentin (Hu-vimentin). Scale bar, 20 μm. Data are representative of at least three independent experiments each (Fig. d).
Figure 4
Figure 4. EVs from brain metastatic cancer cells promoted BBB breakdown.
(a) Co-immunofluorescence of tight junction proteins (Claudin-5, Occludin and ZO-1) (red) and actin filaments (green) after the addition of EVs from D3H2LN, BMD2a or BMD2b cells. Scale bar, 20 μm. (b) Co-immunofluorescence of N-cadherin (red) and actin filaments (green) after the addition of EVs from D3H2LN, BMD2a or BMD2b cells. Scale bar, 20 μm. (c) Western blot analysis of tight junction proteins, N-cadherin, Actin and GAPDH. Proteins from endothelial cells treated with negative control (N.C.) or EVs. This experiment was repeated twice. Data are representative of at least three independent experiments each (Fig. a,b).
Figure 5
Figure 5. miR-181c played a role in BBB breakdown and upregulation in brain metastasis patients’ sera.
(a) Heat map showing expression levels of the miR-181c in cancer-derived EVs. (b) Amount of miR-181c in EVs isolated from D3H2LN, BMD2a and BMD2b cells. Error bars represent s.d., Student’s t-test, n=3. **P<0.01 as compared with EVs from D3H2LN cells. (c) Endothelial cells were incubated with EVs isolated from D3H2LN, BMD2a or BMD2b cells for 24 h. RNA was isolated from the endothelial cells 24 h after the addition of EVs, and the expression of miR-181c in the endothelial cells was analysed by qRT-PCR. Each bar represents the mean s.d., Student’s t-test, n=3. **P<0.01 as compared with endothelial cells treated with EVs from D3H2LN cells. (d) Co-immunostaining of Claudin-5, Occludin, ZO-1, N-cadherin (red) and actin filaments (green) in endothelial cells after the addition of EVs from D3H2LN, BMD2a or BMD2b cells. Scale bar, 20 μm. These proteins localized to the cytoplasm in miR-181c-transfected cells. (e) The TEER value was monitored before (day 4) and after (day 5) the transfection of miR-181c or control siRNA. Transfected miR-181c or N.C. siRNA was incubated in the in vitro BBB model for 24 h. Error bars represent s.d., Student’s t-test, n=3. (**P<0.01). (f) Western blot analysis of tight junction proteins, N-cadherin, actin and GAPDH. Proteins were from endothelial cells transfected with N.C. siRNA or miR-181c. This experiment was repeated twice. (g) Amount of miR-181c in EVs isolated from patients’ sera. Non-brain metastasis: n=46, brain metastasis: n=10 (*P<0.05). Associations between the miR-181c expression levels of serum from breast cancer patients were assessed by Student's t-test. Data are representative of at least three independent experiments each (Fig. b,c,d,e).
Figure 6
Figure 6. miR-181c regulates PDPK1 expression in brain endothelial cells.
(a) Microarray analysis showing the expression levels of PDPK1 in brain endothelial cells after transfection of miR-181c. The data are represented as log2 value. (b) Expression level of PDPK1 mRNA in brain endothelial cells after the transfection of miR-181c. Error bars represent s.d., Student’s t-test, n=3. (**P<0.01). (c) Western blot analysis of PDPK1 and GAPDH. Proteins were from brain endothelial cells transfected with miR-181c. The lower panel shows the intensity of PDPK1 obtained from the transfection of N.C. siRNA or miR-181c. This experiment was repeated twice. (d) Microarray analysis showing the expression levels of PDPK1 in brain endothelial cells after EV treatment. (e) Expression level of PDPK1 mRNA in brain endothelial cells after the addition of EVs from D3H2LN, BMD2a or BMD2b cells. Error bars represent s.d., Student’s t-test, n=3 (**P<0.01). (f) Western blot analysis of PDPK1 and GAPDH. Proteins were from endothelial cells treated with EVs from D3H2LN, BMD2a or BMD2b cells. The lower panel shows the intensity of PDPK1 obtained from D3H2LN, BMD2a or BMD2b cells. This experiment was repeated twice. Data are representative of at least three independent experiments each (Fig. b,e).
Figure 7
Figure 7. The target of miR-181c, PDPK1, in endothelial cells regulates the localization of tight junction proteins, N-cadherin and actin.
(a) Co-immunofluorescence of tight junction proteins (Claudin-5, Occludin and ZO-1), N-cadherin (red) and actin filament (green) after the addition of EVs from D3H2LN, BMD2a or BMD2b cells. Scale bar. 20 μm. (b) Western blot analysis of tight junction proteins, N-cadherin, actin and GAPDH. Proteins were from brain endothelial cells treated with PDPK1 siRNA. This experiment was repeated twice. (c) The TEER value was monitored before (day 4) and after (day 5) the transfection of PDPK1 siRNA or negative control. Error bars represent s.d., Student’s t-test, n=3 (*P<0.01). (d) Luciferase activities measured by cotransfecting miR-181c and the PDPK1 luciferase reporters. Error bars represent s.d., Student’s t-test, n=6 (**P<0.01). (e) Western blot analysis of PDPK1, cofilin, phospho-cofilin (P-cofilin) and GAPDH. Proteins were from brain endothelial cells treated with EVs from D3H2LN, BMD2a or BMD2b cells. This experiment was repeated twice. (f) Western blot analysis of PDPK1, phospho-cofilin (P-cofilin), cofilin and GAPDH. Proteins were from brain endothelial cells treated with miR-181c or PDPK1 siRNA. This experiment was repeated twice. Data are representative of at least three independent experiments each (Fig. a,c,d).

References

    1. Arshad F., Wang L., Sy C., Avraham S. & Avraham H. K. Blood-brain barrier integrity and breast cancer metastasis to the brain. Patholog. Res. Int. 2011, 920509 (2010) . - PMC - PubMed
    1. Bos P. D., Nguyen D. X. & Massagué J. Modeling metastasis in the mouse. Curr. Opin. Pharmacol. 10, 571–577 (2010) . - PMC - PubMed
    1. Winkler E. A., Bell R. D. & Zlokovic B. V. Central nervous system pericytes in health and disease. Nat. Neurosci. 14, 1398–1405 (2011) . - PMC - PubMed
    1. Ballabh P., Braun A. & Nedergaard M. The blood-brain barrier: an overview: structure, regulation, and clinical implications. Neurobiol. Dis. 16, 1–13 (2004) . - PubMed
    1. Lee T. H., Avraham H. K., Jiang S. & Avraham S. Vascular endothelial growth factor modulates the transendothelial migration of MDA-MB-231 breast cancer cells through regulation of brain microvascular endothelial cell permeability. J. Biol. Chem. 278, 5277–5284 (2003) . - PubMed

Publication types

MeSH terms

Associated data

Cite

AltStyle によって変換されたページ (->オリジナル) /