This site needs JavaScript to work properly. Please enable it to take advantage of the complete set of features!
Skip to main page content
U.S. flag

An official website of the United States government

Dot gov

The .gov means it’s official.
Federal government websites often end in .gov or .mil. Before sharing sensitive information, make sure you’re on a federal government site.

Https

The site is secure.
The https:// ensures that you are connecting to the official website and that any information you provide is encrypted and transmitted securely.

NIH NLM Logo
Log in
Access keys NCBI Homepage MyNCBI Homepage Main Content Main Navigation
. 2015 Mar 24;9(3):e0003611.
doi: 10.1371/journal.pntd.0003611. eCollection 2015 Mar.

Signatures of adaptation in human invasive Salmonella Typhimurium ST313 populations from sub-Saharan Africa

Affiliations

Signatures of adaptation in human invasive Salmonella Typhimurium ST313 populations from sub-Saharan Africa

Chinyere K Okoro et al. PLoS Negl Trop Dis. .

Erratum in

Abstract

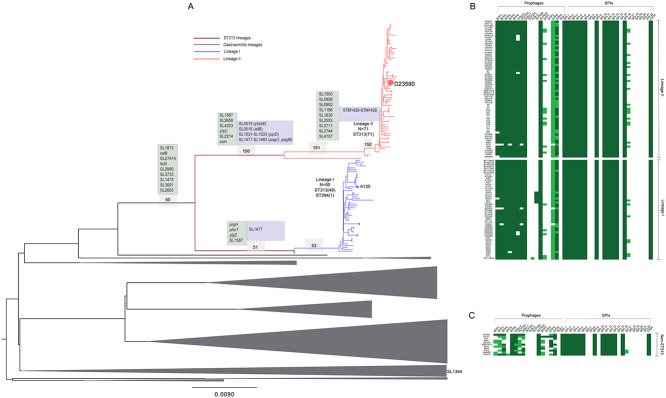
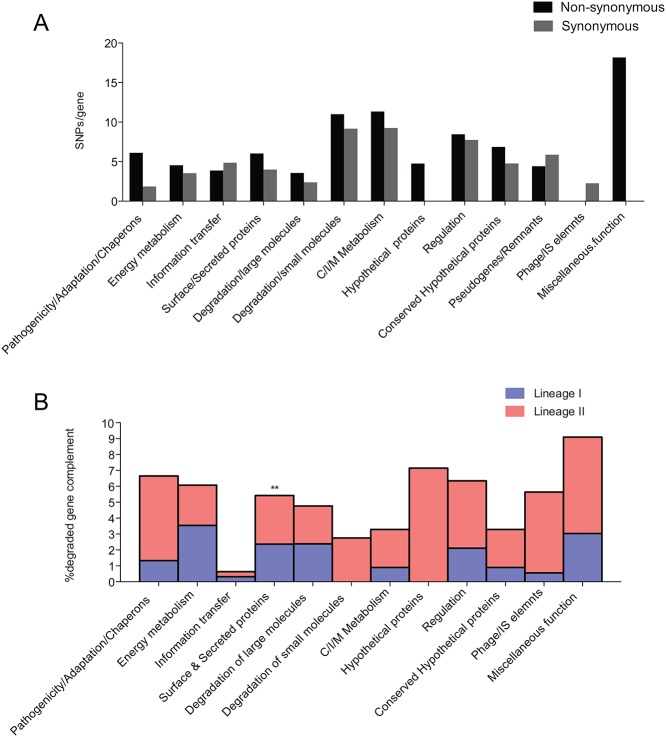
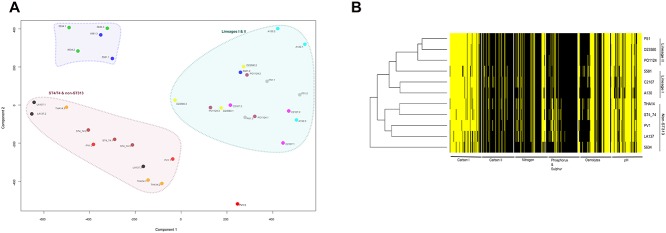
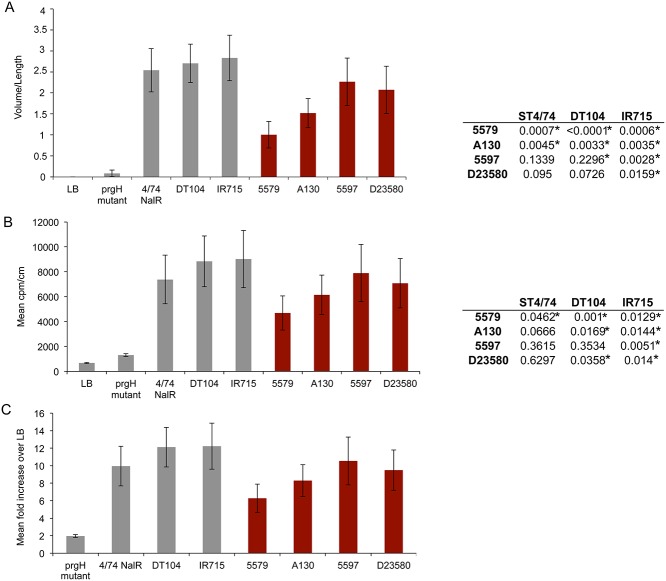
Two lineages of Salmonella enterica serovar Typhimurium (S. Typhimurium) of multi-locus sequence type ST313 have been linked with the emergence of invasive Salmonella disease across sub-Saharan Africa. The expansion of these lineages has a temporal association with the HIV pandemic and antibiotic usage. We analysed the whole genome sequence of 129 ST313 isolates representative of the two lineages and found evidence of lineage-specific genome degradation, with some similarities to that observed in S. Typhi. Individual ST313 S. Typhimurium isolates exhibit a distinct metabolic signature and modified enteropathogenesis in both a murine and cattle model of colitis, compared to S. Typhimurium outside of the ST313 lineages. These data define phenotypes that distinguish ST313 isolates from other S. Typhimurium and may represent adaptation to a distinct pathogenesis and lifestyle linked to an-immuno-compromised human population.


Conflict of interest statement

The authors have declared that no competing interests exist.

Figures

Fig 1
Fig 1. Characterisation and distribution of SNPs in ST313 lineage I and lineage II.
A. Unrooted maximum likelihood tree showing relationships between lineage I (blue), lineage II (red) and gastroenteritis-associated isolates (grey polygons). Size of polygons represents numbers of taxa in the clade. Representative isolates from each group are highlighted within each clade. Scale bar indicates substitutions per variable site. Numbers in light grey boxes indicate parental branches leading to the respective ST313 lineages as shown in Table 1. Text boxes indicate selected degraded genes (pseudogenes—light green and deletions—light blue occurring on the respective branches). Re-used with permission from Okoro et al., Nat Genet. 2012. 44(11): 1215–21. doi: 10.1038/ng.2423. List of degraded complement for strain D23580 is adapted from Kingsley et al., 2009. B. Distribution of prophage elements and Salmonella pathogenicity islands in ST313 lineage I and II. Top left panel represents concatenated phage sequences from strains D23580 (‘BTP’), SL1344 (‘SL’) and DT104 (‘DT’). Top right panel represents concatenated sequences of coding and non-coding sequences of SPI-1 to SPI-22 and CSS4 island. Sequence reads mapping to the complete feature length is represented as a heatmap. Green colour indicates >90% (high) coverage; light green indicates >30% but <90% coverage; and white indicates <30% (low) coverage. Isolate order in lineages I and II on left hand panel although not to scale, is according to phylogenetic positioning in 1A. C Distribution of phages and SPIs in selected non-ST313 isolates.
Fig 2
Fig 2. Functional characterisation of SNPs, pseudogenes and small indels in ST313 populations.
A. Functional characterisation of non-synonymous (black bars) and synonymous (grey bars) of SNPs in lineages I and II. x-axis shows functional categories used for SNP characterisations; y-axis shows proportion of mutated genes (%) to the no of genes belonging to the functional categories. B. Functional characterisation of degraded gene complement (pseudogenes and deletions) in lineage I (blue bars) and lineage II (red bars). x-axis represents % proportion of pseudogenes in each functional group. Asterisks indicate significantly over-represented group with p < 0.05 using a two-way ANOVA with post-tests performed using the Bonferroni method.
Fig 3
Fig 3. Metabolic profile of ST313 lineage I and lineage II isolates.
A. Principal component analyses of experiments on isolates and replicates used for 576 metabolic and physiological tests. The axes represent the two principal components (components 1 and 2) that explain the largest amounts of variation observed. Large coloured polygons represent identified clusters as labelled. Replicates of isolates sharing the same polygon colour are labelled with the name of isolates with number suffixes indicating replicate numbers. B. Representation of active (yellow) and non-active (black) wells. Varying shades of grey represent ambiguous (possibly active) results.
Fig 4
Fig 4. Histopathological analysis of Salmonella induced caecal inflammation of streptomycin-pre-treated mice.
A single representative caecal wall image from each group is shown. A. naïve uninfected mouse. B. Infection with SL1344ΔorgA (SPI-1 mutant derivative). C & D. Infection with SL1344. E. Infection with A130 (lineage 1); F. Infection with D23580 (lineage II). Images A, C, D, E & F were taken at x100 magnification of original size (image B is x50 magnification). Abbreviations: l, intestinal lumen; sm, submucosa; oe, submucosal oedema; pmn (polymorphonuclear leukocytes) infiltrate; sc, surface changes; ca, crypt abcesses. Histopathology score of inflammatory changes in the caecum of streptomycin pretreated C57bl/6 mice (G) or 129P2/olaHsd mice (H) with ST313 isolates or strain SL1344, two or three days post inoculation. The scores of five inflammatory markers according to the key are indicated.
Fig 5
Fig 5. Secretory and inflammatory responses induced by ST19 (grey bars) and ST313 S. Typhimurium strains (maroon bars) in bovine ligated ileal loops.
A. Mean fluid accumulation normalised to loop length [volume (mL)/length (cm)]. B. Influx of 111In-labelled PMN for test strains normalized to loop length and negative control loops, as described in Methods. Values represent the mean ± SEM of triplicate determinations in two independent calves. Right panel of A and B shows summary of paired T-test results. Asterisks show statistically significant pairwise comparisons. C. Influx of 111Indium oxinate-labelled polymorphonuclear leukocytes (PMN) induced by ST313 isolates relative to the negative control.

References

    1. Popoff MY, Bockemuhl J, Gheesling LL (2004) Supplement 2002 (no. 46) to the Kauffmann-White scheme. Research in microbiology 155: 568–570. - PubMed
    1. Langridge GC, Nair S, Wain J (2009) Nontyphoidal Salmonella serovars cause different degrees of invasive disease globally. The Journal of infectious diseases 199: 602–603. 10.1086/596208 - DOI - PubMed
    1. Graham SM (2010) Nontyphoidal salmonellosis in Africa. Current opinion in infectious diseases 23: 409–414. 10.1097/QCO.0b013e32833dd25d - DOI - PubMed
    1. Berkley JA, Bejon P, Mwangi T, Gwer S, Maitland K, et al. (2009) HIV infection, malnutrition, and invasive bacterial infection among children with severe malaria. Clinical infectious diseases: an official publication of the Infectious Diseases Society of America 49: 336–343. - PMC - PubMed
    1. Kingsley RA, Msefula CL, Thomson NR, Kariuki S, Holt KE, et al. (2009) Epidemic multiple drug resistant Salmonella Typhimurium causing invasive disease in sub-Saharan Africa have a distinct genotype. Genome research 19: 2279–2287. 10.1101/gr.091017.109 - DOI - PMC - PubMed

Publication types

MeSH terms

Cite

AltStyle によって変換されたページ (->オリジナル) /