Spatio-temporal patterns and landscape-associated risk of Buruli ulcer in Akonolinga, Cameroon
- PMID: 25188464
- PMCID: PMC4154661
- DOI: 10.1371/journal.pntd.0003123
Spatio-temporal patterns and landscape-associated risk of Buruli ulcer in Akonolinga, Cameroon
Abstract
Background: Buruli ulcer (BU) is an extensively damaging skin infection caused by Mycobacterium ulcerans, whose transmission mode is still unknown. The focal distribution of BU and the absence of interpersonal transmission suggest a major role of environmental factors, which remain unidentified. This study provides the first description of the spatio-temporal variations of BU in an endemic African region, in Akonolinga, Cameroon. We quantify landscape-associated risk of BU, and reveal local patterns of endemicity.
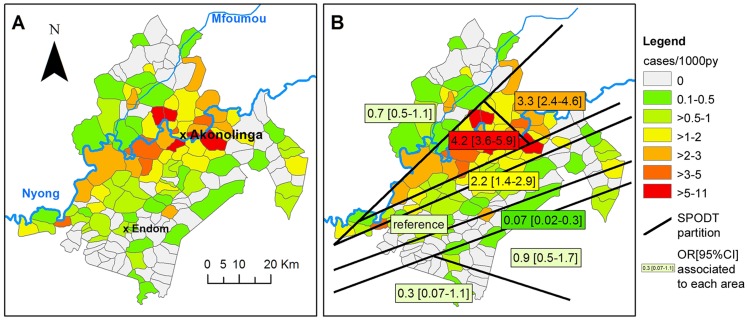
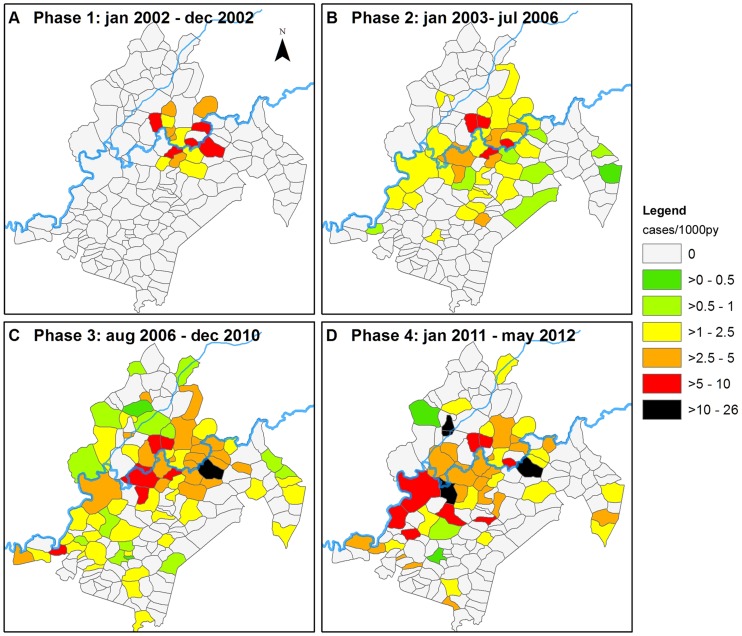
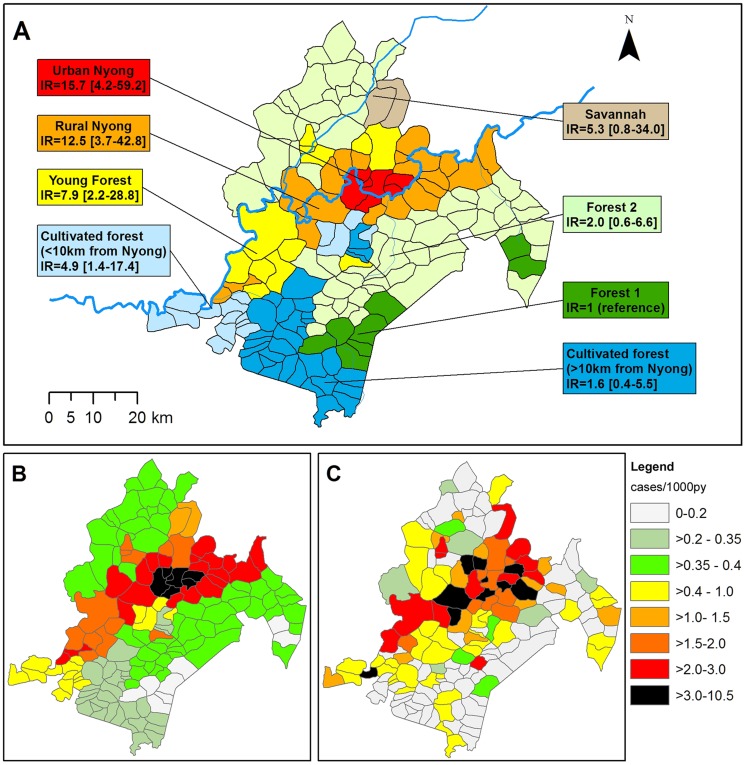
Methodology/principal findings: From January 2002 to May 2012, 787 new BU cases were recorded in 154 villages of the district of Akonolinga. Incidence per village ranged from 0 (n = 59 villages) to 10.4 cases/1000 person.years (py); median incidence was 0.4 cases/1,000 py. Villages neighbouring the Nyong River flood plain near Akonolinga town were identified as the highest risk zone using the SPODT algorithm. We found a decreasing risk with increasing distance to the Nyong and identified 4 time phases with changes in spatial distribution. We classified the villages into 8 groups according to landscape characteristics using principal component analysis and hierarchical clustering. We estimated the incidence ratio (IR) associated with each landscape using a generalised linear model. BU risk was highest in landscapes with abundant wetlands, especially cultivated ones (IR = 15.7, 95% confidence interval [95%CI] = 15.7[4.2-59.2]), and lowest in reference landscape where primary and secondary forest cover was abundant. In intermediate-risk landscapes, risk decreased with agriculture pressure (from IR[95%CI] = 7.9[2.2-28.8] to 2.0[0.6-6.6]). We identified landscapes where endemicity was stable and landscapes where incidence increased with time.
Conclusion/significance: Our study on the largest series of BU cases recorded in a single endemic region illustrates the local evolution of BU and identifies the Nyong River as the major driver of BU incidence. Local differences along the river are explained by wetland abundance and human modification of the environment.
Conflict of interest statement
The authors have declared that no competing interests exist.
Figures
References
-
- World Health Organisation - Global Buruli Ulcer Initiative Meeting (2012) Buruli ulcer control and research: Summary Data. Available: http://www.who.int/buruli/Summary_data_and_new_target_2013.pdf. Accessed 12 December 2013.
Publication types
MeSH terms
LinkOut - more resources
Full Text Sources
Other Literature Sources