This site needs JavaScript to work properly. Please enable it to take advantage of the complete set of features!
Skip to main page content
U.S. flag

An official website of the United States government

Dot gov

The .gov means it’s official.
Federal government websites often end in .gov or .mil. Before sharing sensitive information, make sure you’re on a federal government site.

Https

The site is secure.
The https:// ensures that you are connecting to the official website and that any information you provide is encrypted and transmitted securely.

NIH NLM Logo
Log in
Access keys NCBI Homepage MyNCBI Homepage Main Content Main Navigation
. 2014 Aug 29;15(1):293.
doi: 10.1186/1471-2105-15-293.

jvenn: an interactive Venn diagram viewer

Affiliations

jvenn: an interactive Venn diagram viewer

Philippe Bardou et al. BMC Bioinformatics. .

Abstract

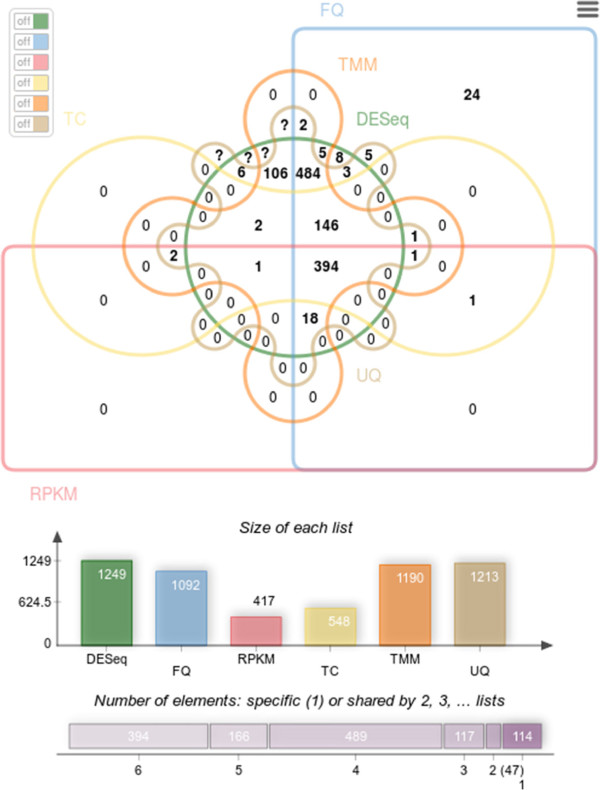
Background: Venn diagrams are commonly used to display list comparison. In biology, they are widely used to show the differences between gene lists originating from different differential analyses, for instance. They thus allow the comparison between different experimental conditions or between different methods. However, when the number of input lists exceeds four, the diagram becomes difficult to read. Alternative layouts and dynamic display features can improve its use and its readability.

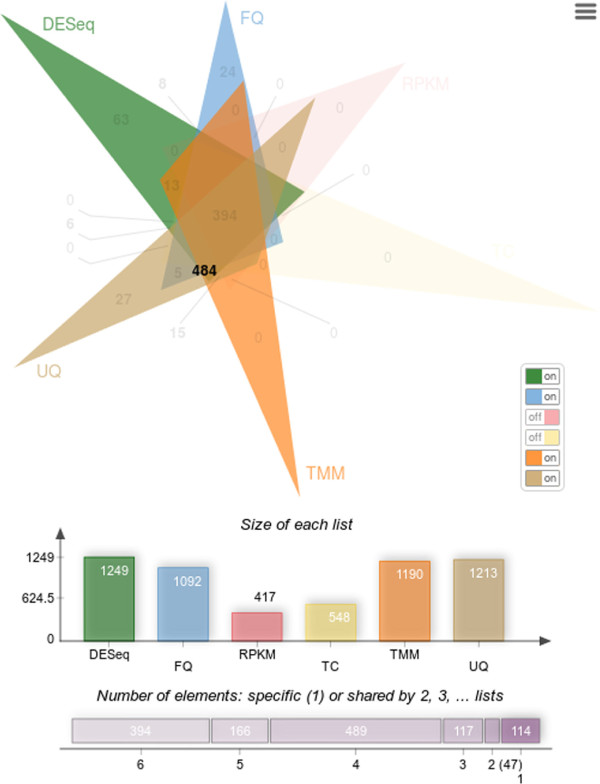
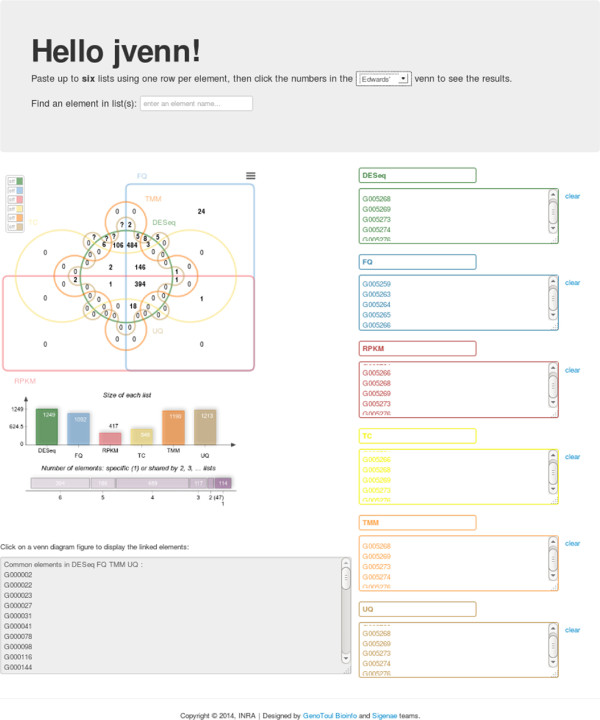
Results: jvenn is a new JavaScript library. It processes lists and produces Venn diagrams. It handles up to six input lists and presents results using classical or Edwards-Venn layouts. User interactions can be controlled and customized. Finally, jvenn can easily be embeded in a web page, allowing to have dynamic Venn diagrams.

Conclusions: jvenn is an open source component for web environments helping scientists to analyze their data. The library package, which comes with full documentation and an example, is freely available at http://bioinfo.genotoul.fr/jvenn.


Figures

Figure 1
Figure 1
A six lists Edwards-Venn diagram. This Venn diagram displays overlaps between six different biological samples. The icon, located on the top-right, allows users to download the diagram as a PNG file. The middle-right switch button panel allows to activate or dis-activate lists to access a specific intersection count. Charts showing the list size and intersection size repartition located underneath the diagram.
Figure 2
Figure 2
A six lists classic Venn diagram. On mouse over a figure, the shape corresponding to the lists involved in the intersection are highlighted and the other ones faded out. In this example, the user pointed the intersection between DESeq, FQ, UQ and TMM which contains 484 different genes.
Figure 3
Figure 3
jvenn web application. The running version of jvenn accessible at http://bioinfo.genotoul.fr/jvenn/example.html. This one allows the user to set all jvenn main features. The layout can be changed from classical to Edwards, a search box is accessible, the switch button panel and the exporting button are available and the statistical charts are displayed. On the right of the page, each of the six textareas can be filled with a list of elements (one per line). If the same item is given multiple times, this one will be considered as unique. The list labels can also be customized using the text field on the top of each textarea.

References

    1. Venn J. On the diagrammatic and mechanical representation of propositions and reasonings. Philos Mag J Sci. 1880;9:1–18. doi: 10.1080/14786448008626877. - DOI
    1. Edwards AWF. Cogwheels of the Mind: The Story of Venn Diagrams. Baltimore: Johns Hopkins University Press; 2004.
    1. Martin B, Chadwick W, Yi T, Park S-S, Lu D, Ni B, Gadkaree S, Farhang K, Becker KG, Maudsley S. Vennture-a novel venn diagram investigational tool for multiple pharmacological dataset analysis. PLoS ONE. 2012;7(5):e36911. doi: 10.1371/journal.pone.0036911. - DOI - PMC - PubMed
    1. Chen H. VennDiagram: Generate High-resolution Venn and Euler Plots. 2013.
    1. Hulsen T, de Vlieg J, Alkema W. Biovenn a web application for the comparison and visualization of biological lists using area-proportional venn diagrams. BMC Genomics. 2008;9:488. doi: 10.1186/1471-2164-9-488. - DOI - PMC - PubMed

LinkOut - more resources

Cite

AltStyle によって変換されたページ (->オリジナル) /