This site needs JavaScript to work properly. Please enable it to take advantage of the complete set of features!
Skip to main page content
U.S. flag

An official website of the United States government

Dot gov

The .gov means it’s official.
Federal government websites often end in .gov or .mil. Before sharing sensitive information, make sure you’re on a federal government site.

Https

The site is secure.
The https:// ensures that you are connecting to the official website and that any information you provide is encrypted and transmitted securely.

NIH NLM Logo
Log in
Access keys NCBI Homepage MyNCBI Homepage Main Content Main Navigation
. 2014 Oct 15;127(Pt 20):4396-408.
doi: 10.1242/jcs.148098. Epub 2014 Aug 8.

CFTR interacts with ZO-1 to regulate tight junction assembly and epithelial differentiation through the ZONAB pathway

Affiliations

CFTR interacts with ZO-1 to regulate tight junction assembly and epithelial differentiation through the ZONAB pathway

Ye Chun Ruan et al. J Cell Sci. .

Abstract

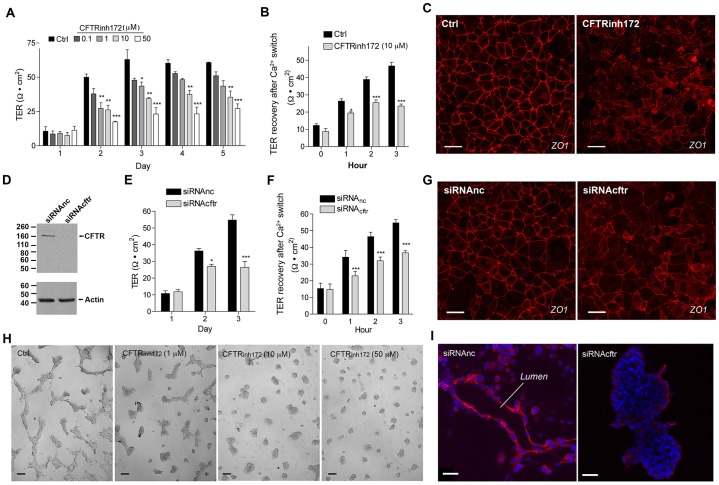
Mutations in CFTR lead to dysfunction of tubular organs, which is currently attributed to impairment of its conductive properties. We now show that CFTR regulates tight junction assembly and epithelial cell differentiation through modulation of the ZO-1-ZONAB pathway. CFTR colocalizes with ZO-1 at the tight junctions of trachea and epididymis, and is expressed before ZO-1 in Wolffian ducts. CFTR interacts with ZO-1 through the CTFR PDZ-binding domain. In a three-dimensional (3D) epithelial cell culture model, CFTR regulates tight junction assembly and is required for tubulogenesis. CFTR inhibition or knockdown reduces ZO-1 expression and induces the translocation of the transcription factor ZONAB (also known as YBX3) from tight junctions to the nucleus, followed by upregulation of the transcription of CCND1 and downregulation of ErbB2 transcription. The epididymal tubules of cftr(-/-) and cftr(ΔF508) mice have reduced ZO-1 levels, increased ZONAB nuclear expression, and decreased epithelial cell differentiation, illustrated by the reduced expression of apical AQP9 and V-ATPase. This study provides a new paradigm for the etiology of diseases associated with CFTR mutations, including cystic fibrosis.

Keywords: CFTR; Embryonic development; Epithelial remodeling; Male fertility; Morphogenesis; Proliferation; ZO-1; ZONAB.


Figures

Fig. 1.
Fig. 1.
CFTR is located at tight junctions and interacts with ZO-1 through its PDZ-binding domain. (Aa) Immunofluorescent labeling of CFTR in the proximal mouse epididymis. IS, initial segment; ED, efferent duct; CT, caput; CPS, corpus. (Ab) CFTR labeling (green) in apical epithelial cell–cell junctions in the initial segment. The inset shows a higher magnification view of the area outlined in white. (Ac) Pre-incubation of the CFTR antibody with the immunizing peptide prevents immunofluorescent labeling of CFTR. (Ba–c) Confocal laser scanning microscope images showing colocalization of CFTR (green) and ZO-1 (red) at tight junctions in the initial segment. Arrowheads, localization of CFTR in the apical membrane; arrows, absence of CFTR from the lateral membrane. (Bd–f) Higher magnification images of the regions delineated in the boxes in the left panels. Colocalization is indicated by the yellow/orange labeling in the merge panels (Bc,f). (Ca–c) Confocal laser scanning microscopy images showing colocalization of CFTR (green) and ZO-1 (red) at tight junctions of DC2 cells. Apical and intracellular CFTR labeling is also detected. (Cd–f) Pre-incubation of the CFTR antibody with the immunizing peptide prevents immunofluorescent labeling of CFTR. Nuclei are labeled in blue with DAPI (A) or Topro-3 (C). Scale bars: 300 μm (Aa); 10 μm (Ab,c, Ba–c); 2.5 μm (Bd–f); 5 μm (C). (D) Immunoprecipitation (IP) of CFTR with ZO-1 in mouse epididymal (epid) protein extracts. (E) Immunoprecipitation of CFTR with ZO-1 in DC2 protein extracts. Ctrl, Protein-A-conjugated beads alone; Tot, total protein extracts. (F) Immunoprecipitation of ZO-1 with CFTR from DC2 protein extracts. (G) Left, western blot of CHO cells transfected with wild-type human CFTR (hCFTRwt) and human CFTR lacking the last four amino acids (DTRL) (hCFTRΔpdzb). WT-CHO, non-transfected cells; Vector, cells transfected with an empty vector. Non-specific lower-molecular-mass bands were also detected using this antibody. Middle, the protein amount used for co-immunoprecipitation assays (IP input) was adjusted to obtain similar levels of hCFTRwt and hCFTRΔpdzb. Right, co-immunoprecipitation of wild-type human CFTR (hCFTRwt) and mutant (hCFTRΔpdzb) with ZO-1. IP: Ctrl, beads alone.
Fig. 2.
Fig. 2.
CFTR deficiency impairs tight junction assembly and reassembly, and prevents tubulogenesis in DC2 cells. (A) TER in DC2 cultures treated with CFTRinh172 (0.1–50 μM) or DMSO (Ctrl) at 2, 3, 4 and 5 days after seeding (n = 9). (B) DC2 confluent cultures were incubated in low-Ca2+ medium, and TER was measured every hour after switching the medium back to normal Ca2+ in the presence of CFTRinh172 (10 μM) or DMSO (Ctrl) (n = 9). (C) ZO-1 labeling (red) in DC2 cultures 24 hours after the Ca2+ switch experiment in the presence of DMSO (Ctrl; left) or 10 μM CFTRinh172 (right). (D) Immunoblotting for CFTR in DC2 cells transfected for 3 days with CFTR-specific siRNAs (siRNAcftr) and cells transfected with non-silencing siRNAs as a negative control (siRNAnc) (upper panel). The same membrane was re-blotted for actin (lower panel). (E) TER in siRNAcftr- or siRNAnc-treated DC2 cells 1, 2 and 3 days after transfection and seeding (n = 9). (F) TER values 1, 2 and 3 hours after the Ca2+ switch experiment in cells treated with siRNAcftr compared with those treated with siRNAnc (n = 9). (G) ZO-1 labeling 3 hours after the Ca2+ switch experiment in DC2 cultures treated with siRNAcftr (right) or in control cells (siRNAnc; left). (H) Brightfield microscope images of DC2 cells cultured on a Matrigel layer under control conditions (Ctrl) or in the presence of CFTRinh172 (1, 10 and 50 μM). (I) Laser scanning confocal imaging for ZO-1 in control (siRNAnc-treated) DC2 cells (left) and siRNAcftr-treated cells (right). Nuclei are labeled in blue with Topro-3. 3D reconstruction animations can be seen in supplementary material Movies 1–4 (A,B,E,F) Data show the mean±s.e.m.; *P<0.05; **P<0.01; ***P<0.001 (by two-way ANOVA followed by Bonferroni's post hoc test). Scale bars: 20 μm (C,G,I); 50 μm (H).
Fig. 3.
Fig. 3.
CFTR regulates ZO-1 expression. (A) Left, immunoblotting for ZO-1 in DC2 cells treated for 3 days with CFTRinh172 (10 and 50 μM) and in control cells (DMSO). The same membrane was re-blotted for actin (lower panel). Right, quantification of ZO-1 expression normalized for actin in the presence of CFTRinh172 (10 and 50 μM) and in controls (DMSO). (B) Left, immunoblotting for ZO-1 in triplicates of control DC2 cells (siRNAnc) and after CFTR knockdown (siRNAcftr). The same membrane was re-blotted for CFTR (middle panel) and for actin (lower panel). Right, quantification of ZO-1 expression normalized to actin. (C) qPCR analysis of ZO-1 mRNA (normalized to GAPDH) in controls (siRNAnc) and after CFTR knockdown (siRNAcftr). (D) Immunoblotting for ZO-1 in duplicates of control cells (siRNAnc) or siRNAcftr-treated cells that were treated with either vehicle (DMSO), the proteasome inhibitor MG-132 or the lysosome inhibitor leupeptin for 6 hours (left, upper panel). The same membranes were re-blotted for actin (left, lower panel). Quantification of ZO-1 normalized to actin (right). (E) Immunoblotting for CFTR and ZO-1 in DC2 cells after co-transfection with either siRNAnc or siRNAcftr and plasmid encoding human ZO-1 (pZO-1) or an empty vector (pVector). (F) TER measured after the Ca2+ switch experiment in DC2 cells under control conditions (siRNAnc) and after CFTR knockdown (siRNAcftr), in the absence (pVector) and presence of human ZO-1 overexpression (pZO1). Quantitative data show the mean±s.e.m.; *P<0.05; **P<0.01; ***P<0.001; ns, non-significant (two-way ANOVA).
Fig. 4.
Fig. 4.
CFTR controls the ZO-1–ZONAB pathway. (A) Double-immunofluorescence labeling for ZONAB (green) and ZO-1 (red) in control DC2 cells (siRNAnc) and after CFTR knockdown (siRNAcftr). Scale bar: 10 μm. Left bar graph, quantification of linear ZONAB located at tight junctions; middle bar graph, quantification of cytosolic ZONAB fluorescence intensity; right bar graph, quantification of nuclear ZONAB fluorescence intensity. (B) Left, immunoblotting for ZONAB in nuclear extracts from DC2 cells transfected as described for Fig. 3E. The same membrane was re-blotted for TBP. Right, quantification of nuclear ZONAB normalized for TBP. (C) qPCR analysis of ErbB2, CCND1 and PCNA mRNA expression in DC2 cells under control (Ctrl) conditions and in the presence of CFTRinh172 (10 and 50 μM). Data are normalized to controls and GAPDH was used as control (n = 6). (D) qPCR analysis of ErbB2, CCND1 and PCNA mRNA expression in DC2 control cells (siRNAnc) and after CFTR knockdown (siRNAcftr). Data are normalized to controls and GAPDH was used as control (n = 9). (E) Proliferation activity of DC2 control cells (siRNAnc) and after CFTR knockdown (siRNAcftr), determined using the MTT assay. Quantitative data show the mean±s.e.m.; *P<0.05; **P<0.01; ***P<0.001; ns, non-significant versus control (C) or siRNAnc (A,D,E); unpaired Student's t-test (A,D), one-way ANOVA (B,C), two-way ANOVA followed by Bonferroni’s post hoc test (E).
Fig. 5.
Fig. 5.
CFTR and ZO-1 colocalization in the Wolffian duct. (A) CFTR immunofluorescence labeling (green) in mouse Wolffian duct and gonad at E13.5. Nuclei are labeled in blue with Topro-3. (B) Double-labeling for CFTR (green) and ZO-1 (red) in the proximal, middle and distal regions of the Wolffian duct delineated by the boxes in A. Scale bars: 100 μm (A); 10 μm (B).
Fig. 6.
Fig. 6.
Alteration of ZO-1 and ZONAB expression and developmental defects in CFTR-deficient mice. (A) Immunofluorescent labeling for ZO-1 (green) in the initial segments (IS) and cauda (CD) regions of the epididymis from cftr+/+ and cftr−/− mice. Nuclei are labeled in blue with DAPI. Scale bars: 20 μm. (B) Quantification of ZO-1 immunofluorescence showing a reduction in all regions of the epididymis in cftr−/− mice compared with cftr+/+ mice. CT, caput; CPS, corpus. Initial segment, n = 20; caput, n = 273; corpus, n = 417; cauda, n = 96 tubule segments. (C) Immunoblotting for ZO-1 in the epididymis of cftrΔF508 mice (DF508) and their wild-type (WT) littermates. The same membrane was re-blotted for actin. (D) ZONAB immunoblots of nuclear epididymal extracts from DF508 controls and their wild-type littermates. The membrane was re-blotted for histone. (E) H&E staining of epididymis sections from cftr+/+ and cftr−/− mice including the initial segment and caput, the corpus and the cauda regions. Scale bars: 250 μm. (F) The weight of epididymides in cftr+/+ mice and cftr−/− mice. Horizontal lines show the means. (G) Tubular diameter in the initial segment, caput, corpus and cauda of cftr−/− mice and cftr+/+ mice. (H) Epithelium height in the initial segment, caput, corpus and cauda of cftr+/+ and cftr−/− mice. (I) Double-immunofluorescence labeling of epididymis sections for AQP9 (green) and V-ATPase-B1 (red) in the initial segment and cauda of cftr+/+ and cftr−/− mice. Scale bars: 20 μm. Mean pixel intensity of AQP9 (J) and V-ATPase (K) immunofluorescence labeling in cftr+/+ and cftr−/− mice. Quantitative data show the mean±s.e.m.; *P<0.05; **P<0.01; ***P<0.001; ns, non-significant [unpaired Student's t-test (C,D,F), two-way ANOVA (B,G,H,J,K)]
Fig. 7.
Fig. 7.
CFTR and ZO-1 colocalization in the trachea. Laser scanning confocal imaging of mouse trachea double-labeled for CFTR (green) and ZO-1 (red), showing localization of CFTR at tight junctions. A weaker labeling for CFTR was also detected in the apical membrane. Arrows, colocalization of CFTR and ZO-1 at tight junctions. Scale bars: 20 μm (left); 5 μm (right).

References

    1. Anguiano A., Oates R. D., Amos J. A., Dean M., Gerrard B., Stewart C., Maher T. A., White M. B., Milunsky A. (1992). Congenital bilateral absence of the vas deferens. A primarily genital form of cystic fibrosis. JAMA 267, 1794–1797 10.1001/jama.1992.03480130110034 - DOI - PubMed
    1. Araki Y., Suzuki K., Matusik R. J., Obinata M., Orgebin-Crist M. C. (2002). Immortalized epididymal cell lines from transgenic mice overexpressing temperature-sensitive simian virus 40 large T-antigen gene. J. Androl. 23, 854–869 - PubMed
    1. Balda M. S., Matter K. (2000). The tight junction protein ZO-1 and an interacting transcription factor regulate ErbB-2 expression. EMBO J. 19, 2024–2033 10.1093/emboj/19.9.2024 - DOI - PMC - PubMed
    1. Balda M. S., Matter K. (2009). Tight junctions and the regulation of gene expression. Biochim. Biophys. Acta 1788, 761–767 10.1016/j.bbamem.2008年11月02日4 - DOI - PubMed
    1. Berdiev B. K., Qadri Y. J., Benos D. J. (2009). Assessment of the CFTR and ENaC association. Mol. Biosyst. 5, 123–127 10.1039/b810471a - DOI - PMC - PubMed

Publication types

MeSH terms

Cite

AltStyle によって変換されたページ (->オリジナル) /