This site needs JavaScript to work properly. Please enable it to take advantage of the complete set of features!
Skip to main page content
U.S. flag

An official website of the United States government

Dot gov

The .gov means it’s official.
Federal government websites often end in .gov or .mil. Before sharing sensitive information, make sure you’re on a federal government site.

Https

The site is secure.
The https:// ensures that you are connecting to the official website and that any information you provide is encrypted and transmitted securely.

NIH NLM Logo
Log in
Access keys NCBI Homepage MyNCBI Homepage Main Content Main Navigation
doi: 10.1038/srep04305.

Comparative Burkholderia pseudomallei natural history virulence studies using an aerosol murine model of infection

Affiliations

Comparative Burkholderia pseudomallei natural history virulence studies using an aerosol murine model of infection

Shane Massey et al. Sci Rep. .

Abstract

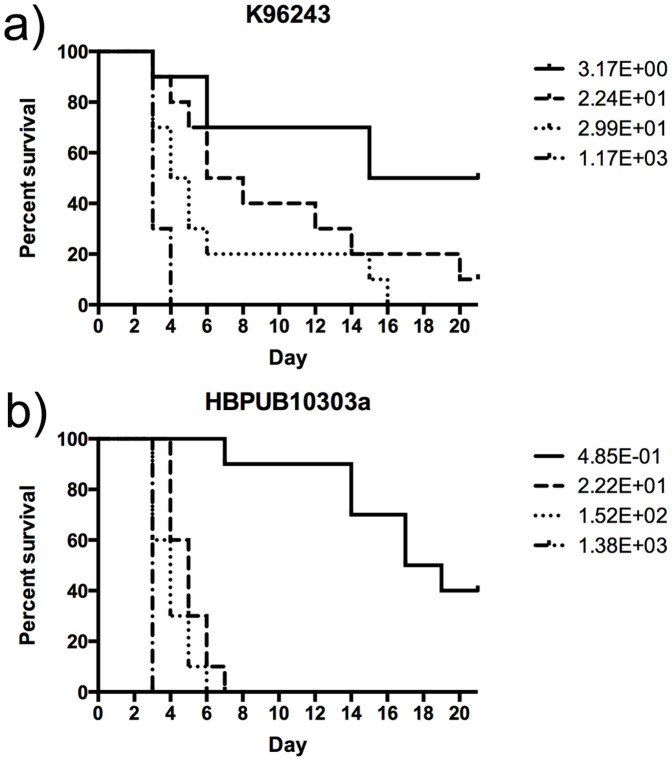
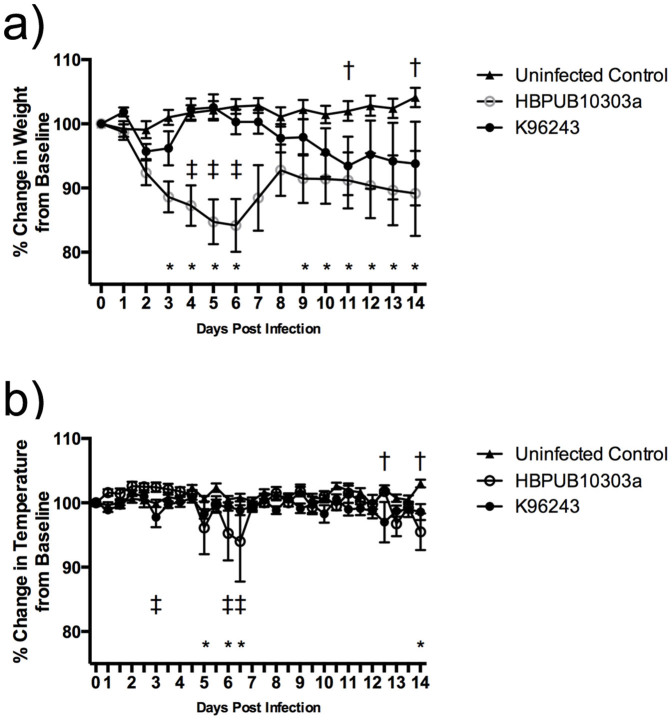
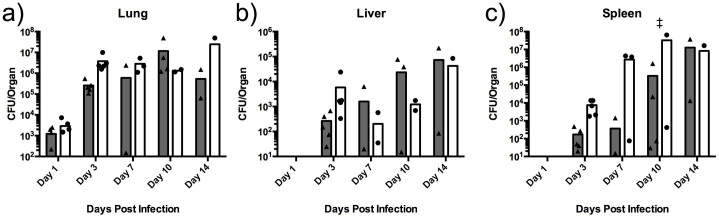
Melioidosis is an endemic disease caused by the bacterium Burkholderia pseudomallei. Concerns exist regarding B. pseudomallei use as a potential bio-threat agent causing persistent infections and typically manifesting as severe pneumonia capable of causing fatal bacteremia. Development of suitable therapeutics against melioidosis is complicated due to high degree of genetic and phenotypic variability among B. pseudomallei isolates and lack of data establishing commonly accepted strains for comparative studies. Further, the impact of strain variation on virulence, disease presentation, and mortality is not well understood. Therefore, this study evaluate and compare the virulence and disease progression of B. pseudomallei strains K96243 and HBPUB10303a, following aerosol challenge in a standardized BALB/c mouse model of infection. The natural history analysis of disease progression monitored conditions such as weight, body temperature, appearance, activity, bacteremia, organ and tissue colonization (pathological and histological analysis) and immunological responses. This study provides a detailed, direct comparison of infection with different B. pseudomallei strains and set up the basis for a standardized model useful to test different medical countermeasures against Burkholderia species. Further, this protocol serves as a guideline to standardize other bacterial aerosol models of infection or to define biomarkers of infectious processes caused by other intracellular pathogens.


Figures

Figure 1
Figure 1. LD50 analysis of B. pseudomallei strains.
BALB/c mice (n = 10) were infected, via aerosol delivery, with the indicated number of CFU for B. pseudomallei strains K96243 (a) and HBPUB10303a (b). Mice were monitored daily for signs and symptoms of disease. Survival data were analyzed by the Kaplan-Maier method and LD50 values were calculated by the method of Reed and Muench.
Figure 2
Figure 2. Average daily body weight and temperature.
Percent change in body weight (a) and temperature (b) of mice exposed to B. pseudomallei HBPUB10303a (open circles) or K96243 (closed circles). The symbols represent the mean value and the error bars represent the standard error of the mean. The asterisk (*) indicates significantly different values when comparing HBPUB10303a to the uninfected control animals (closed triangles), p < 0.05. The single cross (†) represents significantly different values when comparing K96243 to the uninfected controls, p < 0.05. The double cross (‡) indicates significantly different values when comparing HBPUB10303a to K96243, p < 0.05.
Figure 3
Figure 3. Bacterial burden.
Bacterial burden in the lung (a), liver (b) and spleen (c) of mice infected with HBPUB10303a (closed circles) or K96243 (closed triangles). The symbols represent individual animals. The bars indicate the mean CFU/organ for each group. The double cross (‡) indicates significantly different values when comparing HBPUB10303a to K96243, p < 0.05.
Figure 4
Figure 4. Blood chemistry and hematology.
Analysis of the alkaline phosphatase (a), albumin (b), globulin (c) and white blood cell count (d) in mice infected with HBPUB10303a (closed circles) or K96243 (closed triangles) compared to the uninfected control animals (dashed line). The symbols represent values of individual animals. The bars indicate the mean for each group and the dashed line represents mean for uninfected control animals. The asterisk (*) indicates significantly different values when comparing HBPUB10303a to the uninfected control animals, p < 0.05. The single cross (†) represents significantly different values when comparing K96243 to the uninfected controls, p < 0.05. The double cross (‡) indicates significantly different values when comparing HBPUB10303a to K96243, p < 0.05.
Figure 5
Figure 5. Blood serum chemokine/cytokine analysis.
Levels of individual chemokines/cytokines in plasma (pg/ml) of animals infected with HBPUB10303a (closed circles) or K96243 (closed triangles) compared to the uninfected control animals (dashed line). The symbols represent values of individual animals. The bars indicate the mean for each group and the dashed line represents the mean for uninfected control animals. The asterisk (*) indicates significantly different values when comparing HBPUB10303a to the uninfected control animals, p < 0.05. The single cross (†) represents significantly different values when comparing K96243 to the uninfected controls, p < 0.05. The double cross (‡) indicates significantly different values when comparing HBPUB10303a to K96243, p < 0.05.
Figure 6
Figure 6. Histopathology and scoring.
Representative images from (a) hematoxylin and eosin stained lungs, liver and spleen from mice infected with K96243 and HBPUB10303a at day 7 and uninfected controls. (b) Scores assigned for lung, liver and spleen tissue sections after microscopic examination. Bars represent mean ± SEM of animals infected with HBPUB10303a (white bars) or K96243 (gray bars) and the asterisk (*) indicates significantly different values when comparing HBPUB10303a to the uninfected control animals, p < 0.05. The single cross (†) represents significantly different values when comparing K96243 to the uninfected controls p < 0.05. The double cross (‡) indicates significantly different values when comparing HBPUB10303a to K96243 p < 0.05.
Figure 7
Figure 7. Immunohistochemistry.
(a) Immunohistochemistry scoring assigned for lung sections after microscopic examination. Bars represent mean ± SEM of animals infected with HBPUB10303a (white bars) or K96243 (gray bars). The asterisk (*) indicates significantly different values when comparing HBPUB10303a to the uninfected control animals, p < 0.05. The single cross (†) represents significantly different values when comparing K96243 to the uninfected controls p < 0.05. The double cross (‡) indicates significantly different values when comparing HBPUB10303a to K96243 p < 0.05. (b) Representative images from MPO stained lungs from mice infected with K96243 and HBPUB10303a at days 7 and 14 post-infection.

References

    1. Currie B. J., Fisher D. A., Anstey N. M. & Jacups S. P. Melioidosis: acute and chronic disease, relapse and re-activation. Trans R Soc Trop Med Hyg 94, 301–304 (2000). - PubMed
    1. Currie B. J., Dance D. A. & Cheng A. C. The global distribution of Burkholderia pseupseudomallei and melioidosis: an update. Trans R Soc Trop Hyg 102 Suppl 1, S1–4 (2008). - PubMed
    1. Wiersinga W. J., Currie B. J. & Peacock S. J. Melioidosis. N Engl J Med 367, 1035–1044 (2012). - PubMed
    1. Dance D. A. Melioidosis. Curr Opin Infect Dis 15, 127–132 (2002). - PubMed
    1. Limmathurotsakul D. et al. Systematic review and consensus guidelines for environmental sampling of Burkholderia pseudomallei. PLoS Neg Trop Dis 7, e2105 (2013). - PMC - PubMed

Publication types

Cite

AltStyle によって変換されたページ (->オリジナル) /