This site needs JavaScript to work properly. Please enable it to take advantage of the complete set of features!
Skip to main page content
U.S. flag

An official website of the United States government

Dot gov

The .gov means it’s official.
Federal government websites often end in .gov or .mil. Before sharing sensitive information, make sure you’re on a federal government site.

Https

The site is secure.
The https:// ensures that you are connecting to the official website and that any information you provide is encrypted and transmitted securely.

NIH NLM Logo
Log in
Access keys NCBI Homepage MyNCBI Homepage Main Content Main Navigation
Comparative Study
. 2014 Feb 11:14:147.
doi: 10.1186/1471-2458-14-147.

Measuring underreporting and under-ascertainment in infectious disease datasets: a comparison of methods

Affiliations
Comparative Study

Measuring underreporting and under-ascertainment in infectious disease datasets: a comparison of methods

Cheryl L Gibbons et al. BMC Public Health. .

Abstract

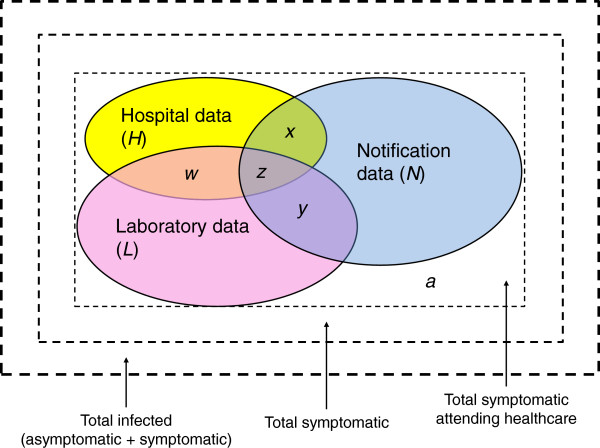
Background: Efficient and reliable surveillance and notification systems are vital for monitoring public health and disease outbreaks. However, most surveillance and notification systems are affected by a degree of underestimation (UE) and therefore uncertainty surrounds the 'true' incidence of disease affecting morbidity and mortality rates. Surveillance systems fail to capture cases at two distinct levels of the surveillance pyramid: from the community since not all cases seek healthcare (under-ascertainment), and at the healthcare-level, representing a failure to adequately report symptomatic cases that have sought medical advice (underreporting). There are several methods to estimate the extent of under-ascertainment and underreporting.

Methods: Within the context of the ECDC-funded Burden of Communicable Diseases in Europe (BCoDE)-project, an extensive literature review was conducted to identify studies that estimate ascertainment or reporting rates for salmonellosis and campylobacteriosis in European Union Member States (MS) plus European Free Trade Area (EFTA) countries Iceland, Norway and Switzerland and four other OECD countries (USA, Canada, Australia and Japan). Multiplication factors (MFs), a measure of the magnitude of underestimation, were taken directly from the literature or derived (where the proportion of underestimated, under-ascertained, or underreported cases was known) and compared for the two pathogens.

Results: MFs varied between and within diseases and countries, representing a need to carefully select the most appropriate MFs and methods for calculating them. The most appropriate MFs are often disease-, country-, age-, and sex-specific.

Conclusions: When routine data are used to make decisions on resource allocation or to estimate epidemiological parameters in populations, it becomes important to understand when, where and to what extent these data represent the true picture of disease, and in some instances (such as priority setting) it is necessary to adjust for underestimation. MFs can be used to adjust notification and surveillance data to provide more realistic estimates of incidence.


Figures

Figure 1
Figure 1
Deriving multiplication factors from the morbidity surveillance pyramid. A: The morbidity surveillance pyramid is often used to illustrate the availability of morbidity data at each surveillance level. With each ascending level (from the community, to healthcare institutions (GPs, hospital, laboratory), to regional and national public health agencies); data availability shrinks and only a fraction of cases from the level below is captured [7-9]. In contrast to the narrow tip of the pyramid which represents data held by national public health agencies, the base is wide as it holds all infections in the community. The difference between the number at the tip and base can be considered cases lost to 'underestimation’ (UE). B: The proportions of infections that are symptomatic, that attend healthcare, and that are reported are represented in this decision tree model. Here, only 55% of all infected individuals attending healthcare are reported through the notification system. If 1000 cases were reported then a MF of 1.8 (=100/55) could be derived and would correct for those underreported cases. The true number attending healthcare would be 1800 cases. Likewise, if only 60% of symptomatic cases attended healthcare, then a MF of 1.7 (=100/60) would correct for under-ascertainment of symptomatic cases. The true number of cases attending healthcare would be 3000 symptomatic cases (=1.7*1800). Finally, since 90% of infections were symptomatic, a MF of 1.1 (=100/90) would correct for under-ascertainment of asymptomatic cases. The true number of infections would be 3300 (=1.1*3000). A MF to correct for total underestimation of symptomatic cases in one step would be 3.06 (=1.8*1.7) and for all infections 3.4 (=1.8*1.7*1.1). 'All infections’ shaded in orange in Figure 1A represents the same population as the orange box in Figure 1B. 'Cases reported’ in blue in Figure 1A represents the same population as the blue box in Figure 1B.
Figure 2
Figure 2
Illustration of a three source capture-recapture study. The outermost square represents the total number of infections occurring in a given population in a given time period, the second square represents the total symptomatic cases, and the innermost square represents all symptomatic cases attending healthcare. In this example, of all infected individuals attending healthcare, all cases - a will appear in at least one data source (which in this example are the laboratory database, hospital database and notifications sent to the public health agency through the notification system). a represents the number of symptomatic cases attending healthcare that were not captured by any data source and remain undiagnosed or not notified (i.e. the underreported cases). x, y, w and z cases are recorded in more than one data source with x, y and w captured in two data sources and z cases captured in 3 data sources. The true number of cases attending healthcare and that should be reported to the national level is: = cases in N + (cases in H (-w -x -z)) + (cases in L (-w -y -z)) + a. Adapted from: [87].

References

    1. Keramarou M, Evans MR. Completeness of infectious disease notification in the United Kingdom: a systematic review. J Infect. 2012;64(6):555–564. doi: 10.1016/j.jinf.201203005. - DOI - PubMed
    1. Wheeler JG, Sethi D, Cowden JM, Wall PG, Rodrigues LC, Tompkins DS, Hudson MJ, Roderick PJ. Study of infectious intestinal disease in England: rates in the community, presenting to general practice, and reported to national surveillance. BMJ. 1999;318(7190):1046–1050. doi: 10.1136/bmj.318.7190.1046. - DOI - PMC - PubMed
    1. Kretzschmar M, Mangen M-JJ, Pinheiro P, Jahn B, Fèvre EM, Longhi S, Lai T, Havelaar AH, Stein C, Cassini A. et al.New methodology for estimating the burden of infectious diseases in Europe. PLoS Med. 2012;9(4):e1001205. doi: 10.1371/journal.pmed.1001205. - DOI - PMC - PubMed
    1. Mangen M-JJ, Plass D, Havelaar AH, Gibbons CL, Cassini A, Mühlberger N, van Lier A, Haagsma JA, Brooke RJ, Lai T. et al.The Pathogen- and Incidence-Based DALY Approach: An Appropriated Methodology for Estimating the Burden of Infectious Diseases. PLoS ONE. 2013;8(11):e79740. doi: 10.1371/journal.pone.0079740. - DOI - PMC - PubMed
    1. Plass D, Mangen M-JJ, Havelaar AH, Gibbons C, Haagsma J, Jahn B, Lai T, van Lier A, Longhi S, McDonald SA. et al.The incidence-based and pathogen-based disability-adjusted life-years approach for measuring infectious disease burden in Europe: the burden of communicable diseases in Europe (BCoDE) project. Lancet. 2013;381:S114.

Publication types

Cite

AltStyle によって変換されたページ (->オリジナル) /