This site needs JavaScript to work properly. Please enable it to take advantage of the complete set of features!
Skip to main page content
U.S. flag

An official website of the United States government

Dot gov

The .gov means it’s official.
Federal government websites often end in .gov or .mil. Before sharing sensitive information, make sure you’re on a federal government site.

Https

The site is secure.
The https:// ensures that you are connecting to the official website and that any information you provide is encrypted and transmitted securely.

NIH NLM Logo
Log in
Access keys NCBI Homepage MyNCBI Homepage Main Content Main Navigation
. 2013 Jul 11;7(7):e2294.
doi: 10.1371/journal.pntd.0002294. Print 2013.

Molecular phylodynamic analysis indicates lineage displacement occurred in Chinese rabies epidemics between 1949 to 2010

Affiliations

Molecular phylodynamic analysis indicates lineage displacement occurred in Chinese rabies epidemics between 1949 to 2010

Xiao-Yan Tao et al. PLoS Negl Trop Dis. .

Abstract

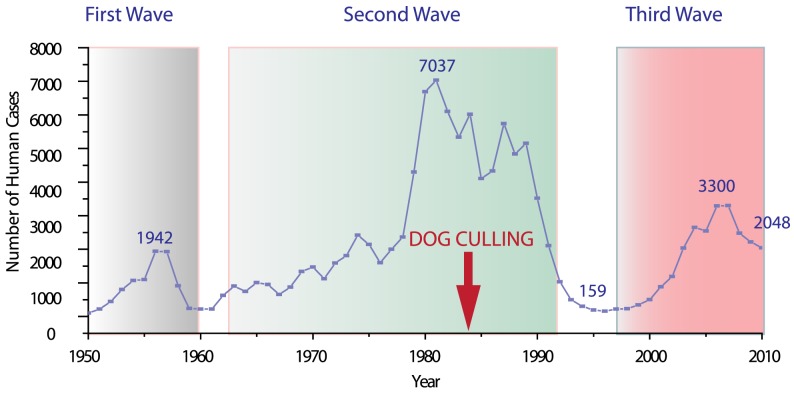
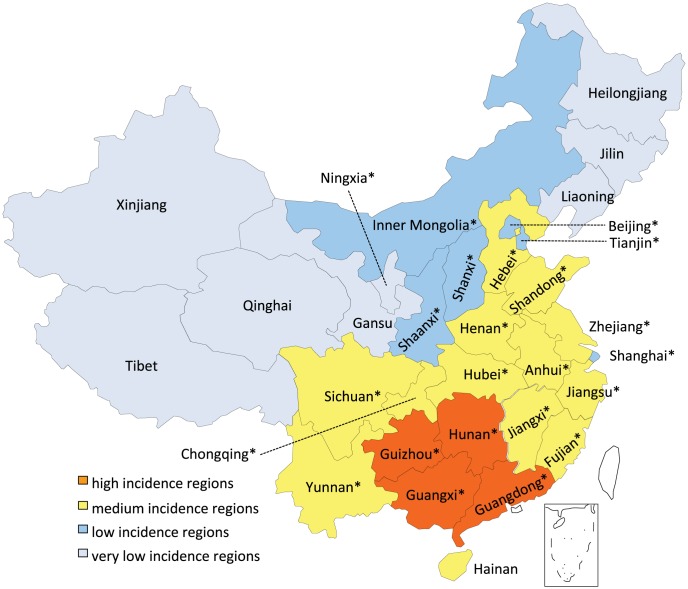
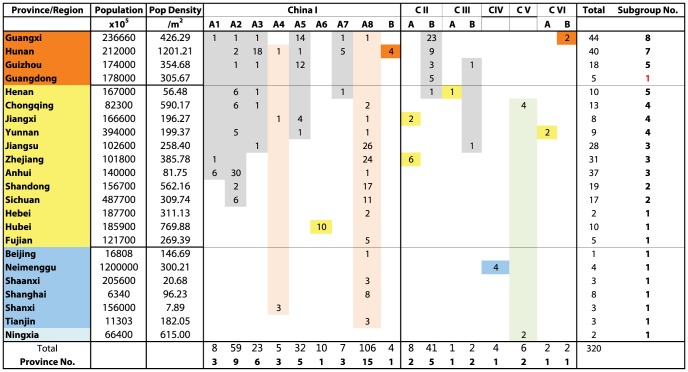
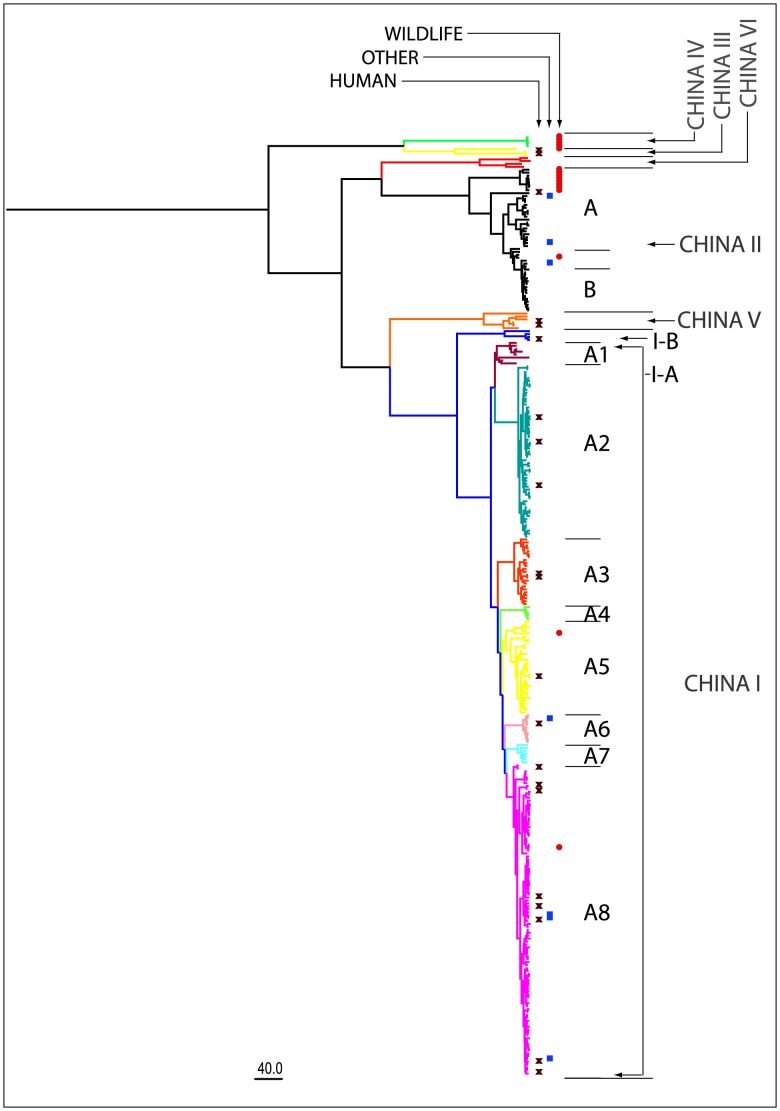
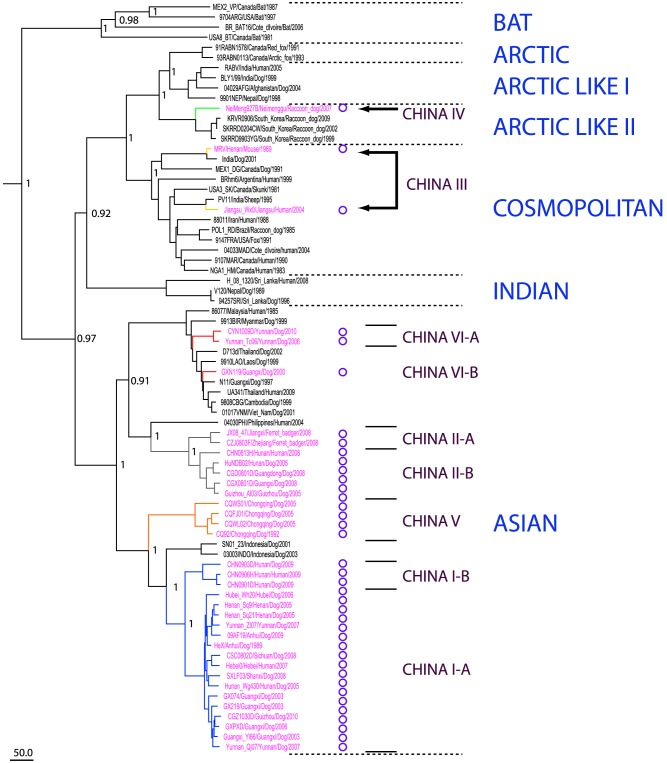
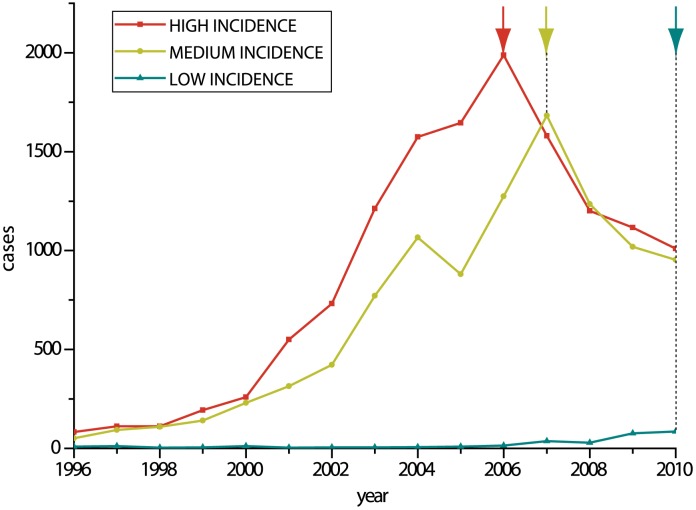
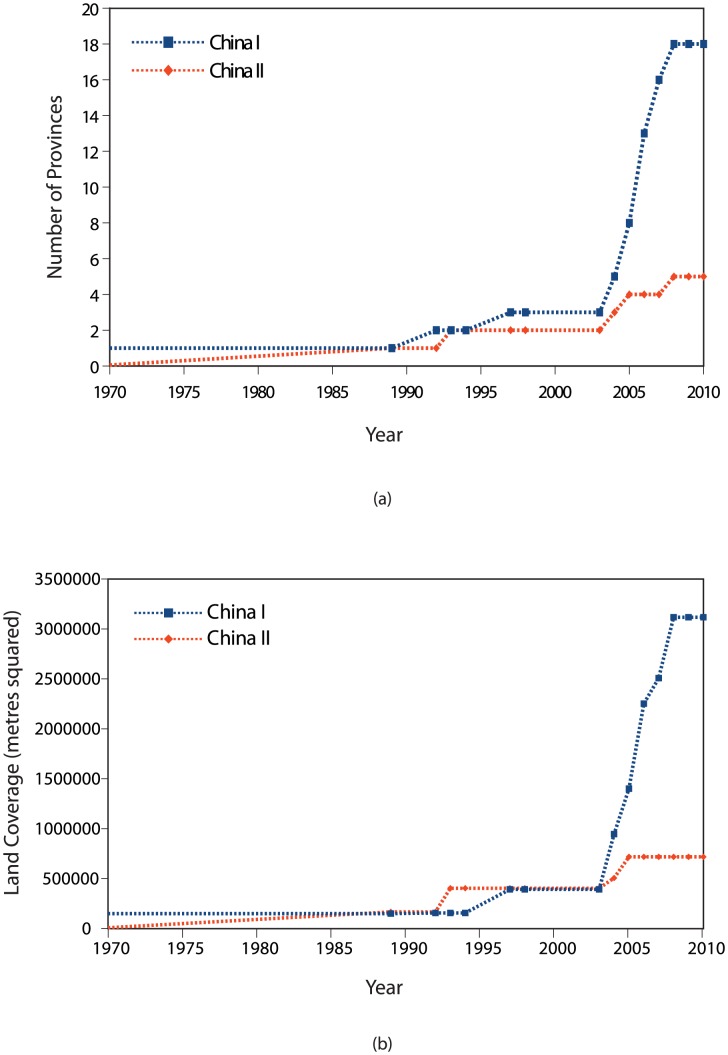
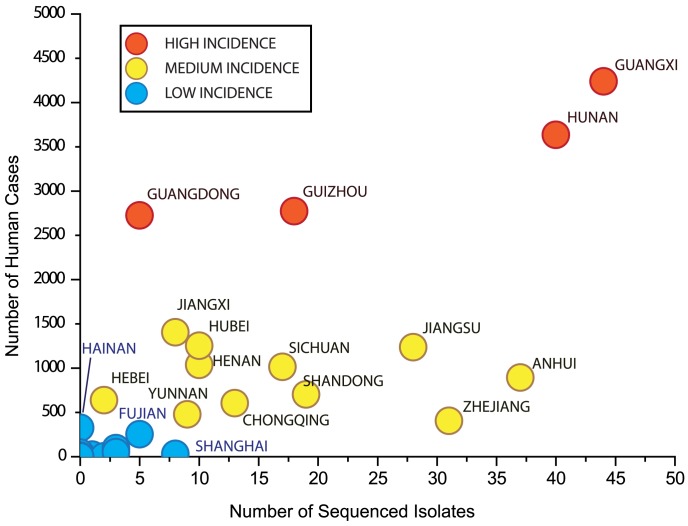
Rabies remains a serious problem in China with three epidemics since 1949 and the country in the midst of the third epidemic. Significantly, the control of each outbreak has been followed by a rapid reemergence of the disease. In 2005, the government implemented a rabies national surveillance program that included the collection and screening of almost 8,000 samples. In this work, we analyzed a Chinese dataset comprising 320 glycoprotein sequences covering 23 provinces and eight species, spanning the second and third epidemics. Specifically, we investigated whether the three epidemics are associated with a single reemerging lineage or a different lineage was responsible for each epidemic. Consistent with previous results, phylogenetic analysis identified six lineages, China I to VI. Analysis of the geographical composition of these lineages revealed they are consistent with human case data and reflect the gradual emergence of China I in the third epidemic. Initially, China I was restricted to south China and China II was dominant. However, as the epidemic began to spread into new areas, China I began to emerge, whereas China II remained confined to south China. By the latter part of the surveillance period, almost all isolates were China I and contributions from the remaining lineages were minimal. The prevalence of China II in the early stages of the third epidemic and its established presence in wildlife suggests that it too replaced a previously dominant lineage during the second epidemic. This lineage replacement may be a consequence of control programs that were dominated by dog culling efforts as the primary control method in the first two epidemics. This had the effect of reducing dominant strains to levels comparable with other localized background stains. Our results indicate the importance of effective control strategies for long term control of the disease.


Conflict of interest statement

The authors have declared that no competing interests exist.

Figures

Figure 1
Figure 1. The three rabies epidemic waves in Mainland China since 1949.
Y-axis shows annual number of human of rabies cases in China from 1950 to 2010. Since the foundation of the People's Republic of China, the country has experienced three rabies epidemics. The country is currently in the midst of a third epidemic that begun in 1996 (159 cases), peaked in 2007 (3300 cases) and has begun to gradually decrease since this time. Red arrow indicates the beginning of a concerted dog culling program implemented in 1984.
Figure 2
Figure 2. Geographical distribution of rabies cases in China.
Based on number of recorded human cases, provinces and regions can be classified into high, medium, low or very low incidence regions. The map shows the provinces are grouped according to incidence and reflects the spread of the epidemic from its origin in south China to the bordering medium incidence regions and out to the low and very low incidence regions. Provinces and municipalities with sequences used in this study are marked with a ‘*’.
Figure 3
Figure 3. Number of isolates according to province and clade.
Provinces are grouped and colour coded according to the high (H), medium (M), low(L) and very low (V) incidence regions defined in Figure 2. The first two columns after the province name show the population and population density for each province. The subsequent columns correspond to the clades and subclades defined in the tree in Figure 4 and show the number of isolates collected for each province and clade/subclade combination. Rightmost column shows the total number of isolates collected for each province. Bottom two rows show the total number of isolates and total number of provinces in each clade/subclade.
Figure 4
Figure 4. Phylogenetic analysis of China G sequence datasets.
The MCC tree of 320 complete G sequences of rabies street strains in China. Consistent with earlier studies, isolates are classified into six major clades China I to VI, with China I and II containing the majority of samples. However, the tree is distinct from previous results in that there are relatively fewer isolates placed in clade II, indicating that China I is now the dominant clade. This clade can be further subdivided into eight major branches with high support. The figure also shows the distribution of hosts throughout the clades. The majority of isolates are from dogs, but human isolates are marked with an X (left column) domesticated animals such as cattle are marked with a blue square (middle column) and wildlife are marked with a circle (right column).
Figure 5
Figure 5. Phylogenetic analysis of World sequence dataset.
World tree of representative dataset of 74 world sequences including 37 sequences from the China dataset (these are marked with a circle after the sequence name). The tree shows that China I, II, V & VI are sublineages of the Asian clade, China III corresponds to Cosmopolitan and China IV corresponds to the Arctic-like clade.
Figure 6
Figure 6. Number of rabies cases in high, medium and low incidence regions, 1996–2010.
The graph shows the same data as figure 1, but according to the high, medium and low incidence regions defined in figure 2. The graph shows that while the number of cases in the high incidence regions peaked in 2006, consistent with national data, the number of cases in the medium incidence regions continued to rise for another year (marked by arrows at the top of the graph). The number of cases in low incidence regions continues to rise.
Figure 7
Figure 7. Change in geographical dispersion of China I and China II lineages over time.
Graphs show the change in geographical coverage over time for the two major lineages China I and China II lineages over the course of the current epidemic. Coverage was measured in terms of (a) number of provinces reporting each lineage and (b) total land area in square metres based on the summed area of the provinces reporting each lineage. In the early stages of the epidemic, the two clades showed similar dispersion patterns, but after 2005 China I rapidly expanded whereas China II isolates were only collected in existing regions.
Figure 8
Figure 8. Investigation of sampling accuracy.
Graph shows total number of isolates collected for each province versus the corresponding total number of human rabies over the course of the current epidemic.

References

    1. Nadin-Davis SA, Real LA (2011) Molecular phylogenetics of the lyssaviruses–insights from a coalescent approach. Adv Virus Res 79: 203–238. - PubMed
    1. Kuzmin IV, Shi M, Orciari LA, Yager PA, Velasco-Villa A, et al. (2012) Molecular Inferences Suggest Multiple Host Shifts of Rabies Viruses from Bats to Mesocarnivores in Arizona during 2001–2009. PLoS Pathog 8: e1002786. - PMC - PubMed
    1. Wunner WH, Briggs DJ (2010) Rabies in the 21 century. PLoS Negl Trop Dis 4: e591. - PMC - PubMed
    1. Tang YZ, Liu L, Pan MM, Wang YM, Deng GH (2011) Evolutionary pattern of full hepatitis B virus genome during sequential nucleos(t)ide analog therapy. Antiviral Res 90: 116–125. - PubMed
    1. Tang X, Luo M, Zhang S, Fooks AR, Hu R, et al. (2005) Pivotal role of dogs in rabies transmission, China. Emerg Infect Dis 11: 1970–1972. - PMC - PubMed

Publication types

Associated data

Cite

AltStyle によって変換されたページ (->オリジナル) /