This site needs JavaScript to work properly. Please enable it to take advantage of the complete set of features!
Skip to main page content
U.S. flag

An official website of the United States government

Dot gov

The .gov means it’s official.
Federal government websites often end in .gov or .mil. Before sharing sensitive information, make sure you’re on a federal government site.

Https

The site is secure.
The https:// ensures that you are connecting to the official website and that any information you provide is encrypted and transmitted securely.

NIH NLM Logo
Log in
Access keys NCBI Homepage MyNCBI Homepage Main Content Main Navigation
Review
. 2013 Jul 17;10(86):20121018.
doi: 10.1098/rsif.2012.1018. Print 2013 Sep 6.

Sensitivity analysis of infectious disease models: methods, advances and their application

Affiliations
Review

Sensitivity analysis of infectious disease models: methods, advances and their application

Jianyong Wu et al. J R Soc Interface. .

Abstract

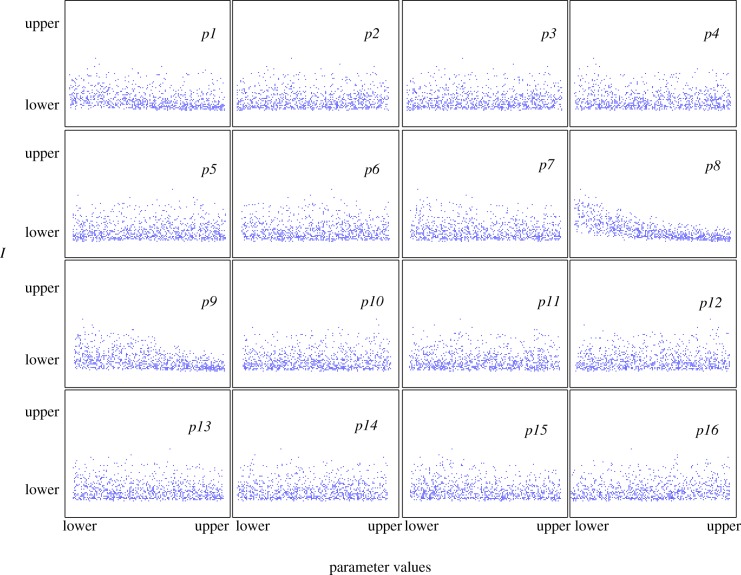
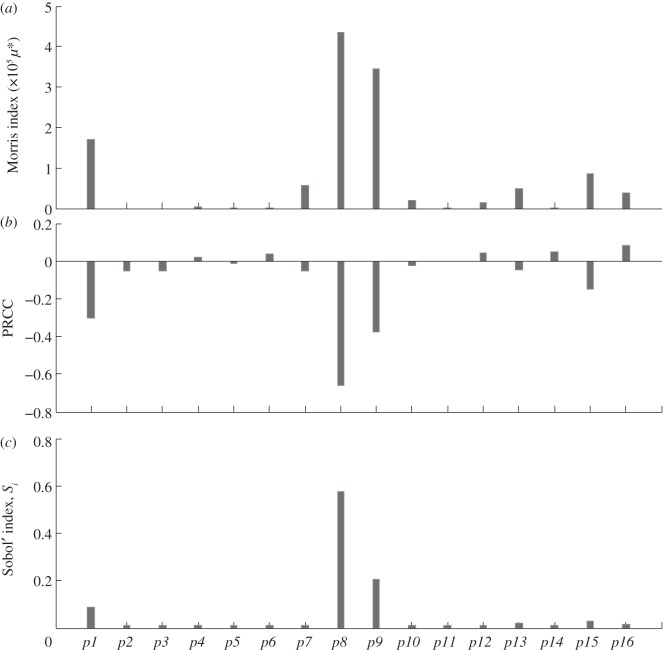
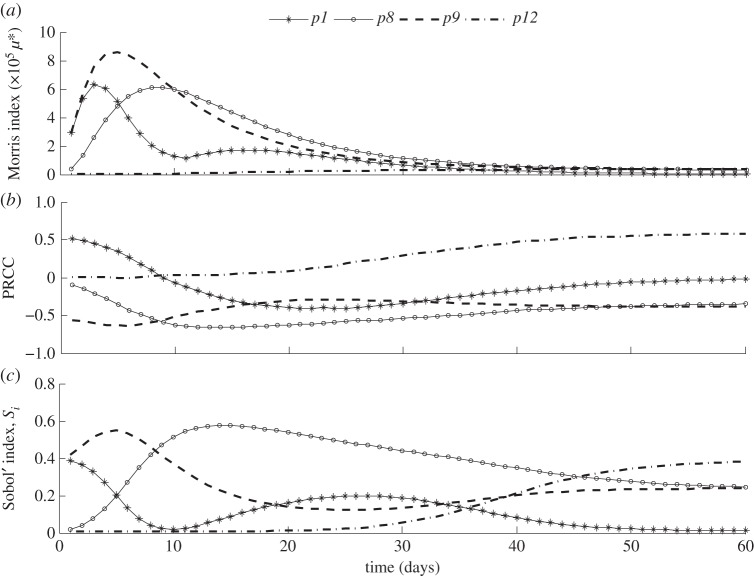
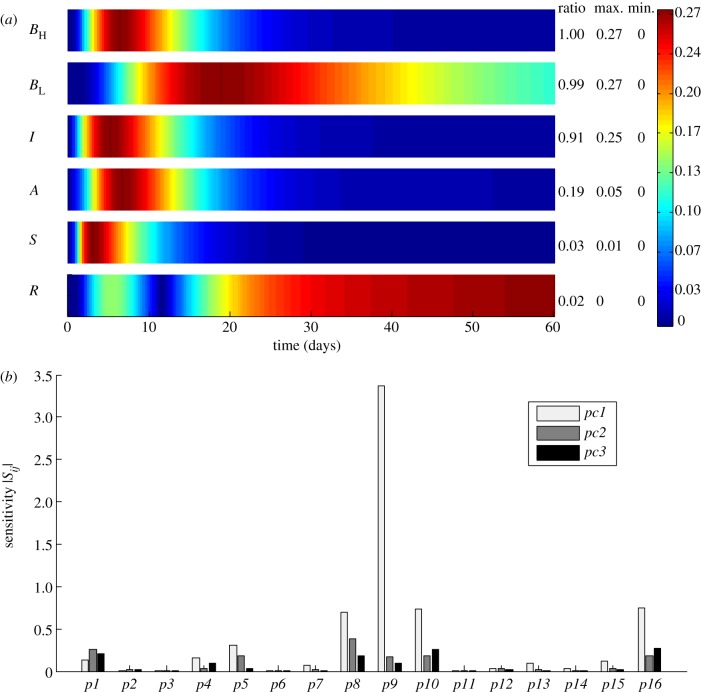
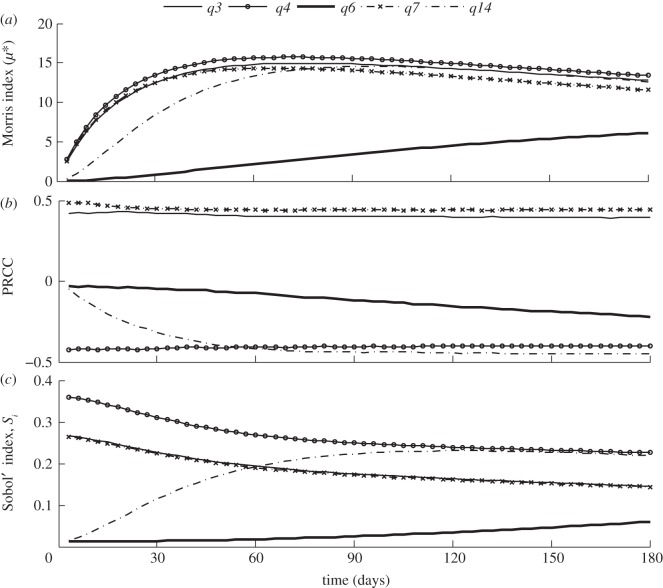
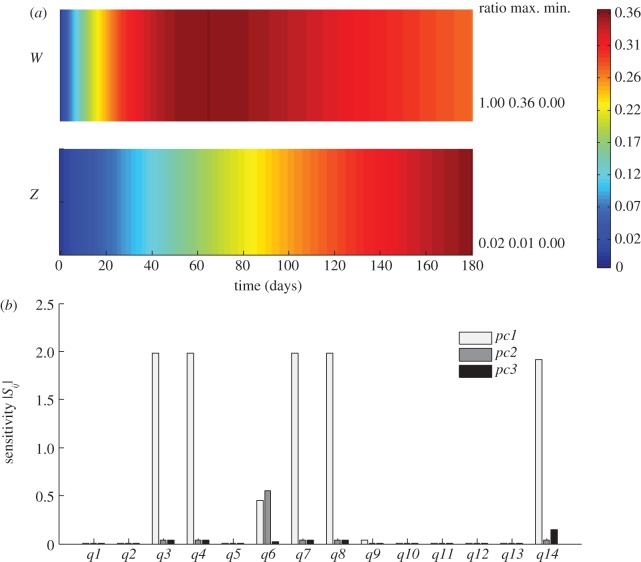
Sensitivity analysis (SA) can aid in identifying influential model parameters and optimizing model structure, yet infectious disease modelling has yet to adopt advanced SA techniques that are capable of providing considerable insights over traditional methods. We investigate five global SA methods-scatter plots, the Morris and Sobol' methods, Latin hypercube sampling-partial rank correlation coefficient and the sensitivity heat map method-and detail their relative merits and pitfalls when applied to a microparasite (cholera) and macroparasite (schistosomaisis) transmission model. The methods investigated yielded similar results with respect to identifying influential parameters, but offered specific insights that vary by method. The classical methods differed in their ability to provide information on the quantitative relationship between parameters and model output, particularly over time. The heat map approach provides information about the group sensitivity of all model state variables, and the parameter sensitivity spectrum obtained using this method reveals the sensitivity of all state variables to each parameter over the course of the simulation period, especially valuable for expressing the dynamic sensitivity of a microparasite epidemic model to its parameters. A summary comparison is presented to aid infectious disease modellers in selecting appropriate methods, with the goal of improving model performance and design.

Keywords: Morris method; Sobol’ method; infectious disease modelling; partial rank correlation coefficient; sensitivity analysis; sensitivity heat map.


Figures

Figure 1.
Figure 1.
Scatter plots illustrating the relationship between the cholera model infected population size, I, examined at the peak of the epidemic (t = 15) and parameters.
Figure 2.
Figure 2.
Sensitivity of the infected population size to changes in parameters in the cholera model as indicated by (a) the Morris index, μ*, (b) the PRCC index and (c) the Sobol’ index, Si.
Figure 3.
Figure 3.
The temporal variation of the sensitivity of the infected population size to key parameters in the cholera model indicated by (a) the Morris index μ*, (b) the PRCC index and (c) the Sobol’ index Si. Sensitivity to all model parameters is shown in the electronic supplementary material, figure S2.
Figure 4.
Figure 4.
(a) SHM and (b) PSS for the cholera model, following previous work [11].
Figure 5.
Figure 5.
Temporal variation of the sensitivity of the worm burden (W) to key parameters in the schistosomiasis model as indicated by (a) the Morris index μ*, (b) the PRCC index and (c) the Sobol’ index, Si. Sensitivity to all model parameters is shown in the electronic supplementary material, figure S3.
Figure 6.
Figure 6.
(a) SHM and (b) PSS of worm burden (W) and snail density (Z) for the schistosomiasis model, following previous work [11].

References

    1. Anderson RM, May RM. 1991. Infectious diseases of humans: dynamics and control. Oxford, UK: Oxford University Press.
    1. Grassly NC, Fraser C. 2008. Mathematical models of infectious disease transmission. Nat. Rev. Microbiol. 6, 477–487. - PMC - PubMed
    1. Keeling M, Rohani P. 2007. Modeling infectious diseases in human and animals. Princeton, NJ: Princeton University Press.
    1. Hooker G, Ellner SP, Roditi LD, Earn DJD. 2011. Parameterizing state-space models for infectious disease dynamics by generalized profiling: measles in Ontario. J. R. Soc. Interface 8, 961–974. (10.1098/rsif.2010.0412) - DOI - PMC - PubMed
    1. Okais C, Roche S, Kurzinger ML, Riche B, Bricout H, Derrough T, Simondon F, Ecochard R. 2010. Methodology of the sensitivity analysis used for modeling an infectious disease. Vaccine 28, 8132–8140. (10.1016/j.vaccine.2010年09月09日9) - DOI - PubMed

Publication types

LinkOut - more resources

Cite

AltStyle によって変換されたページ (->オリジナル) /